
Recommended
More Related Content
What's hot
What's hot (20)
Viewers also liked
Viewers also liked (20)
Similar to Situation Analysis
Similar to Situation Analysis (20)
Situation Analysis
- 1. Introduction Through this research, we have found that PetSmart should hone in on the “pet parent” as a core demographic. “Pet parents” view their pets as part of the family and see this animal as a huge priority in their lives. This demographic is extremely important because of the growth we have seen from it in the last decade. Today, people are increasing more likely to agree that they are a “pet parent.” Efforts to target this market segment should be a retailer’s main focus. We also examined PetSmart’s competitors in this research. Petco is their main competitor, along with major supermarket chains like Target and Walmart. Each of these stores offer something a bit different than PetSmart, but PetSmart has a heads up on these other stores because of their expertise. This competitor analysis in down in the Situational Analysis, which provides great insight into the pet superstore industry. After the Situational Analysis’ secondary research had been conducted, we moved onto a more direct research, primary. We completed this research by conducting a survey and focus group. Our survey was conducted online using QwikSurvey to the “pet parent” demographic. We did have a few people begin the survey who were not “pet parents,” however, we used a question to screen our participants. We got 122 participants to take our survey by emailing the link out to family and friends who could be categorized as someone who views their pet as their top priority. This survey gave us lots of insight into the beliefs and attitudes of our target market. We were able to see how they thought and viewed certain pet ideas and products, which allowed us to grasp our demographics' buying Jim and Janice Dougherty first conceived the idea for a pet superstore in 1986; habits. We observed this by asking questions that observed monthly however, the first two stores did not open up until 1987. The stores opened in Arizona and were spending and shopping frequency. This survey gave us a lot of insight. For called PetFood warehouse. Shortly after opening, the names changed in 1989 to the official and example, men and women are not very different in terms of cause related current name, PetSmart. The company started out by opening each store individually but then marketing and women tend to value quality over price. began to buy out smaller chains to better adapt to the quickly growing market. After the survey was conducted and we had enough participants, In the following decade PetSmart expanded its business by offering a variety of we began analyzing the data. This qualitative data gave us more to go on services. It began to offer full-service pet salons, mobile pet clinics, an equine department, pet than the quantitative data that we had in the Situational Analysis. We adoption centers, and the list continues to grow. Not only did PetSmart expand its company in downloaded our results onto SPSS which provides more in-depth insight the competitive market but it also began charitable foundations and in 1994 formed PetSmart from charts and tables. We also conducted a focus group that gave us more charities. Many of its efforts went into preventing pet overpopulation and euthanasia. These insight to our survey results. We created a Moderator Guide and objectives efforts allowed PetSmart to open its 1000th store in 2007. to help keep us on track during our focus group. The qualitative data was The current trend in the pet superstore industry is focused on pet health. PetSmart is very important to our research as it helped us make recommendations to our promoting nutrition for animals by using natural products. Even through the economic client, PetSmart and to also understand the consumer further. downturn people are treating their pets like family and are becoming increasingly conscious of All in all, after conducting both qualitative and quantitative the health of their pets. They are currently moving away from the “mart” mentality to the research, we gained valuable insight into the “pet parent” demographic. “smart” mentality when it comes to caring for your pet, which is why they have steered away These recommendations include pet adoption, chartity awareness, quality, from PetsMart. and changed their name to PetSmart. Instead, PetSmart wants to be viewed as a clever advertisements, and incentives. We are now more accuratly able to pet specialty store who trains its employees to specialize in an array of pet products. This target this market segment because of our research efforts. knowledge is portrayed not only by its employees expertise but also from the services the it
- 2. Industry Overview Brief History Although historians are not positive as to when humans first started keeping animals as pets, they do know that dogs were one of the primary animals to be domesticated. In ancient Egypt, dogs and cats were animals of great importance. Taking the life of a greyhound held the same consequences as taking the life of a man. The Egyptians considered cats to be demigods or “half-gods” and began domesticating wildcats from Africa. Because of their high status, they were prized and had higher importance than a human. If a house was burning down, the cat would have been saved first. The Romans domesticated animals as well. Unlike the Egyptians, cats and horses were both used as working animals. They instead regarded birds and dogs as pets. Towards the Middle Ages, pets were a luxury only to be had by the upper classes. Because of the infamous witch-hunts, many owners and their cats were put to death on accusations of witchcraft. This jumpstarted the popularity in dogs as pets. The first pet food to be created was bird food. During the 1800s many people owned birds for their singing abilities. Shortly after this, the first dog food was invented in 1860. World War II brought about the idea of canned dog food and in the 1920s people began to keep reptiles as pets. The first cat litter was created in 1947, making it much more practical to keep a cat as an indoor pet. With all of the advances in technology and information, people began to create different types of pet treats and products. It was only a matter of time for companies like PetSmart and PetCo to enter the scene. Timeline 1965 Walter Evans opened veterinary supplies business called United Pharmaceutical Company, or UPCO 1980 Petco opens first store outside of California 1986 PetSmart founded by Jean and Jim Daugherty as Pacific Coast Distributing, Inc. 1994 Pet Smart Charities was founded—Petco went public as the largest pet specialty retail chain in the industry 1999 PetCo Foundation was established for charitable giving to animal-related causes 2001 Launch of Petco.com 2
- 3. Size of Industry Sales They have similar values and concepts as PetSmart (15). The rest of The pet superstore industry has seen a steady increase over the market is made up of companies targeted towards discount prices the past five years. Even through the United States’ economic such as Wal-Mart, Pet Supplies Plus, or smaller private companies crisis, the pet industry has consistently increased revenue, keeping (15). its recession-resistant claim. According to Packaged Facts, the sales of pet products and services rose by 5 percent in 2009, adding Advertising During the past five years the amount spent on the advertising two and a half billion dollars to the industry. The industry seems to industry has generally increased, with the exception of a slight decline be growing, especially with the help of the “pet parent.” Those who in 2009. According to Ad$pender, the main media outlets are network, view their pet as part of the family are less likely to agree to cut cable and television. In the 2004, over $242 million was spent in the back on their shopping habits for their pets. In 2009 Packaged industry. There has been an pretty steady increase in sales from 2004 Facts polled pet owners and 19 percent strongly disagreed that they all the to the last year of data available, which is 2010. In 2010, over would spend less on pet products because of the economy. $678 million was spent on advertisements. By breaking down the Quarterly Analysis for Pet Superstore expenditures by quarters, one will see that the most money was spent Industry in the third quarter (July 1-September 30). This trend in 120,000.00 advertisement is most likely a result of pet owners being more active during the warmer months. 100,000.00 Amount Spent 80,000.00 Totals from Stages in the Product Life Cycle Year 2006-2010 The pet superstore industry is in the growth stage of the product life 60,000.00 cycle (14). 40,000.00 20,000.00 PetSmart and Petco Sales 0.00 9,000 Quarter 1 Quarter 2 Quarter 3 Quarter 4 8,000 7,000 6,000 Sales (000) Quarter 5,000 Source: Ad$pender 2010 Figure 1 4,000 3,000 2,000 Competitors 1,000 PetSmart’s primary competitor is Petco. Between the two 0 companies they are the leaders in retail for the pet industry. In 2004 2005 2006 2007 2008 2009 2008 they had a combined sales of almost $8 billion (15). Years Petco alone had sales over $2.7 billion in 2008. They have Source: Packaged Facts Figure 2 been able to increase rate of sales at a healthy pace since 2000. 3
- 4. Seasonality Economy of Industry According to media expenditures, the pet supermarket Despite the recent economic downturn, many people are industry spends the most advertising money during the third and continuing to be emotionally attached to their pets and are fourth quarters. The industry spends more money during the warm becoming more conscious of their pet’s health. The fact that pet months of the year and around the winter holiday season (Ad ownership is increasing reinstates the positive outlook on the pet $pender). In 2010 the pet supermarket industry spent 22,918.8 superstore industry. It is helping put the industry in a recovery million in the third quarter, which far exceeds 16,399.8 million phase. According to American Pet Products Association that was spent in the first quarter. It is safe to assume that the President Robert Vetere, “people become more attached to their reason behind the increase in the third quarter is that pet owners pets in times of uncertainty and stress, so we continue to reward want to spend more time outdoors with their pets when the them for their unconditional love and companionship. Couple weather is nice, and people also are inclined to be more active this with the trend of humanizing products and services for our during the warmer seasons. This results in the need for more pets and the result is an overall increase in spending so we can supplies (i.e. toys, treats for training, leashes, etc.). The strengthen that human animal bond” (14). conclusion for higher spending in the fourth quarter could be Pet products and service rose by 5 percent in 2009, attributed to the ever-growing idea of “pet parents,” the idea that adding two and a half billion to the market during the recession. your pet member is part of your family. The fourth quarter of the Retail sales in the pet superstore industry have been projected to year contains many of the winter holidays, and during these increase by 2.5 percent throughout 2010. Housing and holidays spending on advertising and consumer spending on employment are also supposed to improve. The economy is purchasing increases. If people consider their pets’ part of their slowly but surely recovering (14). family they are not only going to increase purchases for their family but for their pets as well. The average spending in the Legal & Regulatory Issues third quarter from 2006- 2010 is at least 20,006.6 million above There are very strict regulations within the pet industry. every other quarter. The ad industry has taken this into account Organizations like the Food and Drug Administration (FDA), when devising strategies for targeting time periods where there is American Pet Products Association (APPA), the US an increase in consumerism. Environmental Protection Agency (EPA), and the Pet Industry Distribution Association (PIDA) work to help enforce these laws at local, state, and federal levels. These regulations apply to Growth Potential/Forecasts anyone in or looking to become a part of the pet industry. Laws According to Packaged Facts, the pet superstore industry have been put in place to monitor and regulate the labeling, sale, outlook is very promising. Right now the leading share in the and production of all pet products as well as shipping, handling, market is veterinary services. In 2009, sales in this category and sale of animals. In 1951 the Pet Animals Act required a increased by 10 percent and had a projection of a 6 percent sales license to own a pet shop. rate increase in 2010 and 2011 (15). With the advancement in The FDA works hand in hand with the department of medical supplies and procedures for pets, along with an increase agriculture for each state on a general scale to regulate the in the importance of the “pet-parent” relationship, the veterinary manufacturing and distribution of pet food and more specifically market will consist of 41 percent of sales by 2014 (14). every single ingredient used has to meet certain standards 4
- 5. depending on the state. In 2007 the Food and Drug Amendments Authorization Act required the FDA to spread new laws for pet food by 2009 and under the Bioterrorism Act, all food must be registered with the FDA. Most states have very particular procedures for registering all pet products sold. Products that fall with in the category of pesticides must register through the EPA. Like registration for pet food, there is also a registration fee concerning pesticides. Some products may be excluded from the pesticide list, if and only if, all ingredients are exempt. An issue that the pet industry is facing more every day is the ownership of exotic animals. One of the most recent laws imposed by the government was the captive wildlife and safety act in 2003. This law addresses the concerns regarding the private ownership of big cats in the United States. This law was imposed after a 10 year old boy was attacked and mutilated by his aunt’s 400 pound tiger. The law makes it illegal to move certain types of live big cats across the U.S. borders unless you qualify as exempt. There are many strict regulations about the sale, transportation and ownership of animals in the United States. Due to the Pet Animals Act of 1951, a license is required in order to open and run a pet shop. Registration forms must be filled out and transportation must take place within a certain and quick timeframe to best benefit the animal. The Animal Welfare Act (AWA) sets a minimum of standards for the handling of commercial animals. The purpose for shipping or transporting the animal must be clearly defined and approved. Currently in Glendale, California the City Council has been trying to ban the sale of dogs and cats within the city limits. Organizations like PIJAC (Pet Industry Joint Advisory Council) are fighting against bans like this because the results of such a ban will not create a positive situation for the pets. Societal & Cultural Considerations The most popular cultural trend in the pet industry right now is that of the “pet parent.” The human-animal correlation is what Packaged Facts calls an “untapped goldmine” (14). Pets as Family: In 2009, 75 percent of cat owners highly agreed that they would consider their cat as a family member, 77 percent of dog owners highly agreed, and 73 percent of all pet owners highly agreed that their pets are a part of the family (15). This trend is great for the pet industry because the U.S. Pet Ownership & Demographics Sourcebook’s data suggests that those who consider their pet as family tend to spend more money on their pet than those who don’t (15). Traveling and Pets: As people follow the trend of being a “pet parent,” they also become more inclined to follow other trends, like traveling with their pets. This has opened up an entirely new aspect to the pet industry with airlines and hotels providing pet oriented alternatives. Under the Safe Air Travel for Animals Act, placed effective in June 2005, requires airlines to report all incidents involving animals to the Department of Transportation’s Aviation Consumer Protection Division (ACPD). This has brought about a new form of emphasis on pet travel and has inspired services like Delta’s Pet First (14). When pet owners cannot bring their pets with them, there are options like PetSmart’s PetHotels, a service that allows the owner to leave their pet in a safe and reliable environment while they are absent. (19) Green Movement: The pet industry is no exception to the fast-growing trend of going green. This green movement is beneficial for the animals and for companies’ business aspect. The green products draw customer appeal and change like the one that Cardinal Labs in Azusa, CA have made by switching to run their plant solely on solar power, which in turn helps save money (14). 5
- 6. Mobile Grooming and Veterinary Care: Right now there is only a small following but this type of grooming is the hottest trend in the pet supermarket industry right now. Petco has recently paired up with Aussie Pet Mobile, who was named #1 in the pet category of Entrepreneur's magazine Franchise 500 list (14). Packaged Facts predicts that mobile veterinary care, like ambulances, will hit a high growth rate within the next few years (14). Client Profile Company History Jim and Janice Dougherty formed the idea for a “PetFood Warehouse” in 1986. By the next year, PetFood Warehouse was opened in Phoenix, Arizona. The company changed its name to PetSmart in 1989 based on the slogan, “We’re a MART for PETs that’s SMART about PETs.” During the same year, the company began its first full-service, in-store salon for dogs and TV commercials (19). Over the next three years the company expanded to obtain a larger customer base. PetSmart proudly presented its first private pet food labels in 1992. Because the labels are exclusive to the company, it brought higher margins than other foods (19). Ironically, in 1993 the company bought Unipet Distributors. Not only was this the first company PetSmart bought, but it was also the company where the pet product warehouse idea initially started. A year later PetSmart formed PetSmart Charities, Inc. This nonprofit organization is dedicated to ending euthanasia of animals and helping homeless pets find homes (19). Between 1995 and 1996 PetSmart hit the billion dollar mark, bought three more companies and went international by opening stores in Canada. Coming into the new millennium PetSmart bought PetsHotel Plus, a pet boarding hotel that had huge potential for customer appeal and finally opened two stores within two years (19). In 2006 the company unveiled Smart Nutrition Selector online and in stores. This program suggests list of foods that will best suit the pet’s needs. Finally, the company hit their 1,000th store mile marker in 2007, only two decades after the first one opened (19). Now, PetSmart is proud to stick by its original vision, “To provide Total Lifetime Care to every pet, every parent, every time” (19). PetSmart currently operates more than 1,197 stores in the United States, Canada and Puerto Rico. It provides a wide variety of products and services making it the largest specialty pet retailer in the pet supply industry (19). Between the PetSmart salons, PetsHotels, Doggie Day Camps, PetSmart Charities and The Pet Hospital, PetSmart provides ample amount of convenient service for pet-parents today. Targeted Audience For PetSmart, the target audience is directed toward younger generations who are delaying starting a family and, instead, getting a pet. This target audience, referred to as the “pet parent,” considers his or her pet as more than just an animal. They also target adult females with higher income who can afford to take care of their pet. The company targets its consumers through a variety of services aimed to attract new pet parents. The grooming, pet training, PetsHotels and Doggie Day Camp are their largest sectors. These programs provide the company with a better understanding of their customers, which can help change their behavior and build long-term loyalty. PetSmart has incorporated sustainable initiatives into its marketing. “Going green” is the most popular marketing for most industries at the moment, and Packaged Facts predicts that within the next decade most companies will become more sustainable. This will not only appeal to current customers but also help to reign in more customers (14). 6
- 7. PetSmart’s Annual Sales Growth Sales Data 14.00% Despite the U.S. recession, the pet supply industry 12.00% has remained recession-resistant. Sales of pet products and services actually rose 5percent in 2009 (14). 10.00% As shown by the graph, “PetSmart – Annual Sales Percent 8.00% Growth,” PetSmart had total revenues of $5.7 billion in 6.00% Total 2010 which was an increase from the previous year’s Sales total sales of $5.3 billion (20). 4.00% It is predicted that the pet supply industry will 2.00% continue to have a higher demand because of the 0.00% emotional bond between pet owners and pets. Many 2001 2002 2003 2004 2005 2006 2007 2008 2009 2010 view their pet as a member of the family which proves Years an advantage for pet markets (14). Source: 20, RetailSails Annual Sales Data Figure 3 Advertising Expenditures Advertising Expenditures Over the past five years, PetSmart has used various $80,000.00 advertising methods to promote its products and services. $70,000.00 The economy has had some effect on advertising budgets throughout the years. $60,000.00 Referring to the graph (Advertising Expenditures), $50,000.00 Advertising there was a steady rise in expenditures from 2006 to 2008. Expenditures: $40,000.00 However, the recession did cause PetSmart to cut back on (Ad$pender) its advertising budget in 2009, only to increase the budget $30,000.00 in 2010 for the highest amount spent in the past five years $20,000.00 (3). $10,000.00 With the exception of 2009, PetSmart has consecutively increased spending on advertising from 2006 to 2010, $0.00 capping at over six million dollars on advertising in 2010. 2006 2007 2008 2009 2010 The categories that have drawn the most money are Cable Years TV, Syndication and Network TV (3). Source: Ad$pender Figure 4 7
- 8. Media Mix PetSmart’s Total Media Spending PetSmart’s advertising expenditures range from 11 different (2006-2010) media outlets. From Cable TV to Outdoor advertising the company Outdoor has a wide breadth of promotional efforts. Nat Spot Radio PetSmart's media mix involves various media outlets. Television, Network Radio syndication and radio are amongst the largest categories that are used Newspaper PetSmart throughout the campaign (3). The chart demonstrates PetSmart media National Spending Total mix in 2010. The expenditures that were least used were Sunday Newspaper Sunday (2006-2010) Magazine at 0 percent, Outdoor at 18 percent and Spot TV at 36 Magazine Magazine percent. These media outlets were seen as least useful in the Spot TV marketing mix and were therefore less used. Syndication The expenditures that draw the most money are Cable TV at Cable TV 42.19 percent, Syndication at 24.52 percent and Network TV at 15.39 Network TV percent. PetSmart has consecutively increased spending on 0 20000 40000 60000 80000 100000 advertising from 2006 to 2010. It spent over six million dollars on advertising in the year 2010 alone (3). Source: Ad$pender Figure 5 Creative Strategy PetSmart strategy highlights the services that the company offers as well as implementing seasonality ads. During the fall, PetSmart sends out a series of ads about Black Friday, the day after Thanksgiving where Christmas shoppers find great deals on gifts for the holidays. Another example is the promotion of Easter, which can be seen to the left. Using the seasonality strategy gives customers an excuse to go into the store and provide them with ideas. PetSmart plays up its in-depth service features because they believe consumers will see it as a benefit to themselves and their pets. Every company’s main purpose, when implementing advertising strategies, is to get the consumer interested in their store or brand. Obviously, PetSmart has completed this task by being the largest pet superstore retailer of servicers of and solutions. 8
- 9. Positioning “PetSmart moved away from the “mart” mentality and focused on providing “Smart” solutions and information” (19). PetSmart wants its customers to see the company as more than just a store’ instead, it wants customers to see the employees as individuals who care about their pet as much as the owners. This is shown by the extensive employee training, superior customer service and the outstanding services provided within each store and the quality of products sold. PetSmart bases its position on customers finding superior products and exclusive services for an affordable price in one convenient location. By creating its own private pet food and the Nutrition Selector program, . PetSmart’s position is based on customers finding superior products and exclusive services for an affordable price in one convenient location. The company has taken steps toward its position by creating its own private pet food labels and a program, Smart Nutrition Selector, which guides pet owners to get the best quality and services for their specific pet (19). It has also implemented a customer loyalty program called PetPerks. This program will allow PetSmart to customize its marketing and communicate more effectively with its customers (19). With convenient prices, several locations, products and services, PetSmart makes it easy to satisfy consumers’ needs. Specifically, the company’s vision is “to provide Total Lifetime Care to every pet, every parent, every time” and its slogan is “Happiness in store” (19). These sum up PetSmart’s positioning on how it wants its customers to view the company. It seeks to provide the best service and products possible to keep the customers and pets happy. Cause Related Marketing PetSmart founded PetSmart Charities, Inc. in 1994. This is an “independent, nonprofit organization that creates and supports programs that save the lives of homeless pets, raise awareness of companion animal welfare issues and promote healthy relationships between people and pets” (19). By providing more than $134 million in grants and programs that benefit animal welfare organizations, PetSmart Charities has assisted saving the lives of more than 4.5 million pets (19). Its vision is simple: “A lifelong, loving home for every pet.” This shows how PetSmart is more than just a company trying to make money, but a company that truly cares for animals. It influences current pet owners to help out those in need and helps acquire new customers who also have a love for pets (19). The mission of PetSmart Charities is “to improve the quality of life for all pets by creating and supporting programs that save the lives of homeless pets and promote healthy relationships between people and pets.” PetSmart carries out this mission statement through various ways: • Funds programs that save lives of homeless pets • Collaborates with animal-welfare agencies across the U.S. and Canada • Provides emergency relief for animals in critical need • Raises awareness by promoting healthy and happy relationships between people and pets • Implements customer and associate fundraising programs (19). 9
- 10. More than ever before, cause-related marketing is an essential strategy in today’s industry. Marketers have been using cause-related marketing as a way for customers to sanction spending extra money. In return, when a company is associated with a cause, it gives customers one more reason to shop at that particular store (14). Competitor Profiles Primary Competitors Petco is considered to be one of PetSmart’s primary competitors in the pet industry. The two pet supply companies accounted for more than half of total industry revenue in 2011 (20). PETCO is a privately owned company that has more than 1,000 stores nationwide and is the only pet store to provide service in all 50 states, including the District of Columbia (17). PetSmart and PETCO both offer quality pet and veterinary supplies that are sold directly to animal professionals and to the public at discount prices. In 2010, both pet store chains accumulated combined sales of approximately $8.7 billion. Brief History Petco was originally founded in 1965 by Walter Evans and five associates as a mail-order veterinary supplies business. Initially, the business was called United Pharmaceutical Company (UPCO), and opened its first store in La Mesa, California in 1976. At the time, the primary customers consisted of ranches, kennels, catteries, and grooming shops (17). In 1979, UPCO changed its name to Petco in order to promote a better connection between its product supplies and household pets. The first official Petco store opened in Tigard, Oregon in 1980 (17). Petco’s business increased in 1988 after it bought two pet supply chains WellPoint and the Pet Department. This tripled Petco’s stores from 40 to 130, expanding the stores to states outside of California. Petco’s growth continued, and by 1994, it went public as the largest pet specialty retail chain in the industry with 218 stores in 13 states and sales of more than $189 million (17). The success of Petco brought the company the opportunity to develop pet services directly to its customers, and opened its grooming business in 1985. In 1999 Petco established the Petco Foundation to manage and promote charities related to animal causes. Since its establishment, the independent nonprofit organization has raised over $7 million for more than 7,000 animal welfare partners throughout the nation (17). Due to the market depression and undervalued shares in 2000, Petco changed to private ownership. In 2002, Petco launched pet supply services through its website. Petco has more than 1,000 stores in all 50 states with more than 22,00 associations across the country (17). 10
- 11. Sales Data Petco Media Mix 2006-2010 In 2006 Petco went back to becoming a privately Network TV owned company. Because of this, the company’s financials Cable TV are no longer available to the public. This limits the ability to 5% 10% Syndication analyze a year-by-year dissection of the company’s financial performance (20). Spot TV Despite this, a projection has been made by IBISWorld 30% Magazines 22% of Petco’s positive growth within the five years to 2011. It has Sunday Magazines been estimated that Petco’s revenue will total $2.9 billion in National Newspapers 2011, indicating a 5.9 percent annual growth over the five- Newspapers year period (20). National Spot Radio 11% 4% Network Radio 10% 4% PETCO Pet Supplies Inc. – Financial Performance 3% Outdoor 1% Source: Ad$pender 2010 Figure 7 3,500 Revenue (Millions $) 3,000 Advertising Expenditures 2,500 Petco has been efficient in its efforts to use all of the 2,000 various types of traditional media outlets for its marketing and 1,500 promotional advertising. It can be seen from the total spending 1,000 chart that most of the spending was in the year 2006, with Petco 500 spending a total amount of $24,200,000 on advertising. 0 Advertising spending has gone down since 2006, with only 2006 2007 2008 2009 2010 2011 $9,492,600 spent on advertising. However, the economic Years Source: Annual Report and depression of 2008 can be assumed to have been a major factor IBIS World Figure 6 in the spending cuts. ***I don’t have a source for this sentence, Media Mix it’s just an assumption since we are in a sort-of economic Between the years of 2006-2010, Petco’s marketing and depression. Feel free to take it out if you need to*** Spending promotional efforts have been invested in all forms of traditional went up for Petco in 2010 with a total amount of $13,534,300 in media outlets except Sunday Magazines outlet (3). Most of the advertisement costs. Throughout the years of 2006 to 2010, most spending was invested in radio and television. The most spending of Petco’s spending has gone towards network, cable, was Network Radio (29.69 percent) and Cable Television (21.85 syndication and spot television advertisements (67%), as well as percent). network and national spot radio (15%). These mediums are used Television is one of Petco’s primary mediums because the for Petco’s advertising strategy because the target audience is target audience is considered heavy viewers of prime time considered heavy viewers of prime time television and radio television (26). listeners (26). Newspaper is the next medium used by Petco in their advertising spending with 11 percent. 11
- 12. Petco Media Mix 2006-2010 Positioning Total Spending Petco emphasizes the importance of nutrition and healthy living for pets. This positioning gives Petco the opportunity to focus 30000 on pet specialty exclusive brands and strengthen their brand as a 25000 health and natural market player (14). The company considers itself to be the pet nutrition headquarters due to its wide selection of high- Amount Spent 20000 quality premium and natural pet food (17). 15000 The positioning of Petco is also strengthened by its Total $ 10000 nationwide pet nutrition education campaign, which aims to educate consumers about pet nutrition from the help of internal and external 5000 nutrition experts (17). 0 2006 2007 2008 2009 2010 Audience Segments Petco’s targets audiences and groups such as breeders and Years veterinarians through various media channels and promotional Source: Ad$pender Figure 8 activities that focus on its national campaign. The recommended primary consumer for PETCO is white, married adults between the Creative Strategy ages of 25-34 with at least a four year college degree and an income In 2011, Pertco announced Draftfcb Orange County as its of $40,000 or above (26). Agency of Record for brand and product advertising. The agency is Petco’s used these qualifications to target consumers who plan responsible for the brand’s creative strategy and development of in- on having a family in the future and who also want to include a store, digital and design work for specific campaigns (10). household pet as a part of that future family (26). The agency’s first campaign for PETCO consisted of a Many of The Petco Foundation’s sponsored events are consumer awareness campaign with digital, newspaper insert, in-store targeted towards these audience types. The Petco Foundation donates and TV components. The consumer awareness campaign promoted about $15 million a year to help animal-welfare organizations. This is Petco nutrition found in its stores (18). This particular campaign part of Petco’s cause-related marketing efforts. The Foundation also capitalizes on Petco’s 100% satisfaction guaranteed policy (20). provides nationally known experts to increase adoptions at a fraction Part of the creative strategy is sending out e-mails sent to of the price. Local shelters hold adoption events at Petco stores and members of its customer loyalty program Petco Pals. The e-mails invite customers to think of adopting (17). encourage consumers to visit the company’s website and learn of its Another local fund supported by The Petco Foundation is the events, sales and other information being promoted (18). “We Are Family Too” fund. The Foundation provides funds to As part of Petco’s consumer awareness campaign, the agency used humane groups who develop programs that help families keep their spending on digital outlets that exceeded the year before, including pets during the current economic hardship (17). Petco’s first TV campaign since 2007 (18). The emphasis on digital is The “We Are Family Too” fund is consistent with Petco’s part of the creative strategy in communicating the message of the strategy to target a family audience and emphasize the importance of campaign out to the public quickly. creating a relationship between owners and their pets. 12
- 13. New Developments Secondary Competitors In 2009, Petco opened its first Unleashed by Walmart is considered to be PetSmart’s secondary competitor. Petco store in San Diego, California. Unleashed by Walmart, PetSmart and PETCO are among the most popular retailers who Petco was created as a smaller-scale, community target pet supply consumers. Walmart is the world’s largest retailer chain with oriented store, focused primarily on helping customers’ $405 billion in sales for the end of the fiscal year of January 31, 2010. In 2009 pets become healthier (14). The boutique styled pet alone, the company estimated revenue of $1.4 billion in sales of pet supplies store provides customers with natural, organic and (26). This revenue estimate conveys how aggressive Walmart has become in higher-end products and first-rate pet service. Currently the pet market. there are 38 Unleashed by Petco stores in the country Since its first aspirations to enter the pet supply market in 2005, (17). Walmart has increased the category as high priority. In 2009 Walmart used the Store features in Unleashed by Petco differ from television media outlet to broadcast a series of brand-focused television spots Petco stores in order to exude a “neighborhood store” focused on the pet supplies provided in its stores. The company has also atmosphere and promote community bonding among debuted a fair amount of pet oriented products and services. These include a customers. One of the features includes a Treat Bar line of dog treats from dog bakery franchise where customers’ pets are allowed to meet and socialize Three Dog Bakery, environmentally friendly together. Customers are encouraged to bring photos of pet products and flea and tick medication their pets that are displayed on a portion of the store’s formally available in veterinary offices (20). wall as well. Each store also includes weight scales pet Walmart’s strategy is to provide mass owners can use to actively monitor their pet’s health quantities at the best value price. Target (23). Services provided at Unleashed by Petco consist consumers are assumed to have a lower of private and group dog training, DNA breed testing household income, however this does not and vaccination clinics. All associates of Unleashed by exclude consumers of a higher income level Petco are nutrition certified (23). (20). Unleashed by Petco also plans to host pet adoption events regularly as part of The Petco Foundation’s cause-related marketing efforts (23). 13
- 14. Consumer Analysis Important Factors in Product Selection: Percentage of Shoppers The Pet Parent Despite the state of the economy in the U.S., “pet parents” have Rating Factors as Important or Very Important been relatively unaffected (11). The pet superstore industry has shown an increase of 5 percent in sales in the past year (Packaged Facts). There are currently about 75 million dogs and about 85 million cats owned in the It's a Brand Name 23 United States (6). The majority of these owners see their pets as a part of the family. When polled, ninety-one percent of pet owners agreed with the Recommended by Friends/ 26 statement “I consider my pet(s) to be part of the family” (14). This view is Relatives one quality that distinguishes a pet owner from a “pet parent.” Pet parents Dietary Restrictions 34 are individuals who place high importance on the care of their pets, their relationships with them, and the emotional ties that justifies those pets as a significant part of the individual’s family. These owners have a desire to It's Low Calorie 45 present their pets with the highest standard of life, and have the financial means to offer the best quality and safety in every product and service they It has Reduced Sugar/Fat/Salt 53 purchase. Highly invested pet parents focus on premium products and Factors services for their pets, strengthening their emotional relationship with the Avaliable Size Options 62 pet, as well as providing for their health and wellness (14). Consumers of the pet superstore industry take a variety of factors into account when they It has Future Health Benefits 63 shop for their pet, based on their own personal values and abilities to do so. spent just a decade ago. It is on Sale 80 In the graph on the right, the majority of pet parents place higher emphasis on the quality, price, and safety of a pet product or service, It is a Good Source of Nutrition 81 strengthening the amount of care parents physically and emotionally put towards their pet. While fluctuations can appear depending on the parent’s Product Safety 83 income, these statistics show that the stronger the relationship, the more time and money are invested from pet parent to pet. In addition, pet parents are growing in numbers and in popularity. In 2007, APPMA reported the It is a Product I trust 83 percentage of dogs that slept in the same bed as their owners jumped from thirty-four percent to forty-two percent (5). Similarly, Bloomberg Price of Item 87 Businessweek reports growth in the astronomical pet parent spending. The amount of money Americans now spend on their pets has reached $41 0 50 100 billion per year. This number is significant in that Americans spend more on Percentage their pets than the gross domestic product of all but 64 countries in the Source: Packaged Facts Figure 9 entire world (8). The amount Americans spend on their pets a year has doubled from what they spent just a year ago. 14
- 15. Demographics In the pet superstore The CEO of PetSmart, Phillip Francis, says that the typical industry, many consumers are target audience, in which he is aiming products and services, is from higher-income households. women in their mid-20’s and 50’s (22). According to Blackwell’s This plays a prominent role in Five-Minute Veterinary Practice Management, the average [pet] the pet superstore market since owner is white, married, 46, and childless or an empty nester, as well these consumers are less likely to as a homeowner with a higher household income than the rest of the feel the severe effects of the nation (1). The website Quancast specifically targets PetSmart’s economic downturn. Data shows demographic market. The website states that sixty-two percent of that Americans who make PetSmart’s customers are female. Their shoppers are thirty-four $70,000 or more increased their percent likely to be in the age bracket 35 to 49, followed closely by spending in the market by twenty those who are 18 to 34 making up thirty-three percent of the market. percent from 1998 to 2008. Eighty-four percent of their customers are Caucasian and sixty Their largest expenditure was percent have no children. Simmons Research shows similar statistics; veterinary supplies, which shows they also value the well being of however, it gathers data for the entire pet superstore market and not their pets. No matter whom you just one certain store in that market. The data shows that most pet are trying to market or advertise, owners are female. Women make up fifty-two percent of the market you are most likely going to be reaching a pet owner. More than 71 and twenty percent of the customers are ages 45 to 54. Twenty-six million homes, or sixty-three percent of all U.S. households, have one percent of pet owners have a yearly income greater than $100,000. or more pets (12). Packaged Facts believes that about 17 million U.S. households qualify as premium pet demographics. These households $70K+ Household Share of U.S. Pet Market represent thirty percent of all pet-owning households and fifteen Expenditures: By Category, 1998 vs. 2008 percent of U.S. households overall. This information allows the pet superstore industry to be divided into five groups. These groups 80.00% 1998 include: Affluents, those with a household income of $150,000 or 70.00% 64% 67% more; Specialty Shoppers, those purchasing pet supplies through pet 2008 stores or the Internet only; Married With Children, those with a Percentage 60.00% 49% 49% household income of $100,000 or more; Empty Nesters, those with a 46% 50.00% 40.00% 36% household income of $75,000 or more; Dual-Income/No Kids, those 30.00% 28% 27% with a household income of $75,000 or more; and Singles, those with 20.00% a household income of $50,000 or more (14). These groups are all 10.00% growing in spending ability and numbers, which suggests the strong 0.00% potential for premium pet products and services. The growing size of Veterinary Non-Medical Pet Supplies Pet Food these groups indicates the success of the pet superstore industry’s Services Pet Services marketing ability. The graph below indicates what U.S. households spend the bulk of their income on in terms of the pet superstore Source: Packaged Facts Category Figure 10 industry. 15
- 16. Psychographics Psychographic Attitudes Percent Of Philip Francis, CEO of Motley Fool Stock Advisor and People recommendation for PetSmart, states that the target audience Rarely go shopping 58.0% for PetSmart is primarily based off of psychographic analysis rather than demographics (22). Pet parents treat their pets as a Even when they do not make a purchase, they 58.0% significant part of their family, and therefore have strong enjoy shopping psychological and emotional ties with them. On PetSmart’s Store’s environment makes a difference 60.0% personal site, they reach out to pet parents by placing a high Only shop at stores nearby 58.0% emphasis on pet adoption and welfare, through new services and outlets such as PetSmart Charities, PetsHotels, and Tend to buy things spur the moment 62.0% Doggie Day Camp (19). The growth and positive response Will buy from non-specialty stores because of 60.0% that the company has been receiving from pet parents proves price that they have been successfully catering to the emotional Only shop at their favorite store because they 57.0% needs of parents through promotions of safe, secure, and know the type of service they will receive healthy relationships. Shop at specialty because of employee’s 57.0% In the 2009 Simmons report on pet owners versus non- knowledge pet owners, we learn how the psychographics of pet owners differ from those who do not own pets. Pet superstore retailers Prefer to shop at specialty stores because they 54.0% carry more brands must understand how their consumers think when shopping in order to target their audience correctly. The results indicated Only shop for something they need 62.0% that fifty-eight percent of pet owners rarely go shopping. Since that is more than half of pet owners, the pet superstore When shopping, get what they need and leave 58.0% industry must make shopping extremely easy for its customers Source: SMRB, Pets Vs. No Pets Figure 11 and offer incentives to get them to shop at their store. Many said that coupons help draw them to stores at which they buying things until they are on sale, while sixty percent will buy from normally do not shop and fifty-nine percent said they are non-specialty stores because of the product’s price. Fifty-seven willing to shop at new stores. Data suggests that if you offer percent of pet owners choose to only buy products from their favorite pet owners as incentive, they will be more likely to shop at stores because they know what kind of service to expect. However, only your store. The environment of a store is crucial. Sixty percent fifty-four percent of consumers prefer to buy pet products from a of pet owners agree that a store’s environment makes a specialty store than not because they believe these stores carry the best difference when they are shopping. brands. Fifty-seven percent of consumers say they would shop at a Since fifty-eight percent of pet owners rarely go specialty store because of an employee’s greater knowledge on products shopping, pet superstore retailers must understand when and and services for their pet. The Simmons data clearly shows that pet why pet owners shop. Fifty-eight percent say they go parents are not picky when it comes to where they shop, but they will shopping when something is really needed and once they get pick certain stores that offer them something in return, coupons, what they need them leave. Fifty-nine percent hold out on convenience, expertise, etc. 16
- 17. Perceptions Likes and Dislikes The preferences of consumers for their pets typically correlate with what the owner would choose for himself or herself. Consumers like to buy what makes them feel good, and therefore will be willing to spend more on products and services with higher quality and safety. This could include products such as food for the pet that is natural or recycled products that support the idea of “going green.” PetSmart became a big believer in environmental sustainability in 2008, beginning with an employee engagement program called Think Twice (19). In this program, the employees challenge themselves to make different, more sustainable decisions in hopes to inspire and involve consumers into making smarter decisions for the benefit of themselves, their pets, and the environment. For example, 37.2 percent of cat owners from 2009 were willing to pay more for environmentally friendly products, compared to 34.7 percent of overall adults willing to pay more. It was also found that 71.4 percent of cat owners felt that packaging for products should be recycled, versus the 67.4 percent of adults overall who agreed (14). Pet parents dislike products and services that can be physically harmful or painful to their pets, such as shock collars. Although they are intended to train a pet, people tend to dislike the idea of subjecting their pet to physical abuse in order to teach a lesson, preferring instead to implement verbal strategies or pay for professional dog training. Charity organizations and animal welfare events also take a consumer’s attention away from the negative aspects of a pet product and focus on good cause. PetSmart’s Charities organization has a vision to provide a lifelong, loving home for every pet by creating and supporting programs to save homeless pets and improve their quality of life. This emotionally appeals to pet parents because it promote healthier relationships with their pets. People for the Ethical Treatment of Animals (PETA) or The Humane Society of the United States are two national organizations that strive to involve all individuals on the positive treatment and care of animals. Many pet parents also focus on the nutrition and health benefits for their pets. Dr. Lisa Newman, Mike Adams, and the non-profit Consumer Wellness Center compiled the worst ingredients found in pet food. Salt rated the highest, with the ingredient being found in 69 percent of pet food products analyzed (2). A less familiar ingredient, brewers dried yeast, came in second with 34 percent. Used for flavoring, protein, and B-vitamins, it is a waste product that can become toxic to the liver, as well as cause allergies and arthritis to pets. 17
- 18. 18
- 19. Problems in the Category Consumers in the pet supermarket industry are increasingly sensitive over product safety. Safety is currently a huge priority in the industry because of its potential to drastically change pet food and non-food supplies. In accordance with news for pet food, new government regulations are being implemented under the Food and Drug Administration Amendments Act (14). This act would include pet food ingredient and labeling standards, as well as, a Reportable Food Registry (14). There are of course many concerns with the changes, including, higher production costs and business-interrupting plant shutdowns from the presence of salmonella at pet food plants. Aside from the food part of the pet supermarket industry, there is also the non-food side. According to Packaged Facts, the largest pet supplies category, flea and tick control products, have been gaining new attention due to illnesses from chemicals in the products, sometimes even resulting in death (14). Although EPA reports imply that pet owners could have applied the product incorrectly, consumer complaints of pet poisoning could decrease sales, causing companies to revise labels, discontinue products, and implement new data requirements. Insights Through extensive psychographic and statistical analysis, it is clear that many pet parents would go to great lengths physically and financially to make their pets happy. We can see many examples of this in categories such as pop culture, with high grossing, pet- related films such as Marley Me and 101 Dalmatians (2). These movies tend to appeal most to younger demographics and pet parents that have children. 19
- 20. Survey Research • To identify if there are gender and income differences for the above Introduction measures In addition to the information provided on PetSmart in the Situation Analysis, we formed a survey in order to obtain further information on PetSmart’s targeted audience, pet Data Collection Method parents. Using the guidelines of specific research objective We conducted the survey based on three key factors. First, we points, we created a survey to guide PetSmart’s marketing surveyed a sample of pet parents. This sample included young adults strategies and tactics by using the responses of its targeted from the age range of 18-25 and those between the ages of 45-60. In audience. In the following paragraphs, we will explain in order to make the survey related to our research purposes, we created detail our research objectives, the method and design used for a screening question that does not allow those without pets to the survey, along with the actual survey itself accompanied by participate in the survey. Each team member surveyed at least 20 a coding scheme. respondents to obtain accurate results. This created a sample size of 120 respondents. In order to obtain these responses, we used self- Research Objectives administered surveys that were issued through various online Today, pet owners have an emotional tie to their pets – platforms. Table 1, below, shows each members intended method of a group referred to as pet parents. The survey will be utilized distribution. to gain insight into this group to see what they are looking for in a brand and if cause-related marketing affects their purchases. In order to obtain these answers, we constructed Group Member: Distribution Method: our survey from a list of research objectives: Lauren Baker Sent email to roster of her sorority chapter, Kappa Delta • To measure the target market’s pet-shopping frequency • To measure the target market’s monthly spending on pet- Jenna Barb Sent email to her father who related products and services forwarded it to his AutoZone • To measure the target market’s awareness of brands within employees the pet products and services industry Jeni Cherry Sent email to roster of her • To assess the target market’s attitudes/beliefs about sorority chapter, Delta Zeta differentiating characteristics of brands within the pet products and services industry Alison Embry Posted the survey link on her • To assess the target market’s attitudes/beliefs about PetSmart Twitter account • To assess the target market’s attitudes/beliefs about PETCO Taylor Kearns Sent link out to friends and • To assess the target market’s awareness/attitudes/beliefs employees about current PetSmart promotional and cause-related marketing campaigns Kristin Wise Posted the survey link on her • To identify strategies to inform and promote cause-related Facebook account marketing efforts for PetSmart 20
- 21. Survey Research Research Objective Survey Question Survey Design Number(s) We conducted a web-based survey created using Screening Questions 1 kwiksurvey.com. The survey was comprised of 38 questions. The survey’s design allowed us to weed To help determine the target market 2, 3, 4, 5, 6, 8, 30, 32, 33, 35, 36, 37 through respondents to figure out which ones were actual pet parents. By using a screening question, we ensured To measure the target market’s pet 7, 9, 12 that all of our data is pertinent to our “pet parent” shopping frequency demographic. Each group member was also required to send the survey to at least 20 people, ensuring that we got To measure the target market’s 9, 16, 17, 18, 19, 20, 29 ample amount of feedback to fulfill our objectives. monthly spending on pet related products and services In order to achieve our research objectives, we prepared the table to the right displaying each objective To measure the target market’s 19, 20, 21, 23, 24, 25 paired with the survey question number that it satisfies. awareness of brands within the pet products and service industry To assess the target market’s attitudes 11, 14, 15, 16, 17, 19, 23, 24, 25 and beliefs about differentiating characteristics of brands within the pet products and services industry To assess the target market’s attitudes 10, 13, 22, 26 and beliefs about PetSmart To assess the target market’s attitudes 10, 13, 22 and beliefs about Petco To assess the target market’s 23, 26, 26 awareness, attitudes, beliefs about Efforts to Reduce Survey Design Bias current PetSmart promotional and In order to avoid survey bias, we paid close attention cause-related marketing campaigns to question phrasing and response options. We made sure to To identify strategies to inform and 26, 27, 28, 31, 32, 33, 34, 36, 37 use clear and simple language in order to keep the questions promote cause-related marketing short. To help keep the survey visually appealing, we listed efforts for PetSmart question alternatives vertically and divided the survey into sections. To steer away from leading questions, we used To identify if there are gender and 3, 4, 5, 6, 7, 38 neutral words that are not biased or emotionally charged. income differences for the above measure 21
- 22. Survey Results Table 2 Summary of Participants What is your household’s totally yearly income? Our survey had a total of 122 participants complete the (n = 122) survey; however, through our first screening question, 11 showed they did not own pets (9 percent). 38 pet owners from the survey are female and 73 are male, with valid percentages of 34.2 percent and 65.8 percent. Table 1 shows that the largest percentage of Income Frequency Percentage respondents are between the ages of 51-60 (32 percent). Twenty-nine percent are between 19-23, followed by 22 percent of respondents that were between the ages of 41-50. These three age group represent Under $19,999 12 11% the majority of respondents. $20,000-$49,999 12 11% Table 1 What is your age? $50,000-$74,999 12 11% (n = 122) Age Frequency Percentage $75,000-$99,999 20 18% $100,000- 26 24% 18 and under 1 1% $149,999 19-23 32 29% Over $150,000 27 25% 24-30 4 4% 31-40 6 5% According to the survey, 73 respondents indicated that their 41-50 25 22% yearly household income ranged from $75,000 to over $150,000. The majority of these respondents accounted for an income level 51-60 35 32% over $150,000 at 25 percent. In addition, the majority of the respondents were White with 92.79 percent, while other ethnicities 61-70 6 5% were all below 3 percent. Over 70 2 2%
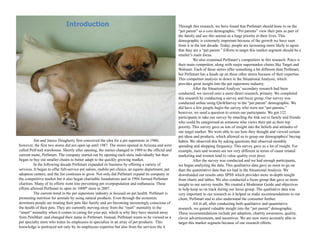
- 23. Pet Shopping Frequency and Monthly Spending As displayed in Table 3, when respondents were asked about how often they go shopping for their pet per month, males and females did not Products vs. Services show a significant difference in shopping habits (Chi-square = -.002; Sig. Overall, what type of product do you 2-tailed = .993). The means between each gender proved this as well; both males and females showed a mean response of 2.53 (on a scale with 4 being purchase most often? Luxury Goods Other the most frequent), going shopping for their pet either once a month or 2-3 2% Toys 1% times a month. 1% Health Products Table 3 3% Influence of Pet Shopping Frequency Per Month on Gender (n = 122) Percentage Measure Male Female Chi-square Sig. (2- Value tailed) Food/treats 93% Pet Shopping 65.8% 34.2% -.002 .993 Frequency Figure 12 per month As shown in Figure 12, the overwhelming majority of respondents spent the most on food/treats for their pet(s). The variance between gender proved When shopping frequency was compared with income, we found to be of little significance, with females answering similar results. The Chi-square test yielded -.002 with a sig. 2-tailed value with a mean of 1.14 (1 = food/treats) and males with a of .983, proving that how much income a household brings in per year has mean of 1.24. This shows that a necessity such as food little effect on how often they go shopping for their pet(s). The same is true is the most important factor when pet owners shop for for the amount of money spent as well—while males showed to have spent a pet products. slightly higher amount of their pet per month (mean = 3.22 as compared to female’s 2.86 mean), the sig. 2-tailed value was .117, showing a weak correlation between the two variables.
- 24. As shown in Figure 13 below, respondents spend the majority between products and services offered at pet-specialty storre of their pet expenditures on veterinary services, with the closest versus supermarkets. percentage at 23% with grooming and pampering. This shows that The participants in the survey were asked to rate the pet parents place the most importance on the health of their pet(s), differences between products and services provided at but occasionally like to spoil their pet(s) as well. PetSmart vs. Petco. A little over half of those who responded chose to remain neutral in deciding the differences in PetSmart and Petco products and services (53 percent). A greater Which pet services do you spend the most percentage disagreed—rather than agreed—that there is any on? difference between the stores’ products and services. Specifically, 24 percent of respondents chose to “disagree” and 16 percent chose to “agree.” Grooming/ Pampering 23% Table 4 Pet Boarding/ Influence of Products/Services at Pet-Specialty Daycare stores vs. Supermarkets/Discounts Stores on 6% Gender Pet SiAers/ (n = 122) Veterinary Walkers Services 2% 67% Training/ Means Discipline 2% Measure Men Women Figure 13 Influence of 2.13 2.29 Products/Services Attitudes and Beliefs about PetSmart vs. Petco on Different Participants were also asked to rate the significant difference Stores between products and services offered at pet-specialty stores versus supermarkets and discount stores. Of those who answered the survey, the results indicated that 39 percent agree that there is a difference in products and services, 25 percent strongly agree, 29 percent remain neutral and 7 percent disagree that there is a difference. Cumulatively, 64 percent agree or strongly agree that there is a significant difference
- 25. Which type of store do you most prefer when Price vs. Quality shopping for your pet? Table 5 Correlation between pet shopping based on price vs. income Discount (n = 122) stores 10% Measure Chi-Squared Sig. 2-tailed Other 19% Supermarkets 35% I shop for my pet .180 .062 based on price. Petco 11% PetSmart (Based on a scale of 1-5: 1 being “Always” and 5 being 25% “Never”) Figure 14 When respondents were asked whether they shop for their pet(s) based on the price, 39 percent said “sometimes,” followed When respondents answered which type of by nearly 31 percent answering “usually.” This shows that a supermarket they preferred when shopping for their pet, 30 majority of people consider price when shopping. However, as percent of respondents said they do not shop at shown in Table 5, the comparison between income and shopping supermarkets for their pet(s) at all, while a slightly lower based on price proved not to be statistically significant enough to percentage, 26 percent, said that they opt for Walmart, the conclude a correlation (sig. 2-tailed = .062), but just barely. most inexpensive of the listed supermarkets in the survey. When can therefore conclude that although the correlation is When asked which type of store they preferred when weak, price is generally considered. shopping for their pet(s), supermarkets had the highest The correlation between gender was far less significant, percentage of 35.19, with PetSmart and Petco falling however; males had a mean of 2.78 with females at 2.74, and behind with 25 percent and 11 percent—all shown in showed a sig. 2-tailed value of .845 between the 2 variables, Figure 14. This shows that the products and services proving no statistical significance. offered at PetSmart and Petco are not enough to override the prices offered at supermarkets.