More Related Content
Similar to Ppp slideshow 8-12-12
Similar to Ppp slideshow 8-12-12 (20)
Ppp slideshow 8-12-12
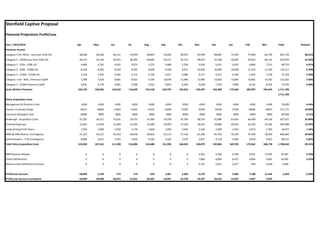
- 1. Stenfield Captive Proposal
Financial Projections Profit/Loss
Year 1 2013/2014 Apr May Jun Jul Aug Sep Oct Nov Dec Jan Feb Mar Total Analysis
Premium Income
Category 1 (ID -NIHL) - Less than £25k LOI 38,938 40,106 42,111 45,059 48,663 53,043 58,347 63,599 68,687 73,495 77,904 81,799 691,750 40.41%
Category 2 - (COM) Less than £25k LOI 34,125 35,149 36,555 38,382 40,685 43,127 45,714 48,914 52,338 56,002 59,922 64,116 555,029 32.43%
Category 3 - £25k - £50k LOI 4,688 4,781 4,925 5,072 5,275 5,486 5,706 5,934 6,231 6,542 6,869 7,213 68,723 4.01%
Category 4 - £50k - £100k LOI 8,100 8,262 8,510 8,765 9,028 9,299 9,671 10,058 10,460 10,878 11,314 11,766 116,111 6.78%
Category 5 - £100k - £250k LOI 5,250 5,355 5,462 5,571 5,738 5,911 6,088 6,271 6,521 6,782 7,054 7,336 73,339 4.28%
Category 1 (ID - NIHL ) Premium Uplift 7,398 7,620 8,001 8,561 9,246 10,078 11,086 12,084 13,050 13,964 14,802 15,542 131,432 7.68%
Category 2 - (COM) Premium Uplift 4,631 4,770 4,961 5,209 5,522 5,853 6,204 6,638 7,103 7,600 8,132 8,702 75,325 4.40%
Gross Written Premium 103,129 106,043 110,524 116,620 124,158 132,797 142,816 153,497 164,390 175,264 185,997 196,474 1,711,709
1,711,709
Policy Acquisition Costs
Management & Directors Fees 6500 6500 6500 6500 6500 6500 6500 6500 6500 6500 6500 6500 78,000 4.56%
Insurers Fronting Charge 10313 10604 11052 11662 12416 13280 14282 15350 16439 17526 18600 19647 171,171 10.00%
Insurance Managers Fees 16000 4000 4000 4000 4000 4000 4000 4000 4000 4000 4000 4000 60,000 3.51%
Brokerage - Acquisition Costs 25,782 26,511 27,631 29,155 31,040 33,199 35,704 38,374 41,098 43,816 46,499 49,118 427,927 25.00%
Underwriting Fees 12,625 12,959 13,483 14,185 15,049 16,050 17,236 18,455 19,698 20,919 22,102 23,228 205,988 12.03%
Underwriting Profit Share 1,556 1,600 1,659 1,734 1,828 1,928 2,035 2,164 2,304 2,453 2,613 2,783 24,657 1.44%
IBNR @ 40% Reserve Contingency 41,252 42,417 44,210 46,648 49,663 53,119 57,126 61,399 65,756 70,105 74,399 78,590 684,684 40.00%
Administration - IT & Contingency 8,000 2,651 2,763 2,916 3,104 3,320 3,570 3,837 4,110 4,382 4,650 4,912 48,215 2.82%
Total Policy Acquisition Costs 122,028 107,242 111,298 116,800 123,600 131,395 140,453 150,079 159,904 169,702 179,362 188,778 1,700,642 99.35%
IBNR Reserve Release 0 0 0 0 0 0 0 2,063 4,183 6,394 9,551 13,295 35,487 5.18%
Claims Settlements 0 0 0 0 0 0 0 7,860 8,094 8,471 9,006 9,665 43,095 2.52%
Reserve Claim Settlement Account 0 0 0 0 0 0 0 -5,797 -3,911 -2,077 546 3,630 -7,609
Profit/Loss Account -18,899 -1,199 -774 -179 559 1,401 2,363 -2,379 575 3,485 7,180 11,326 3,459 0.20%
Profit/Loss Account Cumulative -18,899 -20,098 -20,872 -21,051 -20,492 -19,091 -16,728 -19,107 -18,532 -15,047 -7,867 3,459
- 2. Stenfield Captive Proposal
Financial Projections Profit/Loss
Year 2 - 2014/2015 Apr May Jun Jul Aug Sep Oct Nov Dec Jan Feb Mar Total Analysis
Premium Income
Category 1 (ID -NIHL) - Less than £25k LOI 85,889 90,184 94,693 100,375 106,397 113,845 121,814 129,123 136,870 143,714 150,900 158,445 1,432,249 43.86%
Category 2 - (COM) Less than £25k LOI 66,681 69,348 72,122 75,728 79,515 83,490 88,500 93,810 98,500 103,425 108,597 114,027 1,053,744 32.27%
Category 3 - £25k - £50k LOI 7,357 7,504 7,654 7,807 8,042 8,283 8,531 8,787 9,139 9,504 9,885 10,280 102,774 3.15%
Category 4 - £50k - £100k LOI 12,001 12,241 12,486 12,736 12,991 13,251 13,648 14,058 14,479 14,914 15,361 15,822 163,988 5.02%
Category 5 - £100k - £250k LOI 7,409 7,483 7,558 7,634 7,786 7,942 8,101 8,263 8,511 8,766 9,029 9,300 97,781 2.99%
Category 1 (ID - NIHL ) Premium Uplift 16,319 17,135 17,992 19,071 20,215 21,631 23,145 24,533 26,005 27,306 28,671 30,104 272,127 8.33%
Category 2 - (COM) Premium Uplift 9,050 9,412 9,788 10,277 10,791 11,331 12,011 12,731 13,368 14,036 14,738 15,475 143,008 4.38%
Gross Written Premium 204,707 213,308 222,294 233,629 245,737 259,772 275,750 291,305 306,873 321,665 337,180 353,452 3,265,671
3,265,671
Policy Acquisition Costs
Management & Directors Fees 7,150 7,150 7,150 7,150 7,150 7,150 7,150 7,150 7,150 7,150 7,150 7,150 85,800 2.63%
Insurers Fronting Charge 20471 21331 22229 23363 24574 25977 27575 29131 30687 32167 33718 35345 326,567 10.00%
Insurance Managers Fees 5,000 5,000 5,000 5,000 5,000 5,000 5,000 5,000 5,000 5,000 5,000 5,000 60,000 1.84%
Brokerage - Acquisition Costs 51,177 53,327 55,573 58,407 61,434 64,943 68,937 72,826 76,718 80,416 84,295 88,363 816,418 25.00%
Underwriting Fees 24,140 25,092 26,086 27,317 28,653 30,233 31,989 33,662 35,420 37,055 38,767 40,560 378,972 11.60%
Underwriting Profit Share 2,883 2,987 3,095 3,233 3,380 3,535 3,729 3,934 4,121 4,317 4,522 4,737 44,472 1.36%
IBNR @ 40% Reserve Contingency 81,883 85,323 88,917 93,451 98,295 103,909 110,300 116,522 122,749 128,666 134,872 141,381 1,306,269 40.00%
Administration - IT & Contingency 4,002 4,168 4,342 4,560 4,794 5,065 5,374 5,674 5,975 6,261 6,561 6,876 63,653 1.95%
Total Policy Acquisition Costs 196,705 204,378 212,393 222,481 233,280 245,812 260,054 273,899 287,821 301,032 314,885 329,412 3,082,151 94.38%
IBNR Reserve Release 17,672 22,328 27,300 33,025 38,300 43,532 48,707 53,347 58,241 62,540 67,043 70,893 542,929 27.27%
Claims Settlements 10,440 11,353 12,301 13,244 14,165 15,050 15,883 16,625 17,402 18,216 19,248 20,341 184,266 5.64%
Reserve Claim Settlement Account 7,232 10,975 14,999 19,782 24,135 28,482 32,824 36,722 40,839 44,324 47,795 50,553 358,662
Profit/Loss Account 15,234 19,905 24,899 30,929 36,592 42,443 48,520 54,129 59,891 64,958 70,090 74,593 542,183 16.60%
Profit/Loss Account Cumulative 15,234 35,139 60,038 90,967 127,559 170,002 218,522 272,651 332,542 397,500 467,590 542,183
- 3. Stenfield Captive Proposal
Financial Projections Profit/Loss
Year 3 - 2015/2016 Apr May Jun Jul Aug Sep Oct Nov Dec Jan Feb Mar Total Analysis
Premium Income
Category 1 (ID -NIHL) - Less than £25k LOI 161,613 166,462 171,456 176,599 181,897 187,354 191,101 194,923 198,822 202,798 206,854 210,991 2,250,872 46.63%
Category 2 - (COM) Less than £25k LOI 116,307 117,470 118,645 119,831 121,030 122,240 123,462 124,697 127,191 129,735 132,329 134,976 1,487,913 30.82%
Category 3 - £25k - £50k LOI 10,486 10,590 10,696 10,803 10,911 11,020 11,131 11,353 11,580 11,812 12,166 12,531 135,080 2.80%
Category 4 - £50k - £100k LOI 15,980 16,140 16,301 16,464 16,629 16,795 16,963 17,133 17,476 17,825 18,182 18,545 204,433 4.24%
Category 5 - £100k - £250k LOI 9,393 9,487 9,582 9,677 9,774 9,872 9,971 10,070 10,171 10,273 10,376 10,479 119,125 2.47%
Category 1 (ID - NIHL ) Premium Uplift 30,707 31,628 32,577 33,554 34,560 35,597 36,309 37,035 37,776 38,532 39,302 40,088 427,666 8.86%
Category 2 - (COM) Premium Uplift 15,785 15,942 16,102 16,263 16,425 16,590 16,756 16,923 17,262 17,607 17,959 18,318 201,931 4.18%
Gross Written Premium 360,270 367,719 375,358 383,192 391,227 399,469 405,693 412,135 420,277 428,581 437,168 445,929 4,827,020
Policy Acquisition Costs
Management & Directors Fees 7865 7865 7865 7865 7865 7865 7865 7865 7865 7865 7865 7865 94,380 1.96%
Insurers Fronting Charge 36027 36772 37536 38319 39123 39947 40569 41214 42028 42858 43717 44593 482,702 10.00%
Insurance Managers Fees 6000 6000 6000 6000 6000 6000 6000 6000 6000 6000 6000 6000 72,000 1.49%
Brokerage - Acquisition Costs 90,068 91,930 93,840 95,798 97,807 99,867 101,423 103,034 105,069 107,145 109,292 111,482 1,206,755 25.00%
Underwriting Fees 41,310 42,242 43,199 44,181 45,190 46,226 46,989 47,795 48,727 49,677 50,678 51,699 557,911 11.56%
Underwriting Profit Share 4,827 4,875 4,924 4,973 5,023 5,073 5,124 5,178 5,279 5,383 5,491 5,602 61,754 1.28%
IBNR @ 40% Reserve Contingency 144,108 147,088 150,143 153,277 156,491 159,788 162,277 164,854 168,111 171,432 174,867 178,372 1,930,808 40.00%
Administration - IT & Contingency 7,008 7,153 7,303 7,456 7,613 7,774 7,895 8,022 8,180 8,341 8,508 8,679 93,931 1.95%
Total Policy Acquisition Costs 337,212 343,925 350,809 357,870 365,111 372,539 378,143 383,961 391,259 398,702 406,418 414,292 4,500,242 93.23%
IBNR Reserve Release 74,896 79,073 83,405 87,889 92,543 97,392 102,466 107,569 112,704 117,877 122,976 127,970 1,206,759 30.77%
Claims Settlements 21,642 23,087 24,463 25,858 27,146 28,499 29,918 30,515 31,263 32,033 32,823 33,636 340,885 7.06%
Reserve Claim Settlement Account 53,254 55,986 58,942 62,030 65,397 68,893 72,548 77,054 81,440 85,845 90,152 94,334 865,874
Profit/Loss Account 76,312 79,780 83,491 87,353 91,513 95,822 100,098 105,228 110,459 115,724 120,902 125,972 1,192,653 24.71%
Profit/Loss Account Cumulative 76,312 156,091 239,582 326,935 418,448 514,271 614,369 719,597 830,056 945,780 1,066,682 1,192,653