
Recommended
Recommended
More Related Content
What's hot
What's hot (20)
Similar to Principles of Economics TestBank Chapter曼昆《经济学原理》(微观)第五版测试题库 (20)
Similar to Principles of Economics TestBank Chapter曼昆《经济学原理》(微观)第五版测试题库 (20) (20)
Recently uploaded
Recently uploaded (20)
Principles of Economics TestBank Chapter曼昆《经济学原理》(微观)第五版测试题库 (20)
- 1. Chapter 20 Income Inequality and Poverty TRUE/FALSE 1. The poverty line is set by the government so that 10 percent of all families fall below that line and are thereby classified as “poor.” ANS: F DIF: 1 REF: 20-1 NAT: Analytic LOC: The study of economics, and definitions of economics TOP: Poverty line MSC: Definitional 2. The United States has more income inequality than Japan, Germany, and Canada. ANS: T DIF: 1 REF: 20-1 NAT: Analytic LOC: The study of economics, and definitions of economics TOP: Income inequality MSC: Definitional 3. The United States has more income inequality than Brazil and South Africa. ANS: F DIF: 1 REF: 20-1 NAT: Analytic LOC: The study of economics, and definitions of economics TOP: Income inequality MSC: Definitional 4. Standard measurements of the degree of income inequality take both money income and in-kind transfers into account. ANS: F DIF: 2 REF: 20-1 NAT: Analytic LOC: The study of economics, and definitions of economics TOP: In-kind transfers | Income inequality MSC: Definitional 5. John Rawls, who developed the way of thinking called liberalism, argued that government policies should be aimed at maximizing the sum of utility of everyone in society. ANS: F DIF: 2 REF: 20-2 NAT: Analytic LOC: The role of government TOP: Utility MSC: Interpretive 6. One existing government program that works much like a negative income tax is the Earned Income Tax Credit. ANS: T DIF: 2 REF: 20-3 NAT: Analytic LOC: The role of government TOP: Negative income tax MSC: Interpretive 7. One existing government program that works much like a negative income tax is Medicaid. ANS: F DIF: 2 REF: 20-3 NAT: Analytic LOC: The role of government TOP: Negative income tax MSC: Interpretive 8. The invisible hand of the marketplace acts to allocate resources efficiently, but it does not necessarily ensure that resources are allocated fairly. ANS: T DIF: 1 REF: 20-0 NAT: Analytic LOC: Efficiency and equity TOP: Income inequality MSC: Applicative 9. When the government enacts policies to make the distribution of income more equitable, it distorts incentives, alters behavior, and makes the allocation of resources less efficient. ANS: T DIF: 1 REF: 20-0 NAT: Analytic LOC: The role of government TOP: Income inequality MSC: Applicative 67
- 2. 68 Chapter 20/Income Inequality and Poverty 10. In the United States in 2005, the bottom fifth of the income distribution had incomes below $19,250. ANS: F DIF: 1 REF: 20-1 NAT: Analytic LOC: Efficiency and equity TOP: Income inequality MSC: Applicative 11. The top 5 percent of U.S. annual family income in 2005 was $184,500 or more. ANS: T DIF: 1 REF: 20-1 NAT: Analytic LOC: Efficiency and equity TOP: Income inequality MSC: Applicative 12. A U.S. family earning $80,000 would be in the top 20 percent of income distribution in 2005. ANS: F DIF: 1 REF: 20-1 NAT: Analytic LOC: Efficiency and equity TOP: Income inequality MSC: Applicative 13. Free trade and economic growth have reduced poverty worldwide. ANS: T DIF: 1 REF: 20-1 NAT: Analytic LOC: Efficiency and equity TOP: Poverty MSC: Applicative 14. Although globalization has reduced income inequality, the number of people living in extreme poverty has remained unchanged. ANS: F DIF: 2 REF: 20-1 NAT: Analytic LOC: Efficiency and equity TOP: Poverty MSC: Interpretive 15. The measured poverty rate may not reflect the true extent of economic deprivation because it does not include some forms of government assistance. ANS: T DIF: 1 REF: 20-1 NAT: Analytic LOC: Efficiency and equity TOP: Poverty rate MSC: Applicative 16. The poverty line is an absolute standard and is based on the cost of providing an adequate diet. ANS: T DIF: 1 REF: 20-1 NAT: Analytic LOC: Efficiency and equity TOP: Poverty line MSC: Definitional 17. The poverty line is based on the percentage of people who cannot afford an adequate diet. ANS: F DIF: 2 REF: 20-1 NAT: Analytic LOC: Efficiency and equity TOP: Poverty line MSC: Interpretive 18. The poverty rate is a measure of people unable to meet the government’s poverty line. ANS: T DIF: 2 REF: 20-1 NAT: Analytic LOC: Efficiency and equity TOP: Poverty line MSC: Interpretive 19. The elderly represent the largest demographic group in poverty. ANS: F DIF: 1 REF: 20-1 NAT: Analytic LOC: Efficiency and equity TOP: Poverty MSC: Applicative 20. About half of black and Hispanic children in female-headed households live in poverty. ANS: T DIF: 1 REF: 20-1 NAT: Analytic LOC: Efficiency and equity TOP: Poverty MSC: Applicative
- 3. Chapter 20/Income Inequality and Poverty 69 21. The economic life cycle describes how young people usually have higher savings rates than middle-aged people. ANS: F DIF: 1 REF: 20-1 NAT: Analytic LOC: Efficiency and equity TOP: Economic life cycle MSC: Applicative 22. Many economists believe that a family bases its spending decisions on its permanent, or average, income rather than on transitory income. ANS: T DIF: 1 REF: 20-1 NAT: Analytic LOC: Efficiency and equity TOP: Economic life cycle MSC: Applicative 23. About four out of five millionaires in the United States earned their money rather than inherited it. ANS: T DIF: 2 REF: 20-1 NAT: Analytic LOC: Efficiency and equity TOP: Economic mobility MSC: Applicative 24. Fewer than three percent of families are poor for eight or more years. ANS: T DIF: 1 REF: 20-1 NAT: Analytic LOC: Efficiency and equity TOP: Economic mobility MSC: Applicative 25. Utilitarians believe that the proper goal of the government is to maximize the sum of the utilities of everyone in society. ANS: T DIF: 1 REF: 20-2 NAT: Analytic LOC: The role of government TOP: Utilitarianism MSC: Interpretive 26. The utilitarian justification for redistributing income is based on the assumption of diminishing marginal utility. ANS: T DIF: 1 REF: 20-2 NAT: Analytic LOC: The role of government TOP: Utilitarianism MSC: Interpretive 27. If a government could successfully achieve the maximin criterion, each member of society would have an equal income. ANS: F DIF: 2 REF: 20-2 NAT: Analytic LOC: The role of government TOP: Liberalism MSC: Interpretive 28. According to libertarians, the government should redistribute income from rich individuals to poor individuals to achieve a more equal distribution of income. ANS: F DIF: 2 REF: 20-2 NAT: Analytic LOC: The role of government TOP: Libertarianism MSC: Interpretive 29. Libertarians believe that the government should enforce individual rights to ensure that all people have the same opportunities to use their talents to achieve success. ANS: T DIF: 1 REF: 20-2 NAT: Analytic LOC: The role of government TOP: Libertarianism MSC: Interpretive 30. The poverty rate is an absolute level of income set by the federal government for each family size below which a family is deemed to be in poverty. ANS: F DIF: 1 REF: 20-1 NAT: Analytic LOC: Efficiency and equity TOP: Poverty rate, Poverty line MSC: Definitional
- 4. 70 Chapter 20/Income Inequality and Poverty 31. An income distribution may not give an accurate picture of families’ standards of living because it does not include in-kind transfers. ANS: T DIF: 2 REF: 20-1 NAT: Analytic LOC: Efficiency and equity TOP: Income inequality MSC: Interpretive 32. A goal of libertarians is to provide citizens with equal opportunities rather than to ensure equal outcomes. ANS: T DIF: 2 REF: 20-2 NAT: Analytic LOC: Efficiency and equity TOP: Libertarianism MSC: Interpretive 33. Temporary Assistance for Needy Families (TANF) is an example of a negative income tax program. ANS: F DIF: 2 REF: 20-3 NAT: Analytic LOC: Efficiency and equity TOP: Welfare MSC: Applicative 34. When poor families in developing countries experience an increase in family income, their children supply fewer hours of labor. ANS: T DIF: 2 REF: 20-3 NAT: Analytic LOC: Efficiency and equity TOP: Child labor MSC: Applicative 35. Education is the most important factor explaining reductions in child labor in Vietnam. ANS: F DIF: 2 REF: 20-3 NAT: Analytic LOC: Labor markets TOP: Child labor MSC: Applicative 36. Internet access is the most important factor explaining reductions in child labor in Vietnam. ANS: F DIF: 2 REF: 20-3 NAT: Analytic LOC: Labor markets TOP: Child labor MSC: Applicative 37. Since 1959 the United States’ income distribution has become more equal. ANS: F DIF: 2 REF: 20-1 NAT: Analytic LOC: Efficiency and equity TOP: Income inequality MSC: Applicative 38. In 2005 the top fifth of income earners accounted for over 50% of all income received by United States’ families. ANS: F DIF: 2 REF: 20-1 NAT: Analytic LOC: Efficiency and equity TOP: Income inequality MSC: Applicative 39. In 2005 the top 5 percent of income earners accounted for over 50% of all income received by United States’ families. ANS: F DIF: 2 REF: 20-1 NAT: Analytic LOC: Efficiency and equity TOP: Income inequality MSC: Applicative 40. From 1935 to 2005 the share of total income earned by the bottom fifth of income earners rose and then fell. ANS: T DIF: 2 REF: 20-1 NAT: Analytic LOC: Efficiency and equity TOP: Income inequality MSC: Applicative
- 5. Chapter 20/Income Inequality and Poverty 71 SHORT ANSWER 1. Explain the relationship between labor earnings and the distribution of income. ANS: A person's earnings depend on the supply and demand for that person's labor, which in turn depends on natural ability, human capital, compensating differentials, discrimination, and so on. Because labor earnings make up about three-fourths of the total income in the U.S. economy, the factors that determine wages are also largely responsible for determining how the economy's total income is distributed among the various members of society. DIF: 1 REF: 20-0 TOP: Income inequality MSC: Interpretive 2. What is meant by a perfectly equal distribution of income? Use a graph to depict such a situation. ANS: If income were equally distributed across all families, each one-fifth of families would receive one-fifth of income. That is, 20 percent of all families would receive 20 percent of all income, 60 percent of all families would receive 60 percent of all income, etc. DIF: 2 REF: 20-1 TOP: Income inequality MSC: Analytical 3. Given the table shown, which country has a more equal income distribution? Explain your answer. Country Bottom Fifth Second Fifth Middle Fifth Fourth Fifth Top Fifth Country A 9.0% 13.5% 17.5% 22.9% 37.1% Country B 4.8% 10.5% 16.0% 23.5% 45.2% ANS: Country A has a more equal income distribution. If income were equally distributed across all families, each one-fifth of families would receive one-fifth of income. Country A is closer to that situation than Country B. DIF: 2 REF: 20-1 TOP: Income inequality MSC: Interpretive 4. Explain what information is contained in the poverty rate statistic. Are there problems in using an absolute scale to measure poverty? If so, explain them. ANS: The poverty rate is the percentage of the population whose family income falls below an absolute level called the poverty line. The poverty line is set by the federal government at roughly three times the cost of providing an adequate diet. There are several problems associated with measuring poverty using an absolute scale. For example, the cost of living may differ across broad geographic regions. Families may be better off than their income level indicates if they receive in-kind transfers. Finally, it is very difficult to measure a true standard of living. DIF: 2 REF: 20-1 TOP: Poverty rate | Poverty line MSC: Analytical
- 6. 72 Chapter 20/Income Inequality and Poverty 5. Compare and contrast the life cycle hypothesis and the permanent income hypothesis. What are their respective implications for inequality in the income distribution? ANS: Life-cycle variation in income suggests that people’s spending patterns vary less over their lifetimes than their income patterns. Young people may borrow so that they can spend more than they earn. An example of this would be a young person borrowing to go to college, buy a car, or buy a house. Annual earnings peak around age 50. Not surprisingly, many people save more in middle-age than at other times in their life. Their savings allow them to pay off the debts incurred when they were younger and to put away money that they will use to supplement their incomes once they retire. The permanent income hypothesis tries to account for random and transitory forces that affect income. People may borrow when they experience a temporary reduction in income and may save unexpected increases in income (e.g. a holiday bonus from an employer). The two theories are not mutually exclusive. Both theories would indicate that standard measures of income distribution overstate inequality in the distribution of well-being. DIF: 2 REF: 20-1 TOP: Economic life cycle MSC: Interpretive 6. Explain the concept of diminishing marginal utility, and describe the role that it plays in the utilitarian argument for the redistribution of income. ANS: Diminishing marginal utility refers to the principle that as a person's income rises, the extra well-being derived from an additional dollar of income falls. The utilitarian argument of redistribution from rich to poor hinges on the fact that a dollar of additional income to the poor is valued more than a dollar of additional income to the rich. If this is not true, then the transfer from rich to poor would actually reduce the well-being of society. DIF: 2 REF: 20-2 TOP: Diminishing marginal utility | Utilitarianism MSC: Interpretive 7. Explain how a leaky bucket can be used to illustrate the utilitarian argument that governments should not attempt to completely equalize individual incomes. ANS: Utilitarians reject complete equalization of income because they believe that people respond to incentives. As such, redistribution will reduce some people’s work efforts, which can actually lead to less total income generated in the economy. If the government attempts to redistribute income from the rich to the poor through taxes, some of the money will be lost due to the distorted incentives and deadweight losses associated with the taxes. We can think of the government as transporting the redistributed income in a “leaky bucket.” DIF: 2 REF: 20-2 TOP: Utilitarianism MSC: Interpretive 8. Briefly describe the three prominent schools of thought in political philosophy. Identify one of the most well-known philosophers in each school. ANS: According to utilitarianism, the government should choose policies to maximize the total utility of society by attempting to achieve a more equal distribution of income. Jeremy Bentham and John Stuart Mill were the founders. According to liberalism, the government should choose policies deemed to be just, as evaluated by an impartial observer behind a veil of ignorance. The main decision-making rule is called the maximin criterion, which says that the government should aim to maximize the well-being of the worst-off person in society. John Rawls developed the liberalism philosophy in his book A Theory of Justice. According to libertarianism, the government should punish crimes and enforce voluntary agreements but not redistribute income that was fairly earned (not stolen). Libertarians argue that society itself earns no income; only individual members of society earn income. Robert Nozick was a libertarian. DIF: 2 REF: 20-2 TOP: Income redistribution MSC: Analytical
- 7. Chapter 20/Income Inequality and Poverty 73 9. The table below reflects the levels of total utility received from income for each of four members of a society. Income Peter Paul Mary Jane $1 15 32 20 16 $2 29 61 38 30 $3 42 87 54 42 $4 54 110 68 52 $5 65 130 80 60 $6 75 147 90 66 $7 84 161 98 70 $8 92 172 103 72 a. Assume that the society has the following income distribution: Peter $3 Paul $7 Mary $5 Jane $3 Is it possible for the government to increase total aggregate utility by redistributing income among members of society? Explain your answer. b. Assume that the government has $19 to allocate among the four members of society. (Assume that no one has any income to start with.) If the government is interested in distributing income in a way that maximizes aggregate total utility, how should it distribute the $19 of income? c. Does the table above describe a situation characterized by diminishing marginal utility? Explain your answer. ANS: a. No. If a dollar is taken from anyone, the possible net gain in utility to any other person is less than or equal to the loss incurred by the person it is taken from. b. Peter $4 Paul $7 Mary $5 Jane $3 c. Yes. Marginal utility declines as income increases for each person. DIF: 3 REF: 20-3 TOP: Income redistribution MSC: Analytical 10. Assume that the government proposes a negative income tax that calculates taxes owed by the following formula, Taxes Owed = (1/3 Income) - $10,000. Compute the tax that would be owed given each level of income. a. $120,000 b. $90,000 c. $60,000 d. $30,000 e. $0 ANS: a. $30,000 b. $20,000 c. $10,000 d. $0 e. No taxes will be owed. Instead, the family/person would receive a subsidy of $10,000 DIF: 3 REF: 20-3 TOP: Negative income tax MSC: Analytical
- 8. 74 Chapter 20/Income Inequality and Poverty 11. Assume that the government proposes a negative income tax that calculates taxes owed by the formula, Taxes Owed = (a Income) - b. A family with an income of $40,000 pays $5,000 in taxes, and a family with an income of $12,000 receives an income subsidy of $2,000. a. What is the value for “a”? b. What is the value for “b”? c. What is the tax liability of a family with an income of $50,000? d. At what level of income will a family neither pay taxes, nor receive an income subsidy? ANS: a. 0.25 or 25% b. $5,000 c. $7,500 d. $20,000 DIF: 3 REF: 20-3 TOP: Negative income tax MSC: Analytical 12. Explain what is meant by in-kind transfer programs. Briefly outline the advantages and disadvantages of an in-kind transfer program. ANS: An in-kind transfer program distributes specific goods and services to individuals who meet some criteria of need based on income. Examples of such programs include food stamps, Medicaid, and the distribution of toys and other presents during the Christmas season. Advocates of in-kind transfers argue that such transfers ensure that the poor receive assistance that is focused on basic needs such as food and medical care. Because the programs are restrictive, society is somewhat reassured that recipients are not spending their benefits on unproductive addictions such as alcohol. Advocates of cash payments argue that in-kind transfers are inefficient because the government does not know what goods and services the poor need most. DIF: 1 REF: 20-3 TOP: In-kind transfers MSC: Applicative 13. Assume you are a critic of welfare reforms that impose a time limit on the number of years a person is eligible for welfare benefits. What is the foundation of your critique? ANS: The critique is based on the premise that most people on welfare would not make a choice to pursue a life on welfare if it were not thrust upon them. As such, we have an obligation to help them as long as there is demonstrated need. DIF: 1 REF: 20-3 TOP: Welfare MSC: Applicative 14. Outline the possible work disincentives created by anti-poverty programs. Is there a way to solve this problem without causing other forms of inefficiency to arise? Explain your answer. ANS: A high marginal tax rate exists on welfare transfers. There is inherently a trade-off between burdening the poor with a high effective marginal tax rate and burdening taxpayers with costly programs to reduce poverty. DIF: 2 REF: 20-3 TOP: Welfare MSC: Analytical Sec 00--Income Inequality and Poverty MULTIPLE CHOICE 1. A government's policy of redistributing income makes the income distribution a. more equal, distorts incentives, alters behavior, and makes the allocation of resources more efficient. b. more equal, distorts incentives, alters behavior, and makes the allocation of resources less efficient. c. less equal, distorts incentives, alters behavior, and makes the allocation of resources more efficient. d. less equal, distorts incentives, alters behavior, and makes the allocation of resources less efficient.
- 9. Chapter 20/Income Inequality and Poverty 75 ANS: B DIF: 1 REF: 20-0 NAT: Analytic LOC: Efficiency and equity TOP: Income inequality MSC: Applicative 2. In the United States, labor earnings are what percent of total income? a. 75 percent b. 70 percent c. 65 percent d. 50 percent ANS: A DIF: 1 REF: 20-0 NAT: Analytic LOC: Efficiency and equity | The study of economics, and definitions of economics TOP: Income inequality MSC: Definitional 3. Which of the following is most likely to occur when the government enacts policies to make the distribution of income more equal? a. A more efficient allocation of resources. b. A distortion of incentives. c. Unchanged behavior. d. All of the above are correct. ANS: B DIF: 1 REF: 20-0 NAT: Analytic LOC: Efficiency and equity TOP: Income inequality MSC: Applicative 4. The invisible hand of the marketplace acts to allocate resources a. efficiently but does not necessarily ensure that resources are allocated fairly. b. both fairly and efficiently. c. fairly but does not necessarily ensure that resources are allocated efficiently. d. neither fairly nor efficiently. ANS: A DIF: 1 REF: 20-0 NAT: Analytic LOC: Efficiency and equity TOP: Income inequality MSC: Applicative 5. The marketplace allocates resources a. fairly. b. efficiently. c. to those desiring them least. d. both efficiently and equitably. ANS: B DIF: 1 REF: 20-0 NAT: Analytic LOC: Efficiency and equity TOP: Income inequality MSC: Applicative 6. When the government redistributes income to achieve greater equality, it a. distorts incentives. b. improves efficiency. c. focuses on middle income brackets. d. relies on foreign aid to help balance the budget. ANS: A DIF: 1 REF: 20-0 NAT: Analytic LOC: Efficiency and equity TOP: Income inequality MSC: Interpretive 7. Government programs that take money from high-income people and give it to low-income people typically a. improve economic efficiency by reducing poverty. b. reduce economic efficiency because they distort incentives. c. have no effect on economic efficiency because they both reduce poverty and distort incentives. d. sometimes improve, sometimes reduce, and sometimes have no effect on economic efficiency. ANS: B DIF: 2 REF: 20-0 NAT: Analytic LOC: Efficiency and equity TOP: Income inequality MSC: Interpretive
- 10. 76 Chapter 20/Income Inequality and Poverty 8. In the U.S. economy, labor earnings make up about a. one-half of total income. b. two-thirds of total income. c. three-fourths of total income. d. nine-tenths of total income. ANS: C DIF: 1 REF: 20-0 NAT: Analytic LOC: The study of economics, and definitions of economics TOP: Income | Labor MSC: Definitional 9. When the government enacts policies to redistribute income, a. the objective is to enhance efficiency and a side effect is that the allocation of resources becomes more equal. b. the objective is to enhance efficiency and a side effect is that the allocation of resources becomes less equal. c. the objective is to enhance equality and a side effect is that the allocation of resources becomes more efficient. d. the objective is to enhance equality and a side effect is that the allocation of resources becomes less efficient. ANS: D DIF: 2 REF: 20-0 NAT: Analytic LOC: Efficiency and equity TOP: Efficiency | Equity MSC: Interpretive 10. Which of the following is correct? a. Governments can never improve market outcomes. b. Governments can sometimes improve market outcomes. c. Governments can always improve market outcomes. d. Government can never make the income distribution more equal. ANS: B DIF: 1 REF: 20-0 NAT: Analytic LOC: The study of economics, and definitions of economics TOP: Income inequality MSC: Definitional 11. Which of the Ten Principles of Economics do governments run into when they redistribute income to achieve greater equality? a. Trade can make everyone better off. b. The cost of something is what you give up to get it. c. People face trade-offs. d. Markets are usually a good way to organize economic activity. ANS: C DIF: 1 REF: 20-0 NAT: Analytic LOC: The study of economics, and definitions of economics TOP: Ten principles of economics MSC: Definitional 12. Which of the Ten Principles of Economics come into conflict with each other in this chapter? a. A country’s standard of living depends on its ability to produce goods People face tradeoffs. b. Prices rise when the government prints too much money Governments can sometimes improve market outcomes. c. Governments can sometimes improve market outcomes People face tradeoffs. d. People face tradeoffs Prices rise when the government prints too much money . ANS: C DIF: 1 REF: 20-0 NAT: Analytic LOC: The study of economics, and definitions of economics TOP: Ten principles of economics MSC: Definitional
- 11. Chapter 20/Income Inequality and Poverty 77 Sec 01--Income Inequality and Poverty The Measurement of Inequality MULTIPLE CHOICE 1. Governments enact policies to a. make the distribution of income more efficient. b. make the distribution of income more equal. c. maximize the use of the welfare system. d. minimize the use of in-kind transfers. ANS: B DIF: 1 REF: 20-1 NAT: Analytic LOC: Efficiency and equity TOP: Income inequality MSC: Interpretive 2. A family’s ability to buy goods and services depends largely on its a. permanent income, which is its normal, or average, income. b. permanent income, which is the lowest annual income the family has received over a 10-year period. c. transitory income, which is the measure of income used by the government to analyze the distribution of income and the poverty rate. d. transitory income, which is its money income plus any in-kind transfers it receives. ANS: A DIF: 2 REF: 20-1 NAT: Analytic LOC: The study of economics, and definitions of economics TOP: Consumption | Income MSC: Interpretive 3. Which of the following is not a question that economists try to answer when measuring the distribution of income? a. How many people live in poverty? b. How often and how large are people’s raises? c. How often do people move among income classes? d. What problems arise in measuring the amount of inequality? ANS: B DIF: 1 REF: 20-1 NAT: Analytic LOC: Efficiency and equity TOP: Income inequality MSC: Applicative 4. Economists study poverty and income inequality in order to answer which of the following questions? a. What are people's wages? b. How does labor-force experience affect wages? c. How much inequality is there in society? d. How do people adjust their behavior due to taxation? ANS: C DIF: 1 REF: 20-1 NAT: Analytic LOC: Efficiency and equity TOP: Income inequality MSC: Applicative 5. Comparing the United States household income distribution to other countries is a. easy, because data is available for all countries in the world. b. easy, because some countries collect data on expenditures instead of incomes. c. problematic, because international agreements require countries to standardize their income accounting procedures. d. problematic, because countries collect data in different ways. ANS: D DIF: 1 REF: 20-1 NAT: Analytic LOC: Efficiency and equity TOP: Income inequality MSC: Interpretive 6. The income distribution in the United States shows that the income share of the top fifth of all families is a. over 50 percent. b. around 25 percent. c. more than 10 times the income of the bottom fifth. d. not much different from the income of the top 5 percent.
- 12. 78 Chapter 20/Income Inequality and Poverty ANS: C DIF: 1 REF: 20-1 NAT: Analytic LOC: Efficiency and equity TOP: Income inequality MSC: Interpretive 7. Based on data from 2005, the top fifth of all families received approximately what percent of all income in the United States? a. 78 percent b. 48 percent c. 21 percent d. 4 percent ANS: B DIF: 1 REF: 20-1 NAT: Analytic LOC: Efficiency and equity TOP: Income inequality MSC: Applicative 8. Based on U.S. income data from 2005, the bottom fifth of all families received approximately what percent of all income? a. 48 percent b. 21 percent c. 10 percent d. 4 percent ANS: D DIF: 1 REF: 20-1 NAT: Analytic LOC: Efficiency and equity TOP: Income inequality MSC: Applicative 9. Based on U.S. income data from 2005, the top fifth of all families received a. the same share of income as the bottom fifth. b. twice as much income as the bottom fifth. c. approximately 5 times more income than the bottom fifth. d. more than 10 times more income than the bottom fifth. ANS: D DIF: 1 REF: 20-1 NAT: Analytic LOC: Efficiency and equity TOP: Income inequality MSC: Applicative 10. U.S. income data over the last seventy years suggests that the distribution of income a. has gradually become more equal over the entire time period. b. has gradually become less equal over the entire time period. c. gradually became less equal until about 1970, then became more equal from 1970 to 2005. d. gradually became more equal until about 1970, then became less equal from 1970 to 2005. ANS: D DIF: 1 REF: 20-1 NAT: Analytic LOC: Efficiency and equity TOP: Income inequality MSC: Interpretive 11. In 2005, what percentage of U.S. families had income levels below $103,100? a. 5 percent b. 20 percent c. 80 percent d. 95 percent ANS: C DIF: 1 REF: 20-1 NAT: Analytic LOC: Efficiency and equity TOP: Income inequality MSC: Applicative 12. In 2003, what percentage of U.S. families had income levels above $103,100? a. 5 percent b. 20 percent c. 80 percent d. 95 percent ANS: B DIF: 1 REF: 20-1 NAT: Analytic LOC: Efficiency and equity TOP: Income inequality MSC: Applicative
- 13. Chapter 20/Income Inequality and Poverty 79 13. Which of the following is not correct? a. Poverty is long-term problem for relatively few families. b. Measurements of income inequality usually do not include in-kind transfers. c. Measurements of income inequality use lifetime incomes rather than annual incomes. d. Measurements of income inequality would be more meaningful if they reflected permanent rather than current income. ANS: C DIF: 2 REF: 20-1 NAT: Analytic LOC: Efficiency and equity TOP: Income inequality MSC: Applicative 14. Which of the following represents a problem in measuring inequality? a. Measurements of income distributions typically include in-kind transfers, which distort the measure of inequality. b. A normal life-cycle pattern causes inequality in the income distribution but may not reflect inequality in living standards. c. Transitory income is a better measure of inequality than permanent income. d. Both a and b are correct. ANS: B DIF: 3 REF: 20-1 NAT: Analytic LOC: Efficiency and equity TOP: Income inequality MSC: Interpretive 15. If income were equally distributed among households, a. each household's relative share of income would increase. b. each household's relative share of income would decrease. c. the top fifth of households would have 50 percent of the income. d. 50 percent of the households would receive exactly 50 percent of the income. ANS: D DIF: 2 REF: 20-1 NAT: Analytic LOC: Efficiency and equity TOP: Income inequality MSC: Interpretive 16. Which of the following does not explain the rise in income inequality from 1970 to 2005? a. Changes in technology. b. An increase in minimum wages. c. A reduction in the demand for unskilled labor. d. Increased international trade with low-wage countries. ANS: B DIF: 2 REF: 20-1 NAT: Analytic LOC: Efficiency and equity TOP: Income inequality MSC: Interpretive 17. Which of the following explains the rise in income inequality from 1970 to 2005? a. An increase in minimum wages. b. An increase in the demand for skilled labor. c. An increase in the demand for unskilled labor. d. Reduced international trade with low-wage countries. ANS: B DIF: 2 REF: 20-1 NAT: Analytic LOC: Efficiency and equity TOP: Income inequality MSC: Interpretive Table 20-1 Group Annual Family Income Top Quartile (25%) $85,000 and over Second Quartile $50,000 to $84,999 Third Quartile $28,000 to $49,999 Bottom Quartile Under $28,000
- 14. 80 Chapter 20/Income Inequality and Poverty 18. Refer to Table 20-1. Seventy-five percent of all families have incomes below what level? a. $28,000 b. $50,000 c. $85,000 d. There is insufficient information to answer this question. ANS: C DIF: 2 REF: 20-1 NAT: Analytic LOC: Efficiency and equity TOP: Income inequality MSC: Interpretive 19. Refer to Table 20-1. Fifty percent of all families have incomes below what level? a. $28,000 b. $50,000 c. $85,000 d. There is insufficient information to answer this question. ANS: B DIF: 2 REF: 20-1 NAT: Analytic LOC: Efficiency and equity TOP: Income inequality MSC: Interpretive 20. When we compare the income distribution of the United States to those of other countries, we find that the U.S. a. has one of the most unequal income distributions. b. has one of the most equal income distributions. c. ranks in the middle of the group. d. is second to China as the most unequal distribution. ANS: C DIF: 1 REF: 20-1 NAT: Analytic LOC: Efficiency and equity TOP: Income inequality MSC: Interpretive Table 20-2 Percentage of Before-Tax Income Received by Families in Hapland Group Percentage of Family Income in 2000 Percentage of Family Income in 1950 Top Fifth 50.7 45.9 Fourth Fifth 26.9 25.8 Middle Fifth 12.1 13.6 Second Fifth 6.2 7.2 Bottom Fifth 4.1 5.5 21. Refer to Table 20-2. According to the table, from 1950 to 2000, Hapland income distribution became a. less equal. b. more equal. c. more equal at the lowest level of income but less equal at highest level of income. d. less equal at the lowest level of income but more equal at highest level of income. ANS: A DIF: 3 REF: 20-1 NAT: Analytic LOC: Efficiency and equity TOP: Income inequality MSC: Applicative Table 20-3 The Distribution of Income in Hapland Group Annual Family Income Top Fifth $120,000 and over Fourth Fifth $90,000 - 119,999 Middle Fifth $60,000 - 89,999 Second Fifth $45,000 - 59,999 Bottom Fifth Under $45,000
- 15. Chapter 20/Income Inequality and Poverty 81 22. Refer to Table 20-3. According to the table, what percent of families in Hapland have income levels below $90,000? a. 20 percent. b. 40 percent. c. 60 percent. d. 80 percent. ANS: C DIF: 2 REF: 20-1 NAT: Analytic LOC: Efficiency and equity TOP: Income inequality MSC: Applicative 23. Refer to Table 20-3. According to the table, what percent of families in Hapland have income levels above $60,000? a. 80 percent b. 60 percent c. 50 percent d. 40 percent ANS: B DIF: 2 REF: 20-1 NAT: Analytic LOC: Efficiency and equity TOP: Income inequality MSC: Applicative 24. Refer to Table 20-3. Where would the government in Hapland set the poverty line to have a poverty rate of 40 percent? a. $45,000. b. $60,000. c. $90,000. d. $120,000. ANS: B DIF: 2 REF: 20-1 NAT: Analytic LOC: Efficiency and equity TOP: Poverty line MSC: Applicative 25. The country that has the highest degree of income inequality is a. Japan. b. Brazil. c. South Africa. d. the United States. ANS: B DIF: 1 REF: 20-1 NAT: Analytic LOC: Efficiency and equity TOP: Income inequality MSC: Interpretive 26. The country that has the most income equality is a. Japan. b. Brazil. c. South Africa. d. the United States. ANS: A DIF: 1 REF: 20-1 NAT: Analytic LOC: Efficiency and equity TOP: Income inequality MSC: Interpretive 27. The United States has more income inequality than a. Brazil. b. Mexico. c. Canada. d. South Africa. ANS: C DIF: 2 REF: 20-1 NAT: Analytic LOC: Efficiency and equity TOP: Income inequality MSC: Interpretive
- 16. 82 Chapter 20/Income Inequality and Poverty 28. The United States has less income inequality than a. Japan. b. Canada. c. Germany. d. South Africa. ANS: D DIF: 2 REF: 20-1 NAT: Analytic LOC: Efficiency and equity TOP: Income inequality MSC: Interpretive 29. On average, the distribution of income tends to be a. random across richer and poorer countries. b. similar between richer and poorer countries. c. less equal in richer countries than in poorer countries. d. more equal in richer countries than in poorer countries. ANS: D DIF: 2 REF: 20-1 NAT: Analytic LOC: Efficiency and equity TOP: Income inequality MSC: Applicative 30. The United States has relatively greater income a. inequality than developing countries but greater equality than other developed countries. b. inequality than both developing and other developed countries. c. equality than developing countries but greater inequality than other developed countries. d. equality than both developing and other developed countries. ANS: C DIF: 2 REF: 20-1 NAT: Analytic LOC: Efficiency and equity TOP: Income inequality MSC: Interpretive 31. When we examine historical data on income inequality in the U.S., we see that the distribution of income gradually became a. more equal between 1935 and 2005. b. more equal between 1935 and 1973, but that trend reversed itself between 1973 and 2005. c. more unequal between 1935 and 1973, but that trend reversed itself between 1973 and 2005. d. more unequal between 1935 and 2005. ANS: B DIF: 1 REF: 20-1 NAT: Analytic LOC: Efficiency and equity TOP: Income inequality MSC: Interpretive 32. The 2005 U.S. distribution of income shows that the top fifth of all families have a. more than ten times the income of the bottom 20 percent. b. more than five times the income of the bottom 20 percent. c. more than double the income of the bottom 20 percent. d. the same share of income as the bottom 20 percent. ANS: A DIF: 1 REF: 20-1 NAT: Analytic LOC: Efficiency and equity TOP: Income inequality MSC: Applicative 33. The 2005 U.S. distribution of income shows that the top 5 percent of families have approximately what share of income? a. 1 percent b. 5 percent c. 10 percent d. 20 percent ANS: D DIF: 1 REF: 20-1 NAT: Analytic LOC: Efficiency and equity TOP: Income inequality MSC: Applicative
- 17. Chapter 20/Income Inequality and Poverty 83 34. The study by economists Cox and Alm found that the 2006 pre-tax income of the richest fifth of U.S. households is a. 5 times the pre-tax income of the poorest fifth. b. 10 times the pre-tax income of the poorest fifth. c. 15 times the pre-tax income of the poorest fifth. d. 20 times the pre-tax income of the poorest fifth. ANS: C DIF: 2 REF: 20-1 NAT: Analytic LOC: Efficiency and equity TOP: Income inequality MSC: Applicative 35. The study by economists Cox and Alm found that the 2006 after-tax income of the richest fifth of U.S. households is a. equal to the after-tax income of the poorest fifth. b. 7 times the after-tax income of the poorest fifth. c. 14 times the after-tax income of the poorest fifth. d. 21 times the after-tax income of the poorest fifth. ANS: C DIF: 2 REF: 20-1 NAT: Analytic LOC: Efficiency and equity TOP: Income inequality MSC: Applicative 36. The study by economists Cox and Alm found a. inequality in consumption is much smaller than inequality in annual income. b. inequality in consumption is slightly smaller than inequality in annual income. c. inequality in consumption is slightly larger than inequality in annual income. d. inequality in consumption is much larger than inequality in annual income. ANS: A DIF: 3 REF: 20-1 NAT: Analytic LOC: Efficiency and equity TOP: Income inequality MSC: Applicative 37. The study by economists Cox and Alm found a. the gap between rich and poor shrinks greatly if using after-tax income compared with pre-tax income. b. the gap between rich and poor shrinks slightly if using after-tax income compared with pre-tax income. c. the gap between rich and poor widens slightly if using after-tax income compared with pre-tax income. d. the gap between rich and poor widens greatly if using after-tax income compared with pre-tax income. ANS: B DIF: 3 REF: 20-1 NAT: Analytic LOC: Efficiency and equity TOP: Income inequality MSC: Applicative 38. Economist Tyler Cowen attributes increased income inequality to a. lower income inequality among older populations than younder populations. b. lower in-kind transfers made by governments. c. a larger number of educated people in the U.S. population. d. the development of the internet. ANS: C DIF: 2 REF: 20-1 NAT: Analytic LOC: Efficiency and equity TOP: Income inequality MSC: Applicative 39. Which of the following is not a reason given by economist Tyler Cowen for increased income inequality? a. Higher income inequality among older populations than younger populations. b. Lower in-kind transfers made by governments. c. A larger number of educated people in the U.S. population. d. The increasing numbers of older people in the U.S. population overall. ANS: B DIF: 3 REF: 20-1 NAT: Analytic LOC: Efficiency and equity TOP: Income inequality MSC: Applicative
- 18. 84 Chapter 20/Income Inequality and Poverty 40. Which of the following is not discussed by economist Tyler Cowen as an alternative to measuring inequality by income? a. Leisure. b. Happiness. c. Consumption. d. Age. ANS: D DIF: 3 REF: 20-1 NAT: Analytic LOC: Efficiency and equity TOP: Income inequality MSC: Applicative 41. When comparing the percentage of income (or expenditure) of the lowest and highest 20 percent of the population, a. South Africa has a more equal income distribution than the United States. b. South Africa has a more equal income distribution than Japan. c. Japan has a more equal income distribution than the United States. d. Mexico has a more equal income distribution than Canada. ANS: C DIF: 3 REF: 20-1 NAT: Analytic LOC: Efficiency and equity TOP: Income inequality MSC: Applicative 42. Since about 1970 in the U.S., a. decreases in the wages of unskilled workers, relative to skilled workers, have led to increased inequality in family incomes. b. increases in the wages of unskilled workers, relative to skilled workers, have led to increased equality in family incomes. c. inequality in family incomes has increased, despite increases in the wages of unskilled workers relative to skilled workers. d. inequality in family incomes has decreased, despite increases in the wages of skilled workers relative to unskilled workers. ANS: A DIF: 2 REF: 20-1 NAT: Analytic LOC: Efficiency and equity TOP: Income inequality MSC: Interpretive 43. The normal life cycle pattern of income a. contributes to more inequality in the distribution of annual income and to more inequality in living standards. b. contributes to more inequality in the distribution of annual income, but it does not necessarily contribute to more inequality in living standards. c. contributes to less inequality in the distribution of annual income and to less inequality in living standards. d. has no effect on either the distribution of annual income or on living standards. ANS: B DIF: 2 REF: 20-1 NAT: Analytic LOC: The study of economics, and definitions of economics TOP: Income inequality | Standard of living MSC: Interpretive 44. The poverty rate is based on a family’s a. income, in-kind transfers, and other government aid. b. income and in-kind transfers. c. in-kind transfers only. d. income only. ANS: D DIF: 2 REF: 20-1 NAT: Analytic LOC: Efficiency and equity TOP: Poverty rate MSC: Definitional 45. The poverty rate is a measure of the percentage of people whose incomes fall below a. a relative level of income. b. an absolute level of income. c. the median income for a family of three. d. the bottom 20 percent of the income distribution.
- 19. Chapter 20/Income Inequality and Poverty 85 ANS: B DIF: 1 REF: 20-1 NAT: Analytic LOC: Efficiency and equity TOP: Poverty rate MSC: Definitional 46. The poverty rate is a. a measure of income inequality across families. b. the percentage of the population whose family income falls below a specified level. c. an absolute level of income set by the federal government for each family size. d. measured by the number of in-kind transfers that a family receives. ANS: B DIF: 1 REF: 20-1 NAT: Analytic LOC: Efficiency and equity TOP: Poverty rate MSC: Definitional 47. In 2005, the poverty rate in the United States was a. 2.5 percent. b. 12.6 percent. c. 11.1 percent. d. 22.4 percent. ANS: B DIF: 1 REF: 20-1 NAT: Analytic LOC: Efficiency and equity TOP: Poverty rate MSC: Applicative 48. Over the past 50 years, the U.S. poverty rate was at its lowest level in a. 1973. b. 1980. c. 1990. d. 2005. ANS: A DIF: 2 REF: 20-1 NAT: Analytic LOC: Efficiency and equity TOP: Poverty rate MSC: Interpretive 49. A commonly-used gauge of poverty is the a. income inequality rate. b. average income rate. c. poverty rate. d. social inequality rate. ANS: C DIF: 1 REF: 20-1 NAT: Analytic LOC: Efficiency and equity TOP: Poverty rate MSC: Applicative 50. Based on U.S. data for 2005, the poverty rate is the highest for which group of people? a. children b. married couples c. female households, no spouse present d. the elderly ANS: C DIF: 2 REF: 20-1 NAT: Analytic LOC: Efficiency and equity TOP: Poverty rate MSC: Applicative 51. The percentage of families with incomes below the poverty line a. is defined as the 10 percent of U.S.households with the lowest incomes. b. is known as the poverty rate. c. is known as the unemployment rate. d. rises as the general income level rises. ANS: B DIF: 1 REF: 20-1 NAT: Analytic LOC: Efficiency and equity TOP: Poverty rate MSC: Definitional
- 20. 86 Chapter 20/Income Inequality and Poverty 52. Measures of poverty that fail to account for the value of in-kind transfers a. understate the actual poverty rate. b. have little effect on the validity of reported poverty rates. c. are generally more reliable measures of actual poverty rates. d. overstate the actual poverty rate. ANS: D DIF: 1 REF: 20-1 NAT: Analytic LOC: Efficiency and equity TOP: Poverty rate | In-kind transfers MSC: Interpretive 53. Since the early 1970s, average incomes have a. increased, which has reduced the poverty rate. b. increased, while the poverty rate increased slightly. c. decreased, while the poverty rate has remained unchanged. d. remained unchanged, while the poverty rate has decreased. ANS: B DIF: 2 REF: 20-1 NAT: Analytic LOC: Efficiency and equity TOP: Poverty rate | Income MSC: Applicative 54. In 2005, the poverty rate in the United States was 12.6 percent. This means that 12.6 percent a. of the population had a total family income that fell below the poverty line. b. of the population had a total family income that was above the poverty line. c. of the population had a total family income below $10,000. d. of the population had a total family income above $50,000. ANS: A DIF: 2 REF: 20-1 NAT: Analytic LOC: Efficiency and equity TOP: Poverty rate MSC: Interpretive 55. The poverty line in the country of Inequalia is $10,000. The distribution of income for Inequalia is as follows: Number of Families Income 200 less than $5,000 300 between $5,000 and $10,000 500 between $10,000 and $15,000 700 between $15,000 and $20,000 100 over $20,000 The poverty rate in Inequalia is a. 11.1 percent. b. 16.7 percent. c. 27.8 percent. d. 55.5 percent. ANS: C DIF: 3 REF: 20-1 NAT: Analytic LOC: Efficiency and equity TOP: Poverty rate MSC: Analytical 56. The distribution of income for Inequalia is as follows: Number of Families Income 200 less than $5,000 300 between $5,000 and $10,000 500 between $10,000 and $15,000 700 between $15,000 and $20,000 100 over $20,000
- 21. Chapter 20/Income Inequality and Poverty 87 What would the poverty line need to be to have a poverty rate of 27.8 percent in Inequalia? a. $5,000. b. $10,000. c. $15,000. d. $20,000. ANS: B DIF: 3 REF: 20-1 NAT: Analytic LOC: Efficiency and equity TOP: Poverty rate | Poverty line MSC: Analytical 57. The poverty line in the country of Grim is $10,000. The distribution of income for Grim is as follows: Number of Families Income 500 less than $5,000 1,000 between $5,000 and $10,000 1,000 between $10,000 and $15,000 400 between $15,000 and $20,000 100 over $20,000 The poverty rate in Grim is a. 5 percent. b. 16.7 percent. c. 50 percent. d. 83.3 percent. ANS: C DIF: 3 REF: 20-1 NAT: Analytic LOC: Efficiency and equity TOP: Poverty rate MSC: Analytical 58. The distribution of income for Grim is as follows: Number of Families Income 500 less than $5,000 1,000 between $5,000 and $10,000 1,000 between $10,000 and $15,000 400 between $15,000 and $20,000 100 over $20,000 Where would the government in Grim set the poverty line to establish a poverty rate of 50 percent? a. $5,000. b. $10,000. c. $15,000. d. $20,000. ANS: B DIF: 3 REF: 20-1 NAT: Analytic LOC: Efficiency and equity TOP: Poverty rate | Poverty line MSC: Analytical 59. The distribution of income for Danville is as follows: Number of Families Income 500 less than $15,000 600 between $15,000 and $20,000 1,000 between $20,000 and $25,000 700 between $25,000 and $30,000 500 over $30,000
- 22. 88 Chapter 20/Income Inequality and Poverty Where would the government in Danville set the poverty line to establish a poverty rate of 33.3 percent? a. $15,000. b. $20,000. c. $25,000. d. $30,000. ANS: B DIF: 3 REF: 20-1 NAT: Analytic LOC: Efficiency and equity TOP: Poverty rate | Poverty line MSC: Analytical 60. The poverty line in the country of Abbyville is $15,000. The distribution of income for Abbyville is as follows: Number of Families Income 300 less than $15,000 500 between $15,000 and $20,000 900 between $20,000 and $25,000 600 between $25,000 and $30,000 200 over $30,000 The poverty rate in Abbyville is a. 12 percent. b. 32 percent. c. 50 percent. d. 68 percent. ANS: A DIF: 3 REF: 20-1 NAT: Analytic LOC: Efficiency and equity TOP: Poverty rate MSC: Analytical 61. The distribution of income for Abbyville is as follows: Number of Families Income 300 less than $15,000 500 between $15,000 and $20,000 900 between $20,000 and $25,000 600 between $25,000 and $30,000 200 over $30,000 Where would the government in Abbyville set the poverty line to generate a poverty rate of 12 percent? a. $15,000. b. $20,000. c. $25,000. d. $30,000. ANS: A DIF: 3 REF: 20-1 NAT: Analytic LOC: Efficiency and equity TOP: Poverty rate | Poverty line MSC: Analytical 62. In 2005, the poverty line for a family of four in the U.S. was a. $56,194. b. $28,097. c. $19,971. d. $12,603. ANS: C DIF: 1 REF: 20-1 NAT: Analytic LOC: Efficiency and equity TOP: Poverty line MSC: Applicative
- 23. Chapter 20/Income Inequality and Poverty 89 63. The poverty line is adjusted each year to reflect changes in the a. number of people currently on public assistance. b. level of prices. c. nutritional content of an adequate diet. d. size of a family. ANS: B DIF: 1 REF: 20-1 NAT: Analytic LOC: Efficiency and equity TOP: Poverty line MSC: Definitional 64. The federal government sets the poverty line at roughly a. five times the cost of providing an adequate diet. b. four times the cost of providing an adequate diet. c. three times the cost of providing an adequate diet. d. two times the cost of providing an adequate diet. ANS: C DIF: 1 REF: 20-1 NAT: Analytic LOC: Efficiency and equity TOP: Poverty line MSC: Definitional 65. The income level below which families are said to be poor is known as the a. income maintenance threshold. b. poverty line. c. bottom quintile of the income distribution. d. minimum wage. ANS: B DIF: 1 REF: 20-1 NAT: Analytic LOC: Efficiency and equity TOP: Poverty line MSC: Definitional 66. The poverty rate is the percentage of the population that have a family income level below the a. income maintenance threshold. b. poverty line. c. bottom quintile of the income distribution. d. minimum wage. ANS: B DIF: 1 REF: 20-1 NAT: Analytic LOC: Efficiency and equity TOP: Poverty line MSC: Definitional 67. If the U.S. government determines that the cost of feeding an urban family of six is $6,000 per year, then the official poverty line for a family of that type is a. $6,000. b. $12,000. c. $18,000. d. $36,000. ANS: C DIF: 2 REF: 20-1 NAT: Analytic LOC: Efficiency and equity TOP: Poverty line MSC: Applicative 68. If the U.S. government determines that the cost of feeding an urban family of four is $5,200 per year, then the official poverty line for a family of that type is a. $10,400. b. $15,600. c. $20,800. d. $26,000. ANS: B DIF: 2 REF: 20-1 NAT: Analytic LOC: Efficiency and equity TOP: Poverty line MSC: Applicative
- 24. 90 Chapter 20/Income Inequality and Poverty 69. The US government sets the poverty line equal to approximately a. three times the cost of providing subsidized housing. b. three times the cost of providing an adequate diet. c. the minimum wage for a single person working 40 hours per week and 50 weeks per year. d. the cost of providing food, shelter, and health care expenses for a family of four. ANS: B DIF: 2 REF: 20-1 NAT: Analytic LOC: Efficiency and equity TOP: Poverty line MSC: Applicative 70. The calculation of the poverty line includes adjustments for a. energy costs. b. child care costs. c. the level of prices. d. the Earned Income Tax Credit. ANS: C DIF: 2 REF: 20-1 NAT: Analytic LOC: Efficiency and equity TOP: Poverty line MSC: Interpretive 71. Which of the following statements is not correct? a. The poverty line is an absolute level of income set by the federal government below which a family is considered to be in poverty. b. The poverty line is approximately equal to three times the cost of providing an adequate diet. c. The poverty line is adjusted annually to reflect changes in price levels. d. The poverty line is adjusted semiannually to reflect changes in fuel prices. ANS: D DIF: 2 REF: 20-1 NAT: Analytic LOC: Efficiency and equity TOP: Poverty line MSC: Definitional 72. Poverty is found to be correlated with a. age and race but not family composition. b. race only. c. race and family composition but not age. d. age, race, and family composition. ANS: D DIF: 1 REF: 20-1 NAT: Analytic LOC: Efficiency and equity TOP: Poverty MSC: Applicative 73. Measuring poverty using an absolute income scale like the poverty line can be misleading because a. income measures do not include the value of in-kind transfers. b. money is more highly valued by the poor than by the rich. c. the poor are not likely to participate in the labor market. d. income measures are not adjusted for the effects of labor-market discrimination. ANS: A DIF: 1 REF: 20-1 NAT: Analytic LOC: Efficiency and equity TOP: Poverty MSC: Interpretive 74. Which of the following statements is correct? a. The poverty line is a relative standard. b. Economic growth that raises all incomes will decrease the number of families in poverty. c. Increasing income inequality reduces poverty. d. Economic growth, by definition, affects all families equally. ANS: B DIF: 2 REF: 20-1 NAT: Analytic LOC: Efficiency and equity TOP: Poverty MSC: Analytical
- 25. Chapter 20/Income Inequality and Poverty 91 75. Which of the following groups has the highest poverty rate? a. Blacks. b. Asians. c. Children (under age 18). d. Female-headed households. ANS: D DIF: 1 REF: 20-1 NAT: Analytic LOC: The study of economics, and definitions of economics TOP: Poverty MSC: Applicative 76. Which of the following is not correct? a. Poverty is correlated with race. b. Poverty is correlated with age. c. Poverty is correlated with family composition. d. Poverty is correlated with country of origin. ANS: D DIF: 1 REF: 20-1 NAT: Analytic LOC: Efficiency and equity TOP: Poverty MSC: Applicative 77. In comparison to the average poverty rate, a. children and the elderly are more likely to be poor. b. children and the elderly are less likely to be poor. c. children are more likely to be poor, but the elderly are less likely to be poor. d. children are less likely to be poor, but the elderly are more likely to be poor. ANS: C DIF: 2 REF: 20-1 NAT: Analytic LOC: Efficiency and equity TOP: Poverty MSC: Applicative Table 20-4 Poverty Thresholds in 2002, by Size of Family and Number of Related Children Under 18 Years [Dollars] Related children under 18 years Size of family unit None One Two Three Four Five Six Seven Eight or more One person (unrelated individual) Under 65 years 9,359 65 years and over 8,628 Two persons Householder under 65 years 12,047 12,400 Householder 65 years and over 10,874 12,353 Three persons 14,072 14,480 14,494 Four persons 18,556 18,859 18,244 18,307 Five persons 22,377 22,703 22,007 21,469 21,141 Six persons 25,738 25,840 25,307 24,797 24,038 23,588 Seven persons 29,615 29,799 29,162 28,718 27,890 26,924 25,865 Eight persons 33,121 33,414 32,812 32,285 31,538 30,589 29,601 29,350 Nine persons or more 39,843 40,036 39,504 39,057 38,323 37,313 36,399 36,173 34,780 Source: U. S. Bureau of the Census, Current Population Survey. 78. Refer to Table 20-4. What is the poverty line for a family of six with three children? a. $21,469 b. $24,797 c. $25,738 d. $28,718 ANS: B DIF: 1 REF: 20-1 NAT: Analytic LOC: Efficiency and equity TOP: Poverty line MSC: Applicative
- 26. 92 Chapter 20/Income Inequality and Poverty 79. Refer to Table 20-4. What is the poverty line for a family of eight with two children? a. $14,494 b. $32,812 c. $33,121 d. $34,780 ANS: B DIF: 1 REF: 20-1 NAT: Analytic LOC: Efficiency and equity TOP: Poverty line MSC: Applicative 80. Refer to Table 20-4. What is the poverty line for a family of three with one child? a. $12,072 b. $12,400 c. $14,480 d. $14,494 ANS: C DIF: 1 REF: 20-1 NAT: Analytic LOC: Efficiency and equity TOP: Poverty line MSC: Applicative 81. Refer to Table 20-4. What is the poverty line for a 75 year old individual? a. $8,628 b. $9,359 c. $12,353 d. $12,400 ANS: A DIF: 1 REF: 20-1 NAT: Analytic LOC: Efficiency and equity TOP: Poverty line MSC: Applicative 82. Refer to Table 20-4. What is the poverty line for a family with one 35-year-old adult and one child? a. $8,628 b. $9,359 c. $12,353 d. $12,400 ANS: D DIF: 1 REF: 20-1 NAT: Analytic LOC: Efficiency and equity TOP: Poverty line MSC: Applicative
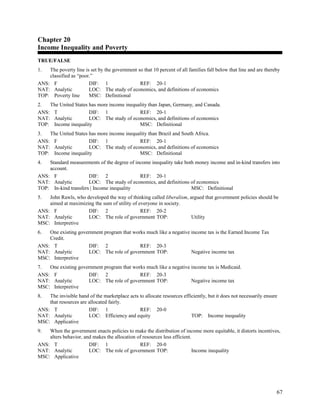
- 27. Chapter 20/Income Inequality and Poverty 93 Figure 20-1 Number of Poor 83. Refer to Figure 20-1. The absolute number of people in poverty a. is higher in 2001 than in 1959. b. is lower in 2001 than in 1959. c. has not changed between 1959 and 2001. d. has steadily decreased between 1959 and 2001. ANS: B DIF: 2 REF: 20-1 NAT: Analytic LOC: Reading and interpreting graphs TOP: Poverty MSC: Interpretive 84. Refer to Figure 20-1. Between 1965 and 2001, during recessions (the shaded bars) the number of individuals in poverty has a. increased. b. decrease. c. not changed. d. decreased and then increased. ANS: A DIF: 2 REF: 20-1 NAT: Analytic LOC: Reading and interpreting graphs TOP: Poverty MSC: Interpretive 85. Refer to Figure 20-1. Between 1959 and 2001 the poverty rate has a. increased. b. decreased. c. stayed the same. d. moved in the opposite direction of the number of people in poverty. ANS: B DIF: 2 REF: 20-1 NAT: Analytic LOC: Reading and interpreting graphs TOP: Poverty rate MSC: Interpretive
- 28. 94 Chapter 20/Income Inequality and Poverty Figure 20-2 Poverty Rates by Age 86. Refer to Figure 20-2. In 2001, the percent of children under age 18 in poverty is a. higher than both the percentage of adults aged 18 to 64 and the percentage of elderly aged 65 years and over in poverty. b. higher than the percentage of adults aged 18 to 64 but is lower than the percentage of elderly aged 65 years and over in poverty. c. lower than both the percentage of adults aged18 to 64 and the percentage of elderly aged 65 years and over in poverty. d. lower than the percentage of adults aged 18 to 64 but is higher than the percentage of elderly aged 65 years and over in poverty. ANS: A DIF: 2 REF: 20-1 NAT: Analytic LOC: Reading and interpreting graphs TOP: Poverty MSC: Interpretive 87. Refer to Figure 20-2. In 1968, the percent of adults aged 18 to 64 years in poverty is a. higher than both the percentage of children under age 18 and the percentage of elderly aged 65 and over in poverty. b. higher than the percentage of children under age 18 but is lower than the percentage of elderly aged 65 and over in poverty. c. is lower than both the percentage of children under age 18 and the percentage of elderly aged 65 and over in poverty. d. is lower than the percentage of children under age 18 but is higher than the percentage of elderly aged 65 and over in poverty. ANS: C DIF: 2 REF: 20-1 NAT: Analytic LOC: Reading and interpreting graphs TOP: Poverty MSC: Interpretive 88. Refer to Figure 20-2. In 2001, the percent of adults between aged 18 and 64 in poverty is a. higher than both the percentage of children under age 18 and the percentage of elderly aged 65 and over in poverty. b. higher than the percentage of children under age 18 but is lower than the percentage of elderly aged 65 and over in poverty. c. is lower than both the percentage of children under age 18 and the percentage of elderly aged 65 and over in poverty. d. is lower than the percentage of children under age 18 and is equal to the percentage of elderly aged 65 and over in poverty.
- 29. Chapter 20/Income Inequality and Poverty 95 ANS: D DIF: 2 REF: 20-1 NAT: Analytic LOC: Reading and interpreting graphs TOP: Poverty MSC: Interpretive 89. Refer to Figure 20-2. In 1968, the percent of children under age 18 in poverty is a. higher than both the percentage of adults aged 18 to 64 and the percentage of elderly aged 65 and over in poverty. b. higher than the percentage of adults aged 18 to 64 but is lower than the percentage of elderly aged 65 and over in poverty. c. lower than both the percentage of adults aged 18 to 64 and the percentage of elderly aged 65 and over in poverty. d. lower than the percentage of adults aged 18 to 64 but is higher than the percentage of elderly aged 65 and over in poverty. ANS: B DIF: 2 REF: 20-1 NAT: Analytic LOC: Reading and interpreting graphs TOP: Poverty MSC: Interpretive 90. Refer to Figure 20-2. In 1968, the percent of elderly aged 65 and over in poverty is a. higher than both the percentage of adults aged 18 to 64 and the percentage of children under age 18 in poverty. b. higher than the percentage of adults aged 18 to 64 but is lower than the percentage of children under age 18 in poverty. c. lower than both the percentage of adults aged 18 to 64 and the percentage of children under age 18 in poverty. d. is lower than the percentage of adults aged 18 to 64 but is higher than the percentage of children under age 18 in poverty. ANS: A DIF: 2 REF: 20-1 NAT: Analytic LOC: Reading and interpreting graphs TOP: Poverty MSC: Interpretive 91. Refer to Figure 20-2. In 2001, the percent of elderly aged 65 and over in poverty is a. higher than both the percentage of adults aged 18 to 64 and the percentage of children under age 18 in poverty. b. higher than the percentage of adults aged 18 to 64 but is lower than the percentage of children under age 18 in poverty. c. lower than both the percentage of adults aged 18 to 64 and the percentage of children under age 18 in poverty. d. lower than the percentage of children under age 18 but is equal to the percentage of adults aged 18 to 64 in poverty. ANS: D DIF: 2 REF: 20-1 NAT: Analytic LOC: Reading and interpreting graphs TOP: Poverty MSC: Interpretive 92. Refer to Figure 20-2. From 1969 to 2001, the percent of elderly aged 64 and over in poverty has a. declined, while the percentage of children under age 18 in poverty has also declined. b. declined, while the percentage of children under age 18 in poverty has increased. c. increased, while the percentage of children under age 18 in poverty has declined. d. increased, while the percentage of children under age 18 in poverty has also increased. ANS: B DIF: 2 REF: 20-1 NAT: Analytic LOC: Reading and interpreting graphs TOP: Poverty MSC: Interpretive 93. If the value of in-kind transfers are taken into account, the number of families living in poverty in the United States would a. increase by about 1 percent. b. decrease by about 1 percent. c. decrease by about 5 percent. d. decrease by about 10 percent.
- 30. 96 Chapter 20/Income Inequality and Poverty ANS: D DIF: 1 REF: 20-1 NAT: Analytic LOC: Efficiency and equity TOP: In-kind transfers MSC: Applicative 94. Which of the following is not an example of in-kind transfers? a. Food stamps. b. Medicare. c. The Earned Income Tax Credit. d. Housing vouchers. ANS: C DIF: 1 REF: 20-1 | 20-3 NAT: Analytic LOC: Efficiency and equity TOP: In-kind transfers MSC: Applicative 95. In-kind transfers are a. obtained only by those who have political connections. b. provided only by the U. S. government. c. non-monetary items given to the poor. d. obtained primarily through soup kitchens and private charities. ANS: C DIF: 1 REF: 20-1 NAT: Analytic LOC: Efficiency and equity TOP: In-kind transfers MSC: Definitional 96. Government vouchers to purchase food, also known as food stamps, are an example of a. an in-kind transfer. b. life-cycle income. c. a negative income tax. d. permanent income. ANS: A DIF: 1 REF: 20-1 NAT: Analytic LOC: Efficiency and equity TOP: In-kind transfers MSC: Definitional 97. In-kind transfers are transfers to the poor a. in the form of goods and services rather than cash. b. in the form of goods, services, and cash. c. from private charitable organizations only. d. from the federal government only. ANS: A DIF: 1 REF: 20-1 NAT: Analytic LOC: Efficiency and equity TOP: In-kind transfers MSC: Definitional 98. The statement that measures of the distribution of income are based on money income relates to which problem in measuring inequality? a. In-kind transfers. b. Economic life cycle. c. Transitory versus permanent income. d. Economic mobility. ANS: A DIF: 2 REF: 20-1 NAT: Analytic LOC: Efficiency and equity TOP: In-kind transfers MSC: Interpretive 99. In the United States, a typical worker's income peaks around age a. 70. b. 60. c. 50. d. 40. ANS: C DIF: 1 REF: 20-1 NAT: Analytic LOC: Efficiency and equity TOP: Economic life cycle MSC: Applicative
- 31. Chapter 20/Income Inequality and Poverty 97 100. People have their highest saving rates when they are a. retired. b. middle-aged. c. married with young children. d. young and single. ANS: B DIF: 1 REF: 20-1 NAT: Analytic LOC: Efficiency and equity TOP: Economic life cycle MSC: Applicative 101. The regular pattern of income variation over a person's life is called a. the earned income cycle. b. the substitution effect. c. the life cycle. d. the pattern of change. ANS: C DIF: 1 REF: 20-1 NAT: Analytic LOC: Efficiency and equity TOP: Economic life cycle MSC: Definitional 102. A family's ability to buy goods and services depends largely on its a. in-kind transfers. b. annual income. c. transitory income. d. permanent income. ANS: D DIF: 1 REF: 20-1 NAT: Analytic LOC: Efficiency and equity TOP: Economic life cycle MSC: Applicative 103. Economists who study economic mobility have found that, if a father earns 20 percent above his generation's average income, his son will most likely earn a. an income equal to his generation's average income. b. 8 percent above his generation's average income. c. 5 percent below his generation's average income. d. 3 percent above his generation's average income. ANS: B DIF: 1 REF: 20-1 NAT: Analytic LOC: Efficiency and equity TOP: Economic mobility MSC: Applicative 104. What percentage of millionaires in the United States are self-made? a. 20 percent b. 40 percent c. 60 percent d. 80 percent ANS: D DIF: 1 REF: 20-1 NAT: Analytic LOC: The study of economics, and definitions of economics TOP: Economic mobility MSC: Definitional 105. Economic mobility in the United States is a. uncommon. Over 50 percent of poor families remain poor for 8 or more years. b. uncommon. Over 75 percent of poor families remain poor for 8 or more years. c. common. Fewer than 3 percent of poor families remain poor for 8 or more years. d. common. Fewer than 1 percent of poor families remain poor for 8 or more years. ANS: C DIF: 2 REF: 20-1 NAT: Analytic LOC: Efficiency and equity TOP: Economic mobility MSC: Applicative
- 32. 98 Chapter 20/Income Inequality and Poverty 106. Economists who study economic mobility have found that the income of a grandfather and his grandson's income are a. not closely related. b. negatively related. c. directly related. d. equal. ANS: A DIF: 1 REF: 20-1 NAT: Analytic LOC: Efficiency and equity TOP: Economic mobility MSC: Interpretive 107. Susan won $2,000 at the blackjack tables on her birthday. Her winnings are an example of a. permanent income. b. life-cycle income. c. transitory income. d. an in-kind transfer. ANS: C DIF: 2 REF: 20-1 NAT: Analytic LOC: Efficiency and equity TOP: Economic life cycle MSC: Applicative 108. Which of the following statements is correct? a. The distribution of annual income accurately reflects the distribution of living standards. b. Permanent incomes are more equally distributed than annual incomes. c. Transitory changes in income generally have a significant impact on a family's standard of living. d. Annual income is more equally distributed than permanent income. ANS: B DIF: 2 REF: 20-1 NAT: Analytic LOC: Efficiency and equity TOP: Economic life cycle MSC: Interpretive 109. Which of the following is correct? a. Incomes tend to be high for young workers. b. Incomes tend to rise sharply at retirement. c. Incomes tend to peak at around age 50. d. Current income is more equally distributed than permanent income. ANS: C DIF: 2 REF: 20-1 NAT: Analytic LOC: Efficiency and equity TOP: Economic life cycle MSC: Analytical 110. The life cycle effect characterizes a lifetime income profile in which income a. tends to follow a seasonal pattern. b. rises as a worker gains maturity and experience. c. rises and falls in conjunction with the business cycle. d. falls during the early years of market activity and peaks at retirement. ANS: B DIF: 2 REF: 20-1 NAT: Analytic LOC: Efficiency and equity TOP: Economic life cycle MSC: Analytical 111. Because people can borrow when they are young, the life cycle theory would suggest that one's standard of living depends on a. lifetime income rather than annual income. b. aggregate income rather than annual personal income. c. annual extended family income rather than annual personal income. d. income averaged across seasons rather than across years. ANS: A DIF: 2 REF: 20-1 NAT: Analytic LOC: Efficiency and equity TOP: Economic life cycle MSC: Analytical
- 33. Chapter 20/Income Inequality and Poverty 99 112. An example of a transitory change in income is the a. annual cost of living adjustment to your salary. b. increase in income that results from a job promotion linked to your education. c. increase in income of California orange growers that results from an orange-killing frost in Florida. d. All of the above are correct. ANS: C DIF: 2 REF: 20-1 NAT: Analytic LOC: Efficiency and equity TOP: Economic life cycle MSC: Applicative 113. Saving and borrowing is indicative of a family that a. is most likely to be poor. b. has a difficult time balancing its standard of living. c. adjusts its standard of living to reflect transitory changes in income. d. is most likely millionaires. ANS: C DIF: 2 REF: 20-1 NAT: Analytic LOC: Efficiency and equity TOP: Economic life cycle MSC: Applicative 114. Suppose that a family saves and borrows to buffer itself against changes in income. These actions relate to which problem in measuring inequality? a. In-kind transfers. b. Negative income tax. c. Transitory versus permanent income. d. Economic mobility. ANS: C DIF: 2 REF: 20-1 NAT: Analytic LOC: Efficiency and equity TOP: Economic life cycle MSC: Interpretive 115. Suppose that young people often borrow and then repay the loans when they are older. These actions relate to which problem in measuring inequality? a. In-kind transfers. b. Economic life cycle. c. Negative income tax. d. Economic mobility. ANS: B DIF: 2 REF: 20-1 NAT: Analytic LOC: Efficiency and equity TOP: Economic life cycle MSC: Analytical 116. Suppose that Family A borrows money when its car breaks down and saves money when the wife receives a holiday bonus from her employer. Suppose that Family B borrows money to buy elaborate birthday presents for the children and spends the husband’s holiday bonus on a vacation to Florida. Which of the following is correct? a. Both Family A and Family B’s spending habits suggest that they base their purchasing decisions on transitory income. b. Family A’s spending habits suggest that it bases its purchasing decisions on transitory income rather than permanent income. Family B’s spending habits suggest that it bases its purchasing decisions on permanent income rather than transitory income. c. Family A’s spending habits suggest that it bases its purchasing decisions on permanent income rather than transitory income. Family B’s spending habits suggest that it bases its purchasing decisions on transitory income rather than permanent income. d. Both Family A and Family B’s spending habits suggest that they base their purchasing decisions on permanent income. ANS: C DIF: 3 REF: 20-1 NAT: Analytic LOC: Efficiency and equity TOP: Economic life cycle MSC: Analytical
- 34. 100 Chapter 20/Income Inequality and Poverty 117. Suppose that Jake and Abby each win $1,000 in a state lottery. Jake spends his winnings on a new television. Abby saves her winnings for a “rainy day.” Which of the following is correct? a. Both Jake and Abby’s behaviors suggest that they base their purchasing decisions on transitory income. b. Jake’s behavior suggests that he bases his purchasing decisions on transitory income rather than permanent income. Abby’s behavior suggest that she bases her purchasing decisions on permanent income rather than transitory income. c. Jake’s behavior suggests that he bases his purchasing decisions on permanent income rather than transitory income. Abby’s behavior suggests that she bases her purchasing decisions on transitory income rather than permanent income. d. Both Jake and Abby’s behaviors suggest that they base their purchasing decisions on permanent income. ANS: B DIF: 3 REF: 20-1 NAT: Analytic LOC: Efficiency and equity TOP: Economic life cycle MSC: Analytical 118. Which of the following statements is not correct? a. The percentage of the population that suffers from long-term poverty is far smaller than the percentage of the population that suffers from short-term poverty because there is a high level of economic mobility in the United States. b. Permanent income is a better measure of a family's ability to buy the necessities of life than is transitory income. c. The economic life cycle theory explains why gifts of goods and services reduce poverty for the very young and the very old. d. Because people can borrow and save to smooth out changes in income, their standard of living in any one year depends more on lifetime income than on a particular year's income. ANS: C DIF: 3 REF: 20-1 NAT: Analytic LOC: Efficiency and equity TOP: Economic life cycle | Economic mobility MSC: Analytical 119. What percent of families are poor for eight or more years? a. More than 20 percent. b. Between 15 and 20 percent. c. Approximately 10 percent. d. Less than 3 percent. ANS: D DIF: 1 REF: 20-1 NAT: Analytic LOC: Efficiency and equity TOP: Economic mobility MSC: Applicative 120. Data for the United States suggests that about how many millionaires inherited their fortunes? a. One in seven. b. One in five. c. One in three. d. One in two. ANS: B DIF: 1 REF: 20-1 NAT: Analytic LOC: Efficiency and equity TOP: Economic mobility MSC: Applicative 121. Income mobility studies suggest that poverty a. cannot be alleviated by privately sponsored anti-poverty programs. b. cannot be alleviated by government sponsored anti-poverty programs. c. is a long-term problem for a relatively large number of families. d. is not a long-term problem for most families. ANS: D DIF: 1 REF: 20-1 NAT: Analytic LOC: Efficiency and equity TOP: Economic mobility MSC: Applicative
- 35. Chapter 20/Income Inequality and Poverty 101 122. Economic mobility in the United States is so great that fewer than a. 3 percent of families are poor for 8 or more years. b. 5 percent of families are poor for 8 or more years. c. 8 percent of families are poor for 8 or more years. d. 10 percent of families are poor for 8 or more years. ANS: A DIF: 1 REF: 20-1 NAT: Analytic LOC: Efficiency and equity TOP: Economic mobility MSC: Applicative 123. Economic mobility refers to the a. government's attempt to distribute monetary assistance to areas most in need. b. ability of families to freely relocate to find good jobs. c. movement of people among income classes. d. movement of resources from one country to another. ANS: C DIF: 2 REF: 20-1 NAT: Analytic LOC: Efficiency and equity TOP: Economic mobility MSC: Definitional 124. In the United States approximately 80 percent of millionaires did not inherit their wealth. This statement is an example of a. transitory income. b. the effectiveness of government anti-poverty programs. c. economic mobility. d. permanent income. ANS: C DIF: 2 REF: 20-1 NAT: Analytic LOC: Efficiency and equity TOP: Economic mobility MSC: Analytical 125. Which of the following statements is correct? a. Less than three percent of families are categorized as poor for eight years or more. b. In the United States, the grandson of a millionaire is much more likely to be rich than the grandson of an average-income person. c. The majority of millionaires in the United States inherited their wealth. d. Most workers have about the same income (adjusted for inflation) when they are young as when they are middle-aged. ANS: A DIF: 2 REF: 20-1 NAT: Analytic LOC: Efficiency and equity TOP: Economic mobility MSC: Analytical 126. Which of the following does not explain why data on income distribution and the poverty rate give an incomplete picture of inequality? a. in-kind transfers b. economic life cycle c. transitory income d. All of the above contribute to an incomplete picture of inequality. ANS: D DIF: 3 REF: 20-1 NAT: Analytic LOC: Efficiency and equity TOP: Economic mobility MSC: Analytical 127. Which of the following statements is correct? a. The United States has a more equal distribution of income than other developed countries such as Japan and Germany. b. The statement “a rising tide lifts all boats” illustrates how economic growth reduces the number of people with income levels below the poverty line. c. The economic life cycle explains why people base spending decisions on transitory income. d. The libertarian political philosophy follows the maximin criterion.
- 36. 102 Chapter 20/Income Inequality and Poverty ANS: B DIF: 3 REF: 20-1 | 20-2 | 20-3 NAT: Analytic LOC: Efficiency and equity TOP: Income inequality | Poverty level | Economic life cycle | Liberalism MSC: Analytical 128. When considering a person’s standard of living, data on the income distribution and the poverty rate may provide an incomplete picture because the poor may a. receive in-kind transfers. b. be lending in order to smooth their income over their life cycle. c. be saving in order to smooth their income due to a drop in transitory income. d. under-report their income. ANS: A DIF: 2 REF: 20-1 NAT: Analytic LOC: Efficiency and equity TOP: In-kind transfers, Economic life cycle MSC: Applicative Sec 02--Income Inequality and Poverty The political philosophy of redistributing income MULTIPLE CHOICE 1. Whether or not policymakers should try to make our society more egalitarian is largely a matter of a. economic efficiency. b. political philosophy. c. egalitarian principles. d. enhanced opportunity. ANS: B DIF: 2 REF: 20-2 NAT: Analytic LOC: The role of government TOP: Income redistribution MSC: Interpretive 2. Which political philosophy believes that the government should equalize the incomes of all members of society? a. Utilitarianism. b. Liberalism. c. Libertarianism. d. None of the above is correct. ANS: D DIF: 2 REF: 20-2 NAT: Analytic LOC: The role of government TOP: Income redistribution MSC: Interpretive 3. When the government taxes income as part of a redistribution program, a. the poor pay higher taxes. b. the rich always benefit more than the poor. c. the poor are encouraged to work. d. incentives to earn income are diminished. ANS: D DIF: 2 REF: 20-2 NAT: Analytic LOC: The role of government TOP: Income redistribution MSC: Interpretive 4. When incentives to earn income are distorted by income redistribution programs, a. losses can exceed potential gains from greater equality of income. b. total income in an economy can fall. c. total utility in society can fall. d. All of the above are correct. ANS: D DIF: 2 REF: 20-2 NAT: Analytic LOC: Efficiency and equity TOP: Income redistribution MSC: Interpretive
- 37. Chapter 20/Income Inequality and Poverty 103 5. Which of the following will not occur when government policies are enacted to make the distribution of income more equitable? a. People will alter their behaviors. b. Incentives will be distorted. c. Total utility will remain constant. d. The allocation of resources will be less efficient . ANS: C DIF: 2 REF: 20-2 NAT: Analytic LOC: The role of government TOP: Income redistribution MSC: Analytical 6. As a result of the trade-off between income equality and incentives to work, an optimal redistribution policy a. can never be funded through taxes on labor income. b. must always achieve a full egalitarian society. c. only benefits the middle class. d. always falls short of a fully egalitarian society. ANS: D DIF: 3 REF: 20-2 NAT: Analytic LOC: Efficiency and equity TOP: Income redistribution MSC: Analytical 7. Which group would be the least upset by wide variation in the income distribution? a. Utilitarians. b. Liberals. c. Libertarians. d. Each group would be equally upset. ANS: C DIF: 3 REF: 20-2 NAT: Analytic LOC: The role of government TOP: Income redistribution MSC: Analytical 8. Which group (or groups) would be the most upset by wide variation in the income distribution? a. Utilitarians b. Utilitarians and liberals. c. Libertarians. d. Liberals and Libertarians. ANS: B DIF: 3 REF: 20-2 NAT: Analytic LOC: The role of government TOP: Income redistribution MSC: Analytical 9. Which of the following programs would be opposed by philosopher John Rawls? a. A negative income tax. b. The Supplemental Security Income (SSI) program. c. A tax plan creating a perfectly egalatarian income distribution. d. Rawls would oppose all of the programs. ANS: C DIF: 3 REF: 20-2 | 20-3 NAT: Analytic LOC: The role of government TOP: Income redistribution | Liberalism MSC: Analytical 10. When designing public policies, which income group would philosopher John Rawls argue needs the most attention? a. Individuals located in the bottom fifth of the income distribution. b. Individuals located at the average income level.. c. Individuals located in the top fifth of the income distribution. d. Individuals located in the top five percent of the income distribution. ANS: A DIF: 2 REF: 20-2 | 20-3 NAT: Analytic LOC: The role of government TOP: Income redistribution | Liberalism MSC: Analytical
- 38. 104 Chapter 20/Income Inequality and Poverty 11. Which of the following programs to alleviate poverty would be most favored by philosopher Robert Nozick and why? a. A negative income tax because it would maximize the minimum income of members of society. b. An Earned Income Tax Credit (EITC) because a policy that rewards the working poor would be the most just. c. An in-kind transfer program because it would maximize the total utility of all members of society. d. None of the programs would be favored because each of them forcibly redistributes income that was fairly, if not equally, earned. ANS: D DIF: 3 REF: 20-2 | 20-3 NAT: Analytic LOC: The role of government TOP: Income redistribution | Libertarianism MSC: Analytical 12. Which of the following programs to alleviate poverty would be most favored by philosopher Robert Nozick? a. A negative income tax. b. An Earned Income Tax Credit (EITC). c. An in-kind transfer program. d. None of the programs would be favored. ANS: D DIF: 3 REF: 20-2 | 20-3 NAT: Analytic LOC: The role of government TOP: Income redistribution | Libertarianism MSC: Analytical Scenario 20-1 Suppose that a society is made up of five families whose incomes are as follows: $120,000; $90,000; $30,000; $30,000; and $18,000. The federal government is considering two potential income tax plans: Plan A is a negative income tax plan where the taxes owed equal 1/3 of income minus $20,000. Plan B is a two-tiered plan where the poverty line is $35,000; families earning over $35,000 pay 10% of their income in taxes, and families earning less than $35,000 pay no income tax. 13. Refer to Scenario 20-1. Assuming that utility is directly proportional to the cash value of after-tax income, which government policy would an advocate of utilitarianism prefer? a. Plan A b. Plan B c. either Plan A or Plan B d. neither Plan A nor Plan B because any plan that forcibly redistributes income is against the philosophy ANS: A DIF: 3 REF: 20-2 | 20-3 NAT: Analytic LOC: The role of government TOP: Income redistribution | Utilitarianism MSC: Analytical 14. Refer to Scenario 20-1. Assuming that utility is directly proportional to the cash value of after-tax income, which government policy would an advocate of liberalism prefer? a. Plan A b. Plan B c. either Plan A or Plan B d. neither Plan A nor Plan B because any plan that forcibly redistributes income is against the philosophy ANS: A DIF: 3 REF: 20-2 | 20-3 NAT: Analytic LOC: The role of government TOP: Income redistribution | Liberalism MSC: Analytical 15. Refer to Scenario 20-1. Assuming that utility is directly proportional to the cash value of after-tax income, which government policy would an advocate of libertarianism prefer? a. Plan A b. Plan B c. either Plan A or Plan B d. neither Plan A nor Plan B because any plan that forcibly redistributes income is against the philosophy
- 39. Chapter 20/Income Inequality and Poverty 105 ANS: D DIF: 3 REF: 20-2 | 20-3 NAT: Analytic LOC: The role of government TOP: Income redistribution | Libertarianism MSC: Analytical 16. Raising total utility is the prime objective of which political philosophy? a. Utilitarianism. b. Liberalism. c. Libertarianism. d. None of the above is correct. ANS: A DIF: 1 REF: 20-2 NAT: Analytic LOC: Efficiency and equity TOP: Utilitarianism MSC: Interpretive 17. “The government should choose policies to maximize the total utility of society.” This statement is most closely associated with which political philosophy? a. Liberalism. b. Utilitarianism. c. Libertarianism. d. Welfarism. ANS: B DIF: 1 REF: 20-2 NAT: Analytic LOC: The role of government TOP: Utilitarianism MSC: Definitional 18. Utilitarianism is a. a liberal religion that focuses on individual rights. b. a political philosophy that believes the government should choose policies deemed to be just by an impartial observer. c. a political philosophy that believes the government should not redistribute income. d. a political philosophy that believes the government should choose policies to maximize the total utility of society. ANS: D DIF: 1 REF: 20-2 NAT: Analytic LOC: Efficiency and equity TOP: Utilitarianism MSC: Definitional 19. According to a utilitarian, total social utility will be maximized when marginal dollars are distributed to the people with the a. lowest marginal utility of income. b. highest marginal utility of income. c. highest total utility from their income. d. most productive labor resources. ANS: B DIF: 1 REF: 20-2 NAT: Analytic LOC: The role of government TOP: Utilitarianism MSC: Definitional 20. The founders of utilitarianism include a. A. C. Pigou and John Maynard Keynes. b. Jeremy Bentham and John Stuart Mill. c. Augustin Cournot and Jean B. Say. d. A. Kondratieff and Thomas Malthus. ANS: B DIF: 1 REF: 20-2 NAT: Analytic LOC: Efficiency and equity TOP: Utilitarianism MSC: Applicative 21. Which of the following statements is characteristic of utilitarianism? a. An extra dollar of income provides higher marginal utility to a poor person than to a rich person. b. Social policies should be created behind a veil of ignorance. c. Society should strive to maximize the utility of its wealthiest member. d. Equality of opportunity is more important than equality of incomes.
- 40. 106 Chapter 20/Income Inequality and Poverty ANS: A DIF: 2 REF: 20-2 NAT: Analytic LOC: Efficiency and equity TOP: Utilitarianism MSC: Interpretive 22. According to utilitarians, the ultimate objective of public actions should be to a. enhance the income of the rich. b. ensure an egalitarian distribution of income. c. maximize the sum of individual utility. d. provide for the betterment of the poor. ANS: C DIF: 2 REF: 20-2 NAT: Analytic LOC: The role of government TOP: Utilitarianism MSC: Interpretive 23. The concept of utility is fundamental to utilitarianism and describes the a. optimal distribution of wealth in society. b. level of satisfaction derived from a person's circumstances. c. method by which society chooses to allocate resources. d. method whereby wealth is stored. ANS: B DIF: 2 REF: 20-2 NAT: Analytic LOC: Utility and consumer choice TOP: Utilitarianism MSC: Interpretive 24. The utilitarian case for redistributing income is based on the assumption of a. collective consensus. b. a notion of fairness engendered by equality. c. diminishing marginal utility. d. rising marginal utility. ANS: C DIF: 1 REF: 20-2 NAT: Analytic LOC: The role of government TOP: Diminishing marginal utility | Utilitarianism MSC: Interpretive 25. The concept of diminishing marginal utility is embedded in the utilitarian rationale for a. trickle-down effects. b. enhancing market efficiency. c. redistributing income. d. maintaining the status quo income distribution. ANS: C DIF: 2 REF: 20-2 NAT: Analytic LOC: The role of government TOP: Diminishing marginal utility | Utilitarianism MSC: Interpretive 26. Diminishing marginal utility suggests that a. more is always preferred to less. b. the well-being of society is maximized when the distribution of income is equal. c. the poor are less efficient at spending money than the rich. d. the poor receive more satisfaction from the last dollar spent than the rich. ANS: D DIF: 2 REF: 20-2 NAT: Analytic LOC: Efficiency and equity TOP: Diminishing marginal utility | Utilitarianism MSC: Interpretive 27. Which of the following statements illustrates diminishing marginal utility? a. An extra dollar of income to a poor person provides that person with more additional utility than does an extra dollar to a rich person. b. An extra dollar of income to a poor person provides that person with less additional utility than does an extra dollar to a rich person. c. An extra dollar of income to a poor person provides that person with the same additional utility as does an extra dollar to a rich person. d. An extra dollar of income to a poor person provides that person with the same total utility as does an extra dollar to a rich person.
- 41. Chapter 20/Income Inequality and Poverty 107 ANS: A DIF: 2 REF: 20-2 NAT: Analytic LOC: Efficiency and equity TOP: Diminishing marginal utility MSC: Definitional 28. Ms. Spring currently earns $100,000 a year, while her junior partner, Mr. Fall, earns $55,000 a year. From the perspective of a utilitarian, if both of their incomes are subject to diminishing marginal utility, taking a dollar from Ms. Spring and giving it to Mr. Fall will a. increase society's total utility. b. lower Ms. Spring's marginal utility of income. c. increase Mr. Fall's marginal utility of income. d. lower society’s total utlity. ANS: A DIF: 2 REF: 20-2 NAT: Analytic LOC: Efficiency and equity TOP: Diminishing marginal utility | Utilitarianism MSC: Analytical 29. An extra dollar of income gives more additional satisfaction to a poor person than to a rich person. This is an important assumption of which political philosophy? a. Utilitarianism. b. Liberalism. c. Libertarianism. d. Republicanism. ANS: A DIF: 2 REF: 20-2 NAT: Analytic LOC: Efficiency and equity TOP: Utilitarianism | Diminishing marginal utility MSC: Interpretive 30. Suppose a society consists of only two people: John and Jane. A utilitarian would say that the proper role of government in this society is to a. equalize the incomes of John and Jane. b. equalize John’s utility and Jane’s utility. c. equalize John’s marginal utility and Jane’s marginal utility. d. maximize the sum of John’s utility and Jane’s utility. ANS: D DIF: 2 REF: 20-2 NAT: Analytic LOC: The role of government TOP: Utility MSC: Interpretive 31. A society consists of three individuals: Arthur, Billie, and Chris. In terms of income and utility, Arthur is currently best-off, Billie ranks in the middle, and Chris is worst-off. Which of the following statements is correct? a. Utilitarianism suggests that government policies should strive to maximize the sum of all three individuals’ utility. b. Liberalism suggests that government policies should strive to maximize the sum of Billie’s utility and Chris’s utility. c. Libertarianism suggests that government policies should strive to maximize Chris’s utility. d. Mobilism suggests that the government policies should strive to make Billie better off than Arthur. ANS: A DIF: 2 REF: 20-2 NAT: Analytic LOC: The role of government TOP: Utility MSC: Interpretive 32. The English philosophers Jeremy Bentham and John Stuart Mill founded the school of thought called a. liberalism. b. libertarianism. c. mobilism. d. utilitarianism. ANS: D DIF: 1 REF: 20-2 NAT: Analytic LOC: The study of economics, and definitions of economics TOP: Economists MSC: Definitional
- 42. 108 Chapter 20/Income Inequality and Poverty 33. Which political philosophy believes in balancing the gains from greater equality against the losses from distorted incentives? a. Utilitarianism. b. Liberalism. c. Libertarianism. d. Secularism. ANS: A DIF: 2 REF: 20-2 NAT: Analytic LOC: The role of government TOP: Utilitarianism MSC: Interpretive 34. In the parable of the leaky bucket, a fundamental problem with government redistribution programs is identified. As long as the government only has leaky buckets at its disposal, a. the costs of welfare programs will exceed the benefits. b. it should not try to reach complete equality in income. c. income equality will be the best policy option. d. equality of economic opportunity will reduce society’s utility. ANS: B DIF: 3 REF: 20-2 NAT: Analytic LOC: The role of government TOP: Utilitarianism MSC: Analytical 35. Suppose that income is subject to constant marginal utility. From a utilitarian perspective, a. some income redistribution from rich to poor would increase social welfare. b. some income redistribution from poor to rich would increase social welfare. c. any income redistribution would probably reduce social welfare. d. any income redistribution would probably increase social welfare. ANS: C DIF: 3 REF: 20-2 NAT: Analytic LOC: Efficiency and equity TOP: Utilitarianism MSC: Analytical 36. Suppose that income is subject to increasing marginal utility. From a utilitarian perspective, a. some income redistribution from rich to poor would increase social welfare. b. some income redistribution from poor to rich would increase social welfare. c. any income redistribution would probably reduce social welfare. d. any income redistribution would probably increase social welfare. ANS: B DIF: 3 REF: 20-2 NAT: Analytic LOC: Efficiency and equity TOP: Utilitarianism MSC: Analytical 37. Liberalism is the political philosophy espoused by a. Robert Nozick. b. John Stuart Mill. c. John Rawls. d. Jeremy Bentham. ANS: C DIF: 1 REF: 20-2 NAT: Analytic LOC: The role of government TOP: Liberalism MSC: Interpretive 38. The maximin criterion is attributed to which political philosophy? a. Utilitarianism. b. Liberalism. c. Libertarianism. d. Repubicanism. ANS: B DIF: 1 REF: 20-2 NAT: Analytic LOC: The role of government TOP: Liberalism MSC: Interpretive
- 43. Chapter 20/Income Inequality and Poverty 109 39. Raising the welfare of the worst-off person in society is an important goal of which political philosophy? a. Utilitarianism. b. Liberalism. c. Libertarianism. d. Secularism. ANS: B DIF: 1 REF: 20-2 NAT: Analytic LOC: The role of government TOP: Liberalism MSC: Interpretive 40. “The government should choose policies deemed to be just, as evaluated by an impartial observer behind a ‘veil of ignorance.’” This statement is most closely associated with which political philosophy? a. Liberalism. b. Utilitarianism. c. Libertarianism. d. Welfarism. ANS: A DIF: 1 REF: 20-2 NAT: Analytic LOC: The role of government TOP: Liberalism MSC: Definitional 41. Suppose that Jamal is moving to a state where personal incomes are distributed randomly. If Jamal believes in liberalism, he would prefer a. an income distribution that is relatively equal. b. that everyone has the same work opportunities and market-determined wage rates. c. that private property be transformed to government property to safeguard people’s incomes. d. less economic assistance to the poor because it distorts the price system. ANS: A DIF: 2 REF: 20-2 NAT: Analytic LOC: The role of government TOP: Liberalism MSC: Analytical 42. The philosopher John Rawls argued that a. people would choose a more equal distribution of income if they had to determine an economic distribution system before knowing their place in it. b. people would choose income inequality to allow the maximum use of their individual talents. c. government has a role to ensure income equality to prevent social unrest. d. people would choose income equality because it is morally right. ANS: A DIF: 2 REF: 20-2 NAT: Analytic LOC: The role of government TOP: Liberalism MSC: Analytical 43. Liberalism is founded on a premise that behind a veil of ignorance, a. justice cannot be agreed upon. b. everyone’s income should be equal. c. everyone would agree to just rules to reallocate income. d. society should maximize the sum of individual utilities. ANS: C DIF: 2 REF: 20-2 NAT: Analytic LOC: Efficiency and equity TOP: Liberalism MSC: Interpretive 44. The maximin criterion for government policies is associated with a. the school of thought called utilitarianism. b. the school of thought called liberalism. c. the school of thought called libertarianism. d. the school of thought called stoicism. ANS: B DIF: 1 REF: 20-2 NAT: Analytic LOC: The role of government TOP: Utility MSC: Interpretive