Cipla is a leading pharmaceutical company in india with a strong and profitable businessmodel
•
6 likes•14,607 views

Cipla is a leading pharmaceutical company in India with over 30 manufacturing plants approved by international regulatory agencies. It has a diversified product portfolio without dependence on any single segment. The company focuses on research and development of new drug delivery systems and medical devices for respiratory medicine. Cipla has a low risk global strategy of partnering with large generic companies and plans to enter specialty segments through partnerships. It enjoys a strong position in the asthma segment. The company faces risks from unfavorable court rulings and increasing raw material costs.

Recommended
More Related Content
What's hot
What's hot (20)
Viewers also liked
Viewers also liked (20)
Similar to Cipla is a leading pharmaceutical company in india with a strong and profitable businessmodel
Similar to Cipla is a leading pharmaceutical company in india with a strong and profitable businessmodel (20)
More from Mayank Gupt
Recently uploaded
Recently uploaded (20)
Cipla is a leading pharmaceutical company in india with a strong and profitable businessmodel
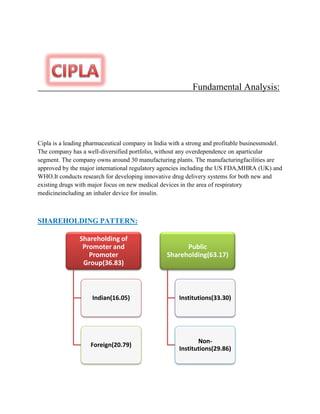
- 1. Fundamental Analysis: Cipla is a leading pharmaceutical company in India with a strong and profitable businessmodel. The company has a well-diversified portfolio, without any overdependence on aparticular segment. The company owns around 30 manufacturing plants. The manufacturingfacilities are approved by the major international regulatory agencies including the US FDA,MHRA (UK) and WHO.It conducts research for developing innovative drug delivery systems for both new and existing drugs with major focus on new medical devices in the area of respiratory medicineincluding an inhaler device for insulin. SHAREHOLDING PATTERN: Shareholding of Promoter and Public Promoter Shareholding(63.17) Group(36.83) Indian(16.05) Institutions(33.30) Non- Foreign(20.79) Institutions(29.86)
- 2. INVESTMENT STRATEGY Low Risk global strategy-Cipla's strategy for its generics business is to enter into bulk drug supply arrangements with companies well entrenched in the generic markets.Cipla has entered into partnerships for 125 products with 8 companies in the US and astrategic alliance to develop over 50 generic products for the generics majorTeva/Ivax. The company thus, intends to enter specialty segments with a low- risk return approach ensuring relatively stable earnings flow. Anti-asthma and anti-HIV focus to augur well: Cipla enjoys a near dominant positionin the asthma segment (about 20% of sales). It is one of the few companies globally having the required technology to manufacture CFC-free inhalers. With CFC inhalersto be compulsorily phased out by 2010, this segment is expected to see growth in thefuture Debt to equity and coverage ratios is favorable to minority equity investors KEY RISKS An unfavourable court ruling in an ongoing litigation between the Government of India and Cipla regarding alleged overcharging of certain drugs could potentially pressurise the Company’s bottom line. If the cost of raw material keep on increasing due to increased pressure on Chinesecompanies to move to higher level drugs, companies margin will be hit drastically. ECONOMIC ACTIVITIES The company is presents: Prescripti on Drugs Technolol Veterinar services y Drugs Bulk OTC Drugs
- 3. The key competitors of the company are: Dr. Reddy’s Labs Lupin Sun Pharma Glaxosmithkline RECENT DEVELOPMENTS On 19th August , 2009 the Delhi High court allowed it to see the generic versionof Bayer’s cancer drug. During April 2009, the USFDA raised 9 deviations in the manufacturing process during inspection of the company’s Bangalore unit. The company has stated that itwould submit it response to the Regulator within the stipulated time period. On theAdcock Ingram- Cipla Medpro issue in South Africa, the company has stated that itwould support its partner (Cipla Medpro) in case of any hostile takeover by Adcock. Cipla Medpro currently contributes around 7% of the company’s Total Exports and there can be risks to this contribution in case of any hostile takeover by Adcock July 2009: Recently ,the Delhi High Court allowed Cipla to manufacture and sellgeneric version of patented lung cancer drug 'Erlotinid' invented by Swiss Pharmacompany Hoffman La Roche Ltd Aug 2009: It also lost Indian government order for Tami flu to Hetero
- 4. FINANCIAL Mar Mar '09 Mar '08 Mar '07 Mar '11 '10 Investment Valuation Ratios Face Value 2.00 2.00 2.00 2.00 2.00 Dividend Per Share 2.80 2.00 2.00 2.00 2.00 Operating Profit Per Share (Rs) 15.96 17.20 16.02 10.96 10.57 Net Operating Profit Per Share (Rs) 78.70 69.82 67.34 54.08 45.83 Free Reserves Per Share (Rs) 80.25 71.54 53.86 46.20 39.52 Bonus in Equity Capital 94.44 94.44 97.55 97.55 97.55 Profitability Ratios Operating Profit Margin(%) 20.27 24.63 23.78 20.27 23.07 Profit Before Interest And Tax Margin(%) 16.41 21.32 20.52 16.90 19.80 Gross Profit Margin(%) 16.65 21.68 20.88 17.16 24.27 Cash Profit Margin(%) 18.25 21.11 21.75 17.85 21.26 Adjusted Cash Margin(%) 18.25 21.11 21.75 17.85 20.30 Net Profit Margin(%) 14.98 18.97 14.58 16.43 18.41 Adjusted Net Profit Margin(%) 14.98 18.97 14.58 16.43 17.45 Return On Capital Employed(%) 16.22 22.16 22.39 18.17 23.40 Return On Net Worth(%) 14.54 18.31 17.89 18.72 20.70
- 5. Adjusted Return on Net Worth(%) 14.25 17.57 23.17 16.85 19.61 Return on Assets Excluding Revaluations 82.25 73.55 55.86 48.20 41.52 Return on Assets Including Revaluations 82.36 73.66 55.97 48.32 41.64 Return on Long Term Funds(%) 17.29 22.16 26.79 18.24 23.45 Liquidity And Solvency Ratios Current Ratio 1.94 2.17 1.81 2.62 2.65 Quick Ratio 1.56 1.57 1.93 1.88 1.76 Debt Equity Ratio 0.07 -- 0.22 0.15 0.04 Long Term Debt Equity Ratio -- -- 0.02 0.15 0.04 Debt Coverage Ratios Interest Cover 222.40 57.08 35.92 67.27 112.84 Total Debt to Owners Fund 0.07 0.00 0.22 0.15 0.04 Financial Charges Coverage Ratio 126.22 52.13 25.56 50.81 79.53 Financial Charges Coverage Ratio Post Tax 110.41 45.05 18.78 47.10 70.12 Management Efficiency Ratios Inventory Turnover Ratio 3.73 4.18 3.79 3.83 3.71 Debtors Turnover Ratio 4.14 3.31 3.24 3.47 3.74 Investments Turnover Ratio 3.73 4.18 3.79 3.83 3.74 Fixed Assets Turnover Ratio 1.61 1.94 1.94 1.91 2.75 Total Assets Turnover Ratio 0.90 0.95 0.99 0.97 1.06 Asset Turnover Ratio 1.61 1.94 1.94 1.91 1.98 Average Raw Material Holding 110.90 113.47 203.30 181.28 200.76 Average Finished Goods Held 43.20 41.38 41.54 37.36 41.94 Number of Days In Working Capital 191.58 190.01 196.07 201.02 179.98 Profit & Loss Account Ratios Material Cost Composition 48.83 47.94 48.01 51.44 49.26 Imported Composition of Raw Materials Consumed 40.63 43.85 42.63 44.03 42.17 Selling Distribution Cost Composi 6.10 5.82 7.17 6.77 6.34 tion Expenses as Composition of Total Sales 54.08 54.54 56.55 53.65 52.36 Cash Flow Indicator Ratios Dividend Payout Ratio Net Profit 27.23 17.31 23.41 25.92 27.22 Dividend Payout Ratio Cash Profit 21.99 15.01 19.58 21.85 23.57 Earning Retention Ratio 72.22 81.97 81.93 71.20 71.28 Cash Earning Retention Ratio 77.65 84.44 84.30 76.14 75.31 AdjustedCash Flow Times 0.38 0.00 0.81 0.76 0.17 Mar Mar '10 Mar '09 Mar '08 Mar '07 '11 Earnings Per Share 11.96 13.47 9.99 9.02 8.59 Book Value 82.25 73.55 55.86 48.20 41.52
- 6. The company’s debt to equity & leverage ratios are very favorable Company has posted phenomenal sales growth over the period of last 3-4 years EPS growth has been very low due to equity dilution during the period of 2006-07 Commenting on the road ahead the company, they are looking at 10% top line andbottom-line growth in FY10, and Operating margins are seen at 23-25% The net sales for the quarter ended march 09 grew by 14% to Rs. 1235 cr this wasmainly driven by strong performance in Domestic market and its Formulationssegment in exports. Others segment (Others include Technology Knowhow/fees andother services) which grew by 225.1% SWOT ANALYSIS STRENGTHS Ranks #2 in the retail prescription market in India; 18 brands that feature among the top-300 brands; Large basket of 1,500 formulations; and Partnered 8 leading generics companies in the US for nearly 125 projects. Cipla has a voluminous productportfolio containing more than 200brands some of which are the leadingbrands in their respective category The company has excellent processR&D skills which are considered to beone of the best in the country The Company has excellent distribution network. WEAKNESSES Impact of IPR regime. It is not present in CRAMS and BioPharmaceutical segment which are thebest projected segment in the industry. OPPORTUNITIES Biotherapeutics – A new and promising area; Agreement with Avesthagen; and Venturing towards areas of cardiology and anti-cancer. THREATS Partnership related; and Potential de-rating.
- 7. STRATEGIC TIE-UPS Subsidiary in Dubai: Cipla has set up a wholly owned subsidiary, Cipla FZE situated at Jebel Ai Free Zone in Dubai, United Arab Emirates. This is the part of strategy to explore the growing markets in middle east countries through exports. It has a research alliance with a Bangalore-based biotech company Avesthagen, to develop biotherapeutic products; Cipla entered agreement with Pentech Pharma of USA for marketing a range of generic products for American market; The first phase of the new formulation plant at Baddi, Himachal Pradesh, for the manufacture of tablets and capsules commenced commercial production in April 2005; and Presence in Africa and Europe. Mayank Gupt 11-MBA-29 11-5941 M.B.A. 3rd Sem.