Beyond Dots on a Map: Spatially Modeled Surfaces of DHS data
•
1 like•1,112 views

This presentation was shared by Clara R. Burgert-Brucker, Pete Gething, Andy Tatem, and Tom Bird, all with The DHS Program, at the June 2016 MEASURE Evaluation GIS Working Group Meeting.

Recommended
Recommended
More Related Content
What's hot
What's hot (20)
Similar to Beyond Dots on a Map: Spatially Modeled Surfaces of DHS data
Similar to Beyond Dots on a Map: Spatially Modeled Surfaces of DHS data (20)
More from MEASURE Evaluation
More from MEASURE Evaluation (20)
Recently uploaded
Recently uploaded (20)
Beyond Dots on a Map: Spatially Modeled Surfaces of DHS data
- 1. MEASURE EVALUATION GIS WORKING GROUP June 2016 1 Beyond Dots on a Map: Spatially Modeled Surfaces of DHS data Clara R. Burgert-Brucker Pete Gething Andy Tatem Tom Bird USAID fundedThe DHS Program ICF International, Oxford University, & University of Southampton
- 2. WAY TOO BIG!STILL TOO BIG!too small! (and not representative) Where are we making health program decisions? Still too small! (Who makes decision at 5 x 5 km squares? Just right?
- 3. Increasing DHS survey sample size to enable increased geographic disaggregation is EXPENSIVE! 3 Challenge Aim Improving the measurement and understanding of local (geographic) patterns to support more decentralized decision making and targeted, efficient program implementation.
- 4. • Selecting Indicators: Not rare event, Spatially distributed, Specific Reference period, No seasonally/temporally related, and Related to the current location of the respondent • Modeled Map Criteria: Use publically available covariate data, standardize and comparable across countries, and produce a corresponding map surface with uncertainty estimates Burgert et al. DHS Spatial Analysis Reports 9. 2014 Spatial Interpolation with DHS Data: Key Considerations (SAR 9)
- 5. Proposed Approach Bayesian Model-based Geostatistics (MBG) Exploits spatial relationships within the data, leverages ancillary information from geospatial covariates, and rigorously handles uncertainties at all stages.
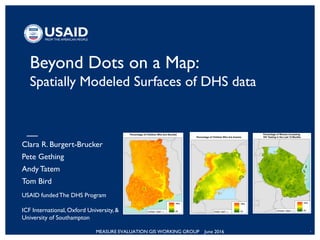
- 6. • Assessment of method for: – Validity, Covariates, Uncertainty, DHS cluster displacement, & Urban areas • Countries: – Tanzania DHS 2010, Uganda DHS 2011, & Ghana DHS 2008 • Indicators: – <5 Anemia, <5 stunting, household access to improved sanitation, & women 15-49 tested for HIV in last 12 months Gething et al. DHS Spatial Analysis Reports 11. 2015 Creating Spatial Interpolation Surfaces with DHS Data (SAR11)
- 9. • Aggregate from 5x5km to administrative units not represented in survey sample – Targeting interventions and development – Where is greatest need? – Where are X,Y, Z, factors present to implement specific course of action? – Compare intervention/non-intervention areas • Linkage with other data – Combine with population data to improve burden estimates – Health Facility data • Overlay for context • CAUTION: Direct extraction of values is misleading & re-aggregation back up to DHS regions or National level may not match DHS data exactly. How might these surfaces be used?
- 10. Aggregated to Districts Aggregated to Livelihoods
- 11. Modeling HIV related variables with survey data • In our pilot, HIV testing was least well predicted modeled surface likely due in part to limited socio-economic covariates • In some countries or areas might be a relatively rare events? • Prospective versus retrospective, locational bias may be stronger for HIV related variables? • Inclusion of multiple data streams?
- 12. • Provide a standard set of spatially modeled map surfaces using DHS data –Routinely create interpolated map surfaces for each population-based survey –Make publically available on DHS Spatial Data Repository (spatialdata.dhsprogram.com) • First round 10 countries, 15 indicators in 9/2016 • Provide guidance on the use and interpretation of spatially modeled map surfaces –Including use cases, Do you have an idea? • Community awareness & sharing –Could you use this in your activities next year? Ongoing Activities
- 14. • Urban mapping: –Predicted with uniform values in models –Reality is urban areas have substantial heterogeneities • Covariate library mostly focused on biophysical data at this time & not demographic or health data that might be stronger drivers of certain types of outcomes –Problem is these would likely be DHS derived Pilot Activity Limitations
- 15. • All models performed reasonably well with relatively low bias & errors • HIV testing was least well modeled indicator • Displacement of GPS locations for confidentiality did not add significant error to models Pilot Activity Results