Strategic Coordination and Integration
•
1 like•663 views

Strategic Coordination and Integration

Recommended
Recommended
More Related Content
What's hot
What's hot (18)
Viewers also liked
Viewers also liked (8)
Similar to Strategic Coordination and Integration
Similar to Strategic Coordination and Integration (20)
More from MEASURE Evaluation
More from MEASURE Evaluation (20)
Recently uploaded
Recently uploaded (20)
Strategic Coordination and Integration
- 1. Strategic coordination and integration (Strengthening multilateral organization) MEASURE GIS Working Group April 27th, 2011
- 2. About the Development Gateway • International non-profit foundation with offices in Washington, DC and Brussels • Created in 2001 by the World Bank • Key donors include Australia, Belgium, EU, Germany, Japan, World Bank, UNDP Our mission is to enable change and reduce poverty in developing countries through the use of information technology. We provide web-based tools to strengthen governance and make aid and development efforts more effective. • Contributor to the Aid Effectiveness Dialogue from the beginning • Rome Declaration on Harmonization • Paris Declaration on Aid Effectiveness • Accra Agenda for Action • International Aid Transparency Initiative • International Board of Directors and Aid Effectiveness Steering Committee (AfDB, OECD, UNDP and World Bank)
- 3. Overview Geo-referencing of foreign aid projects – Benefits – Methodology – Experiences: Mapping for Results Partnership – Next Steps (Globally, Locally) – Demo
- 4. Donor Transparency and Targeting of Need • Track funds at the sub-national level; identify specific locations of projects • Mash up aid flows with other data layers (e.g. poverty maps) to explore aid flows vs. needs in different sectors • Allow researchers, managers, and other stakeholders to examine relationship between aid and other socioeconomic indicators
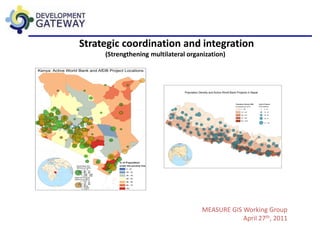
- 5. World Bank Projects in Nepal
- 6. Population Density and Active World Bank Projects
- 7. Poverty and Active World Bank Projects
- 8. Recipient Feedback • Need for on the ground information – Lack of information about outcomes – No mechanism to give recipients a voice in aid • Enable stakeholders to better assess aid performance; enhance dialogue between recipient governments and donors on aid allocation. • Combine with SMS technology to enable crowdsourcing and create feedback loops.
- 9. Donor Coordination • Display activities of multiple donors to inform the geographic coordination and planning process within recipient countries. • Expose spatial financing gaps and disadvantaged areas not targeted by donor community. • Combine with sub-national socioeconomic indicators to facilitate country aid and budgeting planning.
- 11. Leveraging Geo-Referenced Data to Make Aid Better • Improves quality of aid information • Increases transparency in the aid process • Enhances accountability • Combines with other project information (sectoral, commitment amount, closing dates, etc.) to provide complete geographic country aid portfolio.
- 13. Geo-Coding and AidData • Methodology for geo-coding project data at the sub-national level • Developed by AidData with Uppsala University, Sweden – Standardized. Allows for standardization and precision across donors – High quality. Double coding and arbitration by experienced BYU professors; specialized software to enable accurate coding and arbitration – Expert team with research assistants trained in coding methodology – Mashable. Data can be used by any Geographic Information provider (e.g. ESRI, FortiusOne, etc.) and can then be overlayed with other layers
- 14. Geo-coding World Bank IDA • World Bank Mapping for Results Partnership – Team of 10-15 geo-coders and 1-2 arbitrators, 12-14 weeks – Geo-coders geo-tagged all active World Bank IDA projects for the Spring Meetings. – Team is now creating visualizations: • Enabling users to see where aid is directed, identify gaps, and improve planning and coordination
- 15. Next Steps • Combining geo-coded data with SMS crowdsourcing technology (UNICEF, Ushahidi, WB) • Increasing availability and granularity of sub-national needs indicators (i.e. DHS, AICD, UCDP) • Geo-referencing larger subset of donor community to improve coordination
- 16. Next Steps • Geo-referencing historic projects to examine trends and assess aid effectiveness, Health, Education, etc. • Coding at multiple points in the funding process (planning, budget implementation, assessment) • Geo-enable local Aid Management Platforms/Custom AidData portals (Disaster, Climate Change, Health) – AMP Liberia • Increasing accessibility through mobile phone applications