
Recommended
More Related Content
What's hot
What's hot (20)
Similar to Corporate Venture Capital Investment Analysis 1995-2008
Similar to Corporate Venture Capital Investment Analysis 1995-2008 (20)
More from mensa25
More from mensa25 (20)
Recently uploaded
Recently uploaded (20)
Corporate Venture Capital Investment Analysis 1995-2008
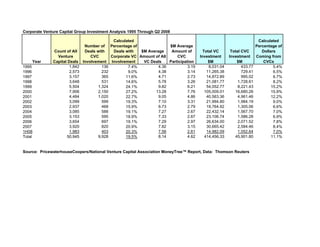
- 1. Corporate Venture Capital Group Investment Analysis 1995 Through Q2 2008 Year Count of All Venture Capital Deals Number of Deals with CVC Involvement Calculated Percentage of Deals with Corporate VC Involvement $M Average Amount of All VC Deals $M Average Amount of CVC Participation Total VC Investment $M Total CVC Investment $M Calculated Percentage of Dollars Coming from CVCs 1995 1,842 136 7.4% 4.36 3.19 8,031.04 433.77 5.4% 1996 2,573 232 9.0% 4.38 3.14 11,265.38 729.41 6.5% 1997 3,157 365 11.6% 4.71 2.73 14,872.89 995.02 6.7% 1998 3,648 531 14.6% 5.78 3.26 21,081.77 1,728.61 8.2% 1999 5,504 1,324 24.1% 9.82 6.21 54,052.77 8,221.43 15.2% 2000 7,906 2,150 27.2% 13.28 7.76 105,009.01 16,680.26 15.9% 2001 4,484 1,020 22.7% 9.05 4.86 40,563.36 4,961.46 12.2% 2002 3,099 599 19.3% 7.10 3.31 21,994.80 1,984.19 9.0% 2003 2,937 468 15.9% 6.73 2.79 19,764.92 1,305.06 6.6% 2004 3,085 588 19.1% 7.27 2.67 22,432.14 1,567.70 7.0% 2005 3,153 595 18.9% 7.33 2.67 23,106.74 1,586.28 6.9% 2006 3,654 697 19.1% 7.29 2.97 26,634.00 2,071.52 7.8% 2007 3,920 820 20.9% 7.82 3.15 30,665.42 2,584.46 8.4% 1H08 1,983 403 20.3% 7.56 2.61 14,982.09 1,052.64 7.0% Total 50,945 9,928 19.5% 8.14 4.62 414,456.33 45,901.80 11.1% Source: PricewaterhouseCoopers/National Venture Capital Association MoneyTree™ Report, Data: Thomson Reuters
- 2. Corporate Venture Capital Group Investment Analysis Quarter Count of All Venture Capital Deals Number of Deals with CVC Involvement Calculated Percentage of Deals with Corporate VC Involvement $M Average Amount of VC Deal $M Average Amount of CVC Participation Total VC Investment $M Total CVC Investment $M Calculated Percentage of Dollars Coming from CVCs 1995-1 497 32 6.4% 3.43 1.99 1,704.47 63.78 3.7% 1995-2 455 38 8.4% 5.61 3.48 2,552.53 132.20 5.2% 1995-3 423 36 8.5% 4.05 3.36 1,712.70 121.08 7.1% 1995-4 467 30 6.4% 4.41 3.89 2,061.34 116.70 5.7% 1996-1 573 34 5.9% 4.21 2.96 2,412.66 100.63 4.2% 1996-2 656 81 12.3% 4.74 2.92 3,106.57 236.42 7.6% 1996-3 587 56 9.5% 4.35 3.14 2,556.06 175.63 6.9% 1996-4 757 61 8.1% 4.21 3.55 3,190.09 216.73 6.8% 1997-1 759 82 10.8% 4.01 2.14 3,047.37 175.41 5.8% 1997-2 761 83 10.9% 4.83 3.55 3,675.84 294.50 8.0% 1997-3 742 89 12.0% 4.95 2.98 3,669.90 265.05 7.2% 1997-4 895 111 12.4% 5.01 2.34 4,479.78 260.06 5.8% 1998-1 846 140 16.5% 4.86 3.43 4,113.60 480.25 11.7% 1998-2 900 119 13.2% 6.28 3.27 5,652.69 389.58 6.9% 1998-3 912 140 15.4% 5.83 2.61 5,321.26 365.76 6.9% 1998-4 990 132 13.3% 6.05 3.74 5,994.22 493.03 8.2% 1999-1 915 167 18.3% 7.22 5.30 6,609.36 885.08 13.4% 1999-2 1305 274 21.0% 8.42 5.34 10,993.99 1,462.87 13.3% 1999-3 1421 354 24.9% 9.24 7.06 13,130.68 2,498.35 19.0% 1999-4 1863 529 28.4% 12.52 6.38 23,318.74 3,375.13 14.5% 2000-1 2128 617 29.0% 13.31 7.87 28,326.83 4,858.14 17.2% 2000-2 2106 543 25.8% 13.36 8.37 28,132.29 4,546.37 16.2% 2000-3 1929 536 27.8% 13.69 7.60 26,401.75 4,074.07 15.4% 2000-4 1743 454 26.0% 12.71 7.05 22,148.14 3,201.68 14.5% 2001-1 1283 302 23.5% 9.95 6.35 12,765.34 1,916.37 15.0% 2001-2 1217 280 23.0% 9.38 4.67 11,415.01 1,308.24 11.5% 2001-3 1005 228 22.7% 8.28 3.85 8,318.34 876.74 10.5% 2001-4 979 210 21.5% 8.24 4.10 8,064.67 860.11 10.7% 2002-1 840 169 20.1% 8.22 4.64 6,906.37 783.37 11.3% 2002-2 851 175 20.6% 7.08 3.09 6,026.20 541.62 9.0% 2002-3 690 110 15.9% 6.60 2.41 4,555.24 264.98 5.8% 2002-4 718 145 20.2% 6.28 2.72 4,506.99 394.23 8.7% 2003-1 699 114 16.3% 6.19 3.14 4,329.52 358.32 8.3% 2003-2 740 111 15.0% 6.69 2.76 4,951.61 306.77 6.2% 2003-3 714 111 15.5% 6.82 2.35 4,866.61 260.33 5.3% 2003-4 784 132 16.8% 7.16 2.88 5,617.18 379.65 6.8% 2004-1 712 153 21.5% 7.41 2.86 5,276.52 437.12 8.3% 2004-2 845 146 17.3% 7.41 2.65 6,257.64 386.28 6.2% 2004-3 690 115 16.7% 7.22 3.05 4,979.84 351.11 7.1% 2004-4 838 174 20.8% 7.06 2.26 5,918.13 393.19 6.6% 2005-1 732 129 17.6% 6.95 2.60 5,090.17 334.80 6.6% 2005-2 824 162 19.7% 7.72 2.29 6,357.32 371.05 5.8% 2005-3 789 142 18.0% 7.48 3.31 5,901.18 469.35 8.0% 2005-4 808 162 20.0% 7.13 2.54 5,758.07 411.08 7.1% 2006-1 872 175 20.1% 7.36 2.53 6,422.03 442.45 6.9% 2006-2 945 184 19.5% 7.51 3.20 7,095.26 589.12 8.3% 2006-3 904 184 20.4% 7.47 2.93 6,750.61 539.96 8.0% 2006-4 933 154 16.5% 6.82 3.25 6,366.10 499.99 7.9% 2007-1 862 174 20.2% 8.66 3.66 7,462.32 637.02 8.5% 2007-2 1033 220 21.3% 7.10 3.14 7,337.46 691.09 9.4% 2007-3 978 204 20.9% 7.96 3.12 7,784.03 636.86 8.2% 2007-4 1047 222 21.2% 7.72 2.79 8,081.61 619.49 7.7% 2008-1 979 198 20.2% 7.67 2.63 7,504.38 520.00 6.9% 2008-2 1004 205 20.4% 7.45 2.60 7,477.71 532.64 7.1% Total 50945 9928 19.5% 8.14 4.62 414,456.33 45,901.80 11.1% Source: PricewaterhouseCoopers/National Venture Capital Association MoneyTree™ Report, Data: Thomson Reuters
- 3. Corporate Venture Capital Group Investment Analysis 1995 Through Q2 2008 7/1/2007 to 6/30/2008 7/1/2007 to 6/30/2008 7/1/2003 to 6/30/2004 7/1/2003 to 6/30/2004 CVC All VC CVC All VC Sector % of Inv % of Inv % of Inv % of Inv Information Technology 52.65 52.31 59.06 61.60 Medical/Health/Life Science 26.36 28.49 37.75 29.06 Non-High Technology 20.99 19.20 3.19 9.34 Total 100.00 100.00 100.00 100.00 Source: PricewaterhouseCoopers/National Venture Capital Association MoneyTree™ Report, Data: Thomson Reuters
- 4. Corporate Venture Capital Group Investment Analysis 1995 Through Q2 2008 Year Total CVC Investment $M Total CVC Investment in Clean Tech $M Calculated Percentage of Clean Tech Dollars Coming from CVCs 1995 433.77 0.00 0.0% 1996 729.41 0.00 0.0% 1997 995.02 0.00 0.0% 1998 1,728.61 6.01 0.3% 1999 8,221.43 23.84 0.3% 2000 16,680.26 68.03 0.4% 2001 4,961.46 65.11 1.3% 2002 1,984.19 60.28 3.0% 2003 1,305.06 16.82 1.3% 2004 1,567.70 47.55 3.0% 2005 1,586.28 39.45 2.5% 2006 2,071.52 167.70 8.1% 2007 2,584.46 357.27 13.8% 1H08 1,052.64 116.58 11.1% Total 45,901.80 968.64 2.1% Source: PricewaterhouseCoopers/National Venture Capital Association MoneyTree™ Report, Data: Thomson Reuters