Mobile Search Spending Rising Fast in the US
•
1 like•915 views

Us mobile search e frontier

Recommended
Recommended
More Related Content
Similar to Mobile Search Spending Rising Fast in the US
Similar to Mobile Search Spending Rising Fast in the US (20)
More from Marketingfacts
More from Marketingfacts (20)
Mobile Search Spending Rising Fast in the US
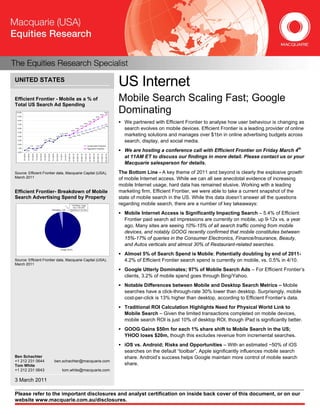
- 1. UNITED STATES US Internet Efficient Frontier - Mobile as a % of Total US Search Ad Spending Mobile Search Scaling Fast; Google 10.0% 9.0% 8.4% 8.9% 9.5% Dominating 7.8% 8.0% 7.0% 6.6% 7.2% We partnered with Efficient Frontier to analyse how user behaviour is changing as 6.1% 7.0% 6.0% 4.9% 5.5% 5.8% 6.1% 6.4% 6.7% search evolves on mobile devices. Efficient Frontier is a leading provider of online 5.0% 5.5% 4.0% 3.5% 4.1% 4.2% 4.3% 4.6% 4.9% 5.2% marketing solutions and manages over $1bn in online advertising budgets across 2.9% 3.0% 2.5% 2.6% search, display, and social media. 2.0% 1.2% 1.1% 1.0% Conservative Projection We are hosting a conference call with Efficient Frontier on Friday March 4th 1.0% Aggressive Projection 0.5% 0.9% 0.0% 3/1/2011E 4/1/2011E 5/1/2011E 6/1/2011E 7/1/2011E 8/1/2011E 9/1/2011E 10/1/2011E 11/1/2011E 12/1/2011E 4/1/2010 5/1/2010 6/1/2010 7/1/2010 8/1/2010 9/1/2010 10/1/2010 11/1/2010 12/1/2010 1/1/2011 2/1/2011 at 11AM ET to discuss our findings in more detail. Please contact us or your Macquarie salesperson for details. Source: Efficient Frontier data, Macquarie Capital (USA), The Bottom Line - A key theme of 2011 and beyond is clearly the explosive growth March 2011 of mobile Internet access. While we can all see anecdotal evidence of increasing mobile Internet usage, hard data has remained elusive. Working with a leading Efficient Frontier- Breakdown of Mobile marketing firm, Efficient Frontier, we were able to take a current snapshot of the Search Advertising Spend by Property state of mobile search in the US. While this data doesn’t answer all the questions YHOO/Bing: ranges regarding mobile search, there are a number of key takeaways: from 1.5%-6.5% YHOO/Bing, 3.2% depending on the client Mobile Internet Access is Significantly Impacting Search – 5.4% of Efficient Frontier paid search ad impressions are currently on mobile, up 9-12x vs. a year ago. Many sites are seeing 10%-15% of all search traffic coming from mobile devices, and notably GOOG recently confirmed that mobile constitutes between 15%-17% of queries in the Consumer Electronics, Finance/Insurance, Beauty, and Autos verticals and almost 30% of Restaurant-related searches. Google, 96.8% Almost 5% of Search Spend is Mobile; Potentially doubling by end of 2011- Source: Efficient Frontier data, Macquarie Capital (USA), 4.2% of Efficient Frontier search spend is currently on mobile, vs. 0.5% in 4/10. March 2011 Google Utterly Dominates; 97% of Mobile Search Ads – For Efficient Frontier’s clients, 3.2% of mobile spend goes through Bing/Yahoo. Notable Differences between Mobile and Desktop Search Metrics – Mobile searches have a click-through-rate 30% lower than desktop. Surprisingly, mobile cost-per-click is 13% higher than desktop, according to Efficient Frontier’s data. Traditional ROI Calculation Highlights Need for Physical World Link to Mobile Search – Given the limited transactions completed on mobile devices, mobile search ROI is just 10% of desktop ROI, though iPad is significantly better. GOOG Gains $50m for each 1% share shift to Mobile Search in the US; YHOO loses $20m, though this excludes revenue from incremental searches. iOS vs. Android; Risks and Opportunities – With an estimated ~50% of iOS searches on the default “toolbar”, Apple significantly influences mobile search Ben Schachter share. Android’s success helps Google maintain more control of mobile search +1 212 231 0644 ben.schachter@macquarie.com Tom White share. +1 212 231 0643 tom.white@macquarie.com 3 March 2011 Please refer to the important disclosures and analyst certification on inside back cover of this document, or on our website www.macquarie.com.au/disclosures.
- 2. Macquarie (USA) Research US Internet Overview In this note, we highlight data-points from Efficient Frontier’s analysis of mobile ad spending patterns across its clients, as well as provide some of our key takeaways. When considering the Efficient Frontier data, please keep the following in mind: 1. The data covers US-based mobile search spending only. 2. Efficient Frontier’s market share statistics primarily relate to search advertising spending and advertiser revenue, not queries or total volume of searches. 3. The data referenced in this report is from a sample of Efficient Frontier’s client base, and includes Efficient Frontier’s largest mobile search ad spenders. This may not be reflective of the total search market, particularly in terms of market share figures. Mobile Search Ad Spending Mobile Growing to 7%-10% of Total Search Ad Dollars by end of 2011– Efficient Frontier’s clients currently allocate 4.2% of their total online search advertising budgets, on average, to mobile search. This is up more than seven-fold in less than one year, compared with 0.5% in April 2010. Importantly, we expect this growth to accelerate in 2011 and beyond as more and more mobile devices with full Internet browsers enter the market. By the end of 2011, we estimate that somewhere between 7.0%-9.5% of search advertising dollars could be spent on mobile devices. Fig 1 Efficient Frontier – Mobile as a % of Total US Search Ad Spending (with Projections) 10.0% 9.5% 8.9% 9.0% 8.4% 7.8% 8.0% 7.2% 6.6% 7.0% 6.1% 7.0% 6.0% 5.5% 6.7% 6.4% 4.9% 6.1% 5.8% 5.0% 5.5% 4.1% 4.2% 5.2% 4.9% 4.0% 3.5% 4.6% 4.3% 2.9% 3.0% 2.5% 2.6% 2.0% 1.1% 1.0% 1.2% Conservative Projection 1.0% Aggressive Projection 0.5% 0.9% 0.0% 3/1/2011E 4/1/2011E 5/1/2011E 6/1/2011E 7/1/2011E 8/1/2011E 9/1/2011E 10/1/2011E 11/1/2011E 12/1/2011E 10/1/2010 11/1/2010 12/1/2010 4/1/2010 5/1/2010 6/1/2010 7/1/2010 8/1/2010 9/1/2010 1/1/2011 2/1/2011 Source: Efficient Frontier data, Macquarie Capital (USA), March 2011 In terms of query volumes, Efficient Frontier has anecdotal evidence that some advertisers are already seeing as much as 10%-15% of all Internet search traffic coming from mobile devices today. We expect that percentage will increase over time and see no structural reason why mobile ad spending should not at the very least achieve parity with mobile usage. In fact, Google recently indicated that in certain categories, such as restaurants, almost 30% of queries are coming from mobile devices (other key categories such as Consumer Electronics, Beauty & Personal, Finance/Insurance, and Autos have between 14%-16% mobile queries, per Figure 2 below). 3 March 2011 2
- 3. Macquarie (USA) Research US Internet Fig 2 Google – Percentage of Overall Google Queries that are Mobile (by category) 35% 29.6% 30% 25% 20% 16.8% 15.5% 15.4% 14.9% 15% 10% 5% 0% Re staurants Autos Consume r Finance and Be auty & Pe rsonal Ele ctronics Insurance Source: Google company presentation, Macquarie Capital (USA), March 2011 In addition, below is a selection of recent public statements made by Google that further highlight the ramp in mobile search usage (and Android): 1. Google searches from Android devices grew 10X between Q4 2009 and Q4 2010. 2. Worldwide mobile search experienced a 2.3x growth between Q4 2009 and Q4 2010. Over the past 2 years, we've grown 5x. 3. Mobile search traffic grew 50% in the first half of 2010 4. Mobile searches on devices with full Internet browsers have increased 4x in the past year 5. Every week, tens of millions of people search on Google from their mobile phones and generate hundreds of millions of searches. 6. Google’s mobile search experience is available in 40 different languages, all around the world. Proliferation of Devices Drives Ad Shift to Mobile – We expect marketers to allocate more of their advertising budgets to mobile search over time, but determining the slope of the growth curve poses a challenge. By this point, investors are familiar with the often-cited statistic that Internet ad spending accounts for a much smaller percentage of total advertising expenditures vs. the percentage of media consumption occurring online. Data from YHOO indicates that the Internet accounted for 28% of an average user’s total media consumption last year, but represented just 13% of total advertising spending (the largest delta amongst the four major media types analysed, per Figure 3 below). We agree with the notion that this gap will narrow over time, and see the same dynamic playing out in mobile, i.e: as more and more users get access to smart phones and tablets with full browsers, mobile internet access will continue to ramp. We also note that Google recently estimated that by the end of 2011, 50%+ of Americans will have smart phones. 3 March 2011 3
- 4. Macquarie (USA) Research US Internet Fig 3 Time Spent vs. Ad Spend for Major Media Types (2009) 45% Time Spent 40% 39% Ad Spend 35% 31% 30% 28% 26% - $30bn U.S. 25% opportunity - $50bn Global 20% opportunity 16% 15% 13% 12% 10% 9% 5% 0% Print Radio TV Online Note: Time spent is per NA Technologies (2009); Ad Spend is per VSS (2009 Mid-Term Update); Opportunity is Yahoo! Company Source: Yahoo 2010 Analyst Day Presentation, Macquarie Capital (USA), March 2011 Additive to Volumes, and Eventually Monetization - Another key issue is the extent to which mobile searches will be incremental to desktop search. Figure 4 below from Google highlights the fact that mobile usage patterns indicate meaningful incremental searches are occurring on mobile devices. We have seen data that suggests that the amount of incremental searches may vary widely by verticals; therefore a key question is what type of incremental searches are occurring and can they be monetized effectively. The relatively nascent mobile search ad market paints a somewhat mixed picture in terms of monetization; Efficient Frontier’s data shows CPCs roughly equal to slightly above desktop search, while other studies indicate mobile search monetization is currently lower than desktop. Longer-term, we see potential for mobile search to monetize at higher levels than desktop. One factor driving this will be large advertisers allocating more of their marketing budgets to mobile search. The more meaningful driver in our view however will be the evolution in: mobile-specific pricing models and ad units – such as click-to-call, etc. mobile-specific campaign performance metrics - such as linking real-world store visits/sales to mobile search ads, etc. the value of mobile data – location-aware transaction data, the phone as “digital wallet” etc. Over time, we believe that as advertisers take a more “holistic” view of the ROI from their mobile search campaigns (including the value in the data provided by a location-aware mobile device), CPCs for mobile search may eventually exceed those of desktop searches. 3 March 2011 4
- 5. Macquarie (USA) Research US Internet Fig 4 Google’s Mobile Searches Spike in Periods of Lower Desktop Search Activity Source: Google company presentation, Macquarie Capital (USA), March 2011 Mobile Ad Impressions Lag Usage Patterns – Efficient Frontier’s clients generate 5.4% of their total paid search ad impressions on mobile devices. Given the lower click-through rate for mobile ad campaigns (discussed in more detail below), this 5.4% share of impressions results in the 4.3% share of total search spend on mobile. To reiterate, this does not mean that 5.4% of total searches are mobile, according to the Efficient Frontier data, just that 5.4% of search ad impressions are on mobile devices. Fig 5 Breakdown of Efficient Frontier’s US Paid Search Advertising Impressions Mobile search, 5.4% Desktop search, 94.6% Source: Efficient Frontier data, Macquarie Capital (USA), March 2011 3 March 2011 5
- 6. Macquarie (USA) Research US Internet Mobile Search Campaign Performance Metrics Mobile Cost-per-Click (“CPC”) Varies, but Slightly Above Desktop on Average – Across its advertiser clients, Efficient Frontier found that the average CPC on mobile search campaigns was actually slightly above (13% higher) than CPCs for desktop search campaigns. Given the lower return- on-investment (ROI) generated by mobile ad campaigns (see ROI discussion below), we were very surprised to see higher mobile CPCs. That said, we believe this reflects that mobile is primarily being used as a branding medium for many advertisers at the moment, and that the typical revenue-based definition of ROI is a less scrutinized metric for branding-based campaigns. We also note that Efficient Frontier reported seeing wide variability in CPCs across its individual clients, ranging from as low as 10% of desktop-levels to well above. Importantly, over time, if sales in the physical world can be accurately attributed back to mobile devices, we would expect mobile search CPCs to approach levels seen in desktop for non-local queries and meaningfully exceed desktop CPCs for local searches that lead to an offline sales/visit. The key is that mobile searches need attribution from physical world activity. Lower Click-Through Rate (CTR) for Mobile – Mobile click-through rates for Efficient Frontier’s search advertisers are ~70% of CTRs in desktop search campaigns. This is relatively higher than we might have expected, but it’s important to note that mobile clicks-through result in far fewer “conversions”, at least when “conversion” is defined as an immediate web-based sale (the typically definition used to evaluate desktop search campaigns). Screen sizes and ad formatting also play a very large role in determining CTRs in our view. Given the thousands of devices and various screen sizes, we expect the leading search engines will continue to optimize mobile search for the device. This should lead to improved CTRs over time, as well as the evolution of other performance metrics for mobile campaigns (such as calls made, visits etc.). Fig 6 Efficient Frontier: Comparison of Mobile Search CPC, CTR, and ROI metrics vs. Desktop Search 120% 113% 100% 80% 70% 60% 40% 20% 10% 0% Cost per Click Click-through Rate Return on Investment Note: Indexed Desktop = 100% Source: Efficient Frontier data, Macquarie Capital (USA), March 2011 3 March 2011 6
- 7. Macquarie (USA) Research US Internet Weaker Mobile ROI Based on the Traditional Definition – Lower conversions for mobile search campaigns result in ROI that is 10x below desktop search campaigns according to Efficient Frontier’s data. This is a critical issue that will need to be addressed as mobile growth continues to accelerate. We believe mobile search has attracted primarily brand advertisers at the moment, and that one key potential gating factor to increased mobile ad adoption revolves around how the success of mobile search campaigns is currently evaluated by advertisers. Currently, ROI measurement for mobile search advertising is largely based on the same revenue-based ROI criteria used to evaluate desktop search campaigns. As a result, the ROI statistics for mobile campaigns are often significantly lower than for desktop search campaigns (as evidenced in Efficient Frontier’s data). Until advertisers can more accurately attribute a wider range of “success” events such as offline store visits, offline and (delayed) online sales, and phone calls to a mobile ad campaign, marketers using a traditional ROI-based approach to make campaign budget decisions will be less willing to increase mobile ad budgets. In the meantime, we expect “early adopter” mobile marketers will continue to test mobile as both a performance-based and branding ad medium. As such, we would expect the largest mobile properties/portals (such as GOOG, YHOO, AOL, and other high-profile media sites) to be the early beneficiaries of mobile ad adoption. Google’s Positioning in Mobile Search Google Dominates Spending on Mobile Search – Efficient Frontier clients that currently buy mobile search advertising on both Google and YHOO/Bing spend just 3.2% of their mobile search ad budgets on average on YHOO/Bing (though this ranges from 1.5%-6.5% depending on the client), with ~97% of mobile search ad spending on average going to Google. If we broaden this analysis to include Efficient Frontier’s entire mobile search client sample, only ~1% of mobile search advertising is done on Yahoo/Bing. This is a controversial figure, as Yahoo and Bing almost certainly account for a higher percentage of total mobile search query share. Other statistics that we have seen suggest that Yahoo’s share of mobile search spend may be closer to 3%-5% of the market, although this is still well below their share of desktop search. Fig 7 Efficient Frontier: Breakdown of Mobile Search Advertising Spend by Property YHOO/Bing: ranges from 1.5%-6.5% YHOO/Bing, 3.2% depending on the client Google, 96.8% Note: Percentages based on mobile ad spend for advertisers that currently advertise on both Google and Yahoo/Bing. Across Efficient Frontier’s overall sample, the percentage of mobile search spend on YHOO is approximately 1%. Source: Efficient Frontier data, Macquarie Capital (USA), March 2011 3 March 2011 7
- 8. Macquarie (USA) Research US Internet Quantifying the Potential Opportunity – GOOG’s dominant share of the current mobile search ad market means that it is the most exposed to the increased shift of search usage and search ad budgets to mobile. This leadership position is a positive but also carries some near-term uncertainty. On the positive side, we believe that mobile search queries are net additive to overall search volumes, with GOOG’s data (see Figure 4 discussed above) indicating that mobile queries tend to ramp in periods when desktop searches drop off (for example, during lunchtime, evening, and weekends). In terms of uncertainties, the issue of monetization on mobile devices is still evolving, but, longer-term, we see potential for mobile search monetization to ultimately achieve parity and potentially exceed that of desktop search. Assuming that the US search advertising market is approximately $15bn in 2011 (our projection based on IAB/PwC data), we estimate that each 100 bps of search advertising market share shift to mobile represents an incremental US revenue opportunity for GOOG of ~$50m. This calculation assumes GOOG accounts for ~97% of US mobile search ad revenues and 65%-70% of US desktop search revenues, and notably does not include any benefit from incremental mobile queries. By this same methodology, we estimate that a 100 bps increase in mobile search ad share translates into ~$20m of lost YHOO/Bing revenues. In terms of the incremental impact of mobile usage on the overall search ad industry, we note that even a relatively modest incremental effect from mobile of ~4%-6% could mean the difference between mid-teens and 20%+ overall industry growth over the next couple of years (see sensitivity below). Fig 8 Sensitivity of the Total US Search Advertising Market to Increased Mobile Usage Incremental Effect of Mobile Usuage on U.S. Search Market Revenues 0.0% 2.0% 4.0% 6.0% 8.0% 10.0% 12.0% 14.0% 16.0% 9.0% $14,227 $14,512 $14,797 $15,081 $15,366 $15,650 $15,935 $16,219 $16,504 U.S. Total Search Ad Spending - Y/Y Chg 10.0% $14,358 $14,645 $14,932 $15,219 $15,507 $15,794 $16,081 $16,368 $16,655 11.0% $14,489 $14,778 $15,068 $15,358 $15,648 $15,937 $16,227 $16,517 $16,807 12.0% $14,619 $14,911 $15,204 $15,496 $15,789 $16,081 $16,373 $16,666 $16,958 13.0% $14,750 $15,045 $15,340 $15,635 $15,930 $16,225 $16,520 $16,815 $17,110 14.0% $14,880 $15,178 $15,475 $15,773 $16,071 $16,368 $16,666 $16,963 $17,261 16.0% $15,141 $15,444 $15,747 $16,050 $16,352 $16,655 $16,958 $17,261 $17,564 18.0% $15,402 $15,710 $16,018 $16,326 $16,634 $16,942 $17,250 $17,559 $17,867 20.0% $15,663 $15,977 $16,290 $16,603 $16,916 $17,230 $17,543 $17,856 $18,169 22.0% $15,924 $16,243 $16,561 $16,880 $17,198 $17,517 $17,835 $18,154 $18,472 24.0% $16,185 $16,509 $16,833 $17,157 $17,480 $17,804 $18,128 $18,451 $18,775 Implied 2011E Total U.S. Search Advertising Revenue Growth 18% 20% 22% 19% 21% 23% 21% 23% 25% Note: US$ in millions Source: IAB/PwC, Macquarie Capital (USA), March 2011 Apple’s Power Over the Mobile Search Ecosystem - We’ve seen data that shows that while Google absolutely dominates searches emanating from the iPhone (95%+), ~50% of iPhone Google searches come from the toolbar, 42% from Google’s homepage and less than 10% from Google’s app. This is an absolutely critical point, as it indicates that Apple has significant influence over GOOG’s mobile search share. If Apple were to make Bing the default search provider through its toolbar, Google’s share could be significantly impacted. (We think that this is one of the reasons that Android exists!) 3 March 2011 8
- 9. Macquarie (USA) Research US Internet Fig 9 Origin of Google Queries on the iPhone across the Chitika mobile ad network Google Search mobile app 9% Apple brow ser/toolbar Google.com mobile 49% homepage 42% Source: Chitika Research, Macquarie Capital (USA), March 2011 Additionally, AAPL’s success with iPad and broader distribution of Safari via its PC market share gains is making AAPL’s power to select a default search provider an ever increasing threat to Google. Given Safari’s ~5% browser share and iPhone’s share of mobile, we believe that Apple default search status impacts roughly 3–5% of total searches. In other words, at least 3–5% of Google’s share could be impacted if Apple were to replace Google as the default search provider. Other Questions that We Consider Key to the Discussion of Mobile Search Include: 1. How much is mobile search incremental to desktop search? 2. What is the value of mobile search versus desktop search? 3. What is mobile search query share amongst the key players? 4. What percentage of mobile queries occur on “toolbars/preferred placement” vs. through the Web? 5. What percentage of mobile queries occur on iOS devices? Android? Other? 6. What are the key differences in search usage/behavior between tablets/smart phones/feature phones/desktop? 7. What is the value of potentially tracking physical world actions/transitions back to mobile queries/ads? 8. What is the value of location-based mobile search? 3 March 2011 9
- 10. Macquarie (USA) Research US Internet Fig 10 Rated Companies - Valuation and Risks (prices are intra-day 3/2/2011) Price Rating VALUATION RISKS Our US$37 price target is based primarily on DCF analysis Risks for EBAY include slowdowns in global consumer spending, (assumes 12.3% WACC, 10.3% 10-year revenue CAGR, long- increased competition in eCommerce from companies such as term EBIT margins of 26%–30%, and 2% perpetual growth) and AMZN, Google, Walmart, Sears, Best Buy, and others, changes EBAY $32.77 Neutral is supported by relative multiple and SOTP analysis. Our US$37 in the relatively nascent market for online payments, and target implies a P/E multiple of 19x/16x on our CY’11/CY’12 non- uncertainty surrounding the transition of Media sales to digital GAAP EPS estimates, an EV/EBITDA multiple of 11x/9x, and a goods. FCF multiple of 21x/17x. Price Price VALUATION RISKS Our US$200 price target is based primarily on DCF analysis Risks for AMZN include slowdowns in global consumer (assumes 10.9% WACC, 16.8% 10-year revenue CAGR, long- spending, increased competition from companies such as eBay, term EBIT margins of 5.0%–8.0%, and 2% perpetual growth) Google, Walmart, Best Buy, and others, uncertainty surrounding AMZN $172.70 Outperform and is supported by relative multiple analysis. Our US$200 the transition of Media sales to digital goods, and sales tax target implies a P/E multiple of 67x/49x on our CY’11/CY’12 legislation. In addition, increased investments required to build GAAP EPS estimates, an EV/EBITDA multiple of 28x/20x, and a out emerging growth opportunities in digital media and Amazon FCF multiple of 36x/25x. Web Services could impact margins. Price Price VALUATION RISKS Risks for GOOG include slowdowns in global spending on Our US$725 price target is based primarily on DCF analysis advertising, regulatory/legal risks (including, but not limited to, (assumes 9.4% WACC, 8% 10-year revenue CAGR, long-term issues surrounding user privacy), increased competition from EBIT margins of 49–54%, and 2.5% perpetual growth) and is companies such as Apple, Facebook, Microsoft, and others. GOOG $602.68 Outperform supported by relative multiple analysis. Our US$725 target Disintermediation from key vertically-focused companies, mobile implies a P/E multiple of 21x/19x on our CY’11/CY’12 non-GAAP carriers, mobile OEM's, PC OEM's, and others. Additionally, EPS estimates, an EV/EBITDA multiple of 13x/12x, and a FCF changes in consumer behavior online could negatively impact multiple of 23x/20x. GOOG. Price Price VALUATION RISKS Risks for YHOO include slowdowns in global spending on advertising, developments that impact its investments in Alibaba Our US$18 price target is primarily based on DCF analysis and Yahoo Japan, uncertainty surrounding the integration of the (assumes 9.2% WACC, 2.0% 10-year revenue CAGR, long- MSFT search agreement, regulatory/legal risks (including but not term EBIT margins of 23–27%, and negative 4% perpetual limited to issues surrounding user privacy), increased YHOO $16.68 Neutral growth) and is supported by relative multiple analysis. Our competition from companies, including but not limited to, Apple, US$18 target implies P/E multiples of 21x/20x our 2011/2012 Facebook, and others. Deteriorating search market share. Risks non-GAAP EPS estimates, EV/EBITDA multiples of 13.1x/12.6x associated with the transition to more Internet computing on and FCF multiples of 49x/42x. mobile devices. Additionally, changes in consumer behavior online could negatively impact YHOO. Price Price VALUATION RISKS Risks for AOL include slowdowns in global spending on advertising, continuing declines in its access subscription Our US$26 price target is based primarily on DCF analysis business, difficulties in right-sizing its advertising business for (assumes 10.4% WACC, -2% 10-year revenue CAGR, long- lower revenue levels, risks around the ultimate success and user term EBIT margins of 15%-19%, and 2% perpetual growth) and acceptance of platforms such as Patch, regulatory/legal risks AOL $20.23 Neutral is supported by relative multiple analysis. Our $26 target implies (including but not limited to issues surrounding user privacy), a P/E multiple of 14x/16x our CY’11/CY’12 non-GAAP EPS increased competition from companies, including but not limited estimates, an EV/EBITDA multiple 5x/6x, and a FCF multiple of to Apple, Facebook, and others. Deteriorating search market 12x/17x. share, and risks associated with transition to more Internet computing on mobile devices. Additionally, changes in consumer behavior online could negatively impact AOL. Price Price VALUATION RISKS Risks for GSIC include slowdowns in global consumer spending Our US$32 target is based primarily on DCF (assumes 11.0% and advertising expenditures, uncertainty surrounding GSIC's WACC, 9.1% 10-year revenue CAGR, long-term EBIT margins expansion into International geographies, execution risk related of 5%–8%, and 2.5% perpetual growth) and is supported by to its technology unbundling initiative, increased client churn, and GSIC $19.99 Outperform relative multiple and sum-of-the-parts analysis. Our US$32 increased competition from companies, including but not limited target implies an EV/EBITDA multiple of 11x/9x our 2011/2012 to AMZN, MSFT, IBM, ORCL, and others. Additionally, changes EBITDA estimates and a FCF multiple of 17x/16x our 2011/2012 in consumer behavior online could negatively impact GSIC, FCF estimates. including the transition to more Internet computing on mobile devices. Price Price VALUATION RISKS Risks for VCLK include slowdowns in global consumer spending and advertising expenditures, lack of visibility surrounding VCLK's business model in its Owned & Operated websites Our US$17 price target is based primarily on DCF analysis segment, potential dis-intermediation by emerging technologies (assumes 10.8% WACC, 6.6% 10-year revenue CAGR, long- such as demand-side-platforms and online adverising term EBIT margins of 25%–28%, and 2.5% perpetual growth) exchanges, increased regulatory risk (particulary around VCLK $14.83 Neutral and is supported by relative multiple and sum-of-the-parts consumer privacy online and behaivoural targeting), and analysis. Our US$17 target implies a P/E multiple of 20x/18x on increased competition from companies, including but not limited our CY’11/CY’12 GAAP EPS estimates, an EV/EBITDA multiple to Facebook, Google, AMZN, and others. Additionally, changes of 8x/8x, and a FCF multiple of 14x/12x. in consumer behavior online could negatively impact VCLK including the transition to more Internet computing on mobile devices. Source: FactSet, Macquarie Capital (USA), March 2011 3 March 2011 10
- 11. Macquarie (USA) Research US Internet Important disclosures: Recommendation definitions Volatility index definition* Financial definitions Macquarie - Australia/New Zealand This is calculated from the volatility of historical price All "Adjusted" data items have had the following Outperform – return >3% in excess of benchmark return movements. adjustments made: Neutral – return within 3% of benchmark return Added back: goodwill amortisation, provision for Underperform – return >3% below benchmark return Very high–highest risk – Stock should be expected catastrophe reserves, IFRS derivatives & hedging, IFRS to move up or down 60–100% in a year – investors impairments & IFRS interest expense Benchmark return is determined by long term nominal should be aware this stock is highly speculative. Excluded: non recurring items, asset revals, property GDP growth plus 12 month forward market dividend yield revals, appraisal value uplift, preference dividends & Macquarie – Asia/Europe High – stock should be expected to move up or minority interests Outperform – expected return >+10% down at least 40–60% in a year – investors should Neutral – expected return from -10% to +10% be aware this stock could be speculative. EPS = adjusted net profit / efpowa* Underperform – expected return <-10% ROA = adjusted ebit / average total assets Medium – stock should be expected to move up or ROA Banks/Insurance = adjusted net profit /average Macquarie First South - South Africa down at least 30–40% in a year. total assets Outperform – expected return >+10% ROE = adjusted net profit / average shareholders funds Neutral – expected return from -10% to +10% Low–medium – stock should be expected to move Gross cashflow = adjusted net profit + depreciation Underperform – expected return <-10% up or down at least 25–30% in a year. *equivalent fully paid ordinary weighted average number Macquarie - Canada of shares Outperform – return >5% in excess of benchmark return Low – stock should be expected to move up or Neutral – return within 5% of benchmark return down at least 15–25% in a year. All Reported numbers for Australian/NZ listed stocks are Underperform – return >5% below benchmark return * Applicable to Australian/NZ/Canada stocks only modelled under IFRS (International Financial Reporting Recommendations – 12 months Standards). Macquarie - USA Outperform (Buy) – return >5% in excess of Russell 3000 Note: Quant recommendations may differ from index return Fundamental Analyst recommendations Neutral (Hold) – return within 5% of Russell 3000 index return Underperform (Sell)– return >5% below Russell 3000 index return Recommendation proportions – For quarter ending 31 December 2010 AU/NZ Asia RSA USA CA EUR Outperform 46.38% 62.62% 52.17% 44.99% 67.57% 50.90% (for US coverage by MCUSA, 13.59% of stocks covered are investment banking clients) Neutral 37.68% 18.58% 34.78% 50.61% 28.83% 35.48% (for US coverage by MCUSA, 15.22% of stocks covered are investment banking clients) Underperform 15.94% 18.80% 13.04% 4.40% 3.60% 13.62% (for US coverage by MCUSA, 0.00% of stocks covered are investment banking clients) Company Specific Disclosures: Macquarie Group Limited has provided non-securities services to GSI Commerce, Inc. and received compensation for such services in the last twelve months. Important disclosure information regarding the subject companies covered in this report is available at www.macquarie.com/disclosures. Analyst Certification: The views expressed in this research accurately reflect the personal views of the analyst(s) about the subject securities or issuers and no part of the compensation of the analyst(s) was, is, or will be directly or indirectly related to the inclusion of specific recommendations or views in this research. The analyst principally responsible for the preparation of this research receives compensation based on overall revenues of Macquarie Group Ltd ABN 94 122 169 279 (AFSL No. 318062) (MGL) and its related entities (the Macquarie Group) and has taken reasonable care to achieve and maintain independence and objectivity in making any recommendations. General Disclaimers: Macquarie Securities (Australia) Ltd; Macquarie Capital (Europe) Ltd; Macquarie Capital Markets Canada Ltd; Macquarie Capital Markets North America Ltd; Macquarie Capital (USA) Inc; Macquarie Capital Securities Ltd and its Taiwan branch; Macquarie Capital Securities (Singapore) Pte Ltd; Macquarie Securities (NZ) Ltd; Macquarie First South Securities (Pty) Limited; Macquarie Capital Securities (India) Pvt Ltd; Macquarie Capital Securities (Malaysia) Sdn Bhd; Macquarie Securities Korea Limited and Macquarie Securities (Thailand) Ltd are not authorized deposit-taking institutions for the purposes of the Banking Act 1959 (Commonwealth of Australia), and their obligations do not represent deposits or other liabilities of Macquarie Bank Limited ABN 46 008 583 542 (MBL) or MGL. MBL does not guarantee or otherwise provide assurance in respect of the obligations of any of the above mentioned entities. MGL provides a guarantee to the Monetary Authority of Singapore in respect of the obligations and liabilities of Macquarie Capital Securities (Singapore) Pte Ltd for up to SGD 35 million. This research has been prepared for the general use of the wholesale clients of the Macquarie Group and must not be copied, either in whole or in part, or distributed to any other person. If you are not the intended recipient you must not use or disclose the information in this research in any way. If you received it in error, please tell us immediately by return e-mail and delete the document. We do not guarantee the integrity of any e-mails or attached files and are not responsible for any changes made to them by any other person. MGL has established and implemented a conflicts policy at group level (which may be revised and updated from time to time) (the "Conflicts Policy") pursuant to regulatory requirements (including the FSA Rules) which sets out how we must seek to identify and manage all material conflicts of interest. Nothing in this research shall be construed as a solicitation to buy or sell any security or product, or to engage in or refrain from engaging in any transaction. In preparing this research, we did not take into account your investment objectives, financial situation or particular needs. Before making an investment decision on the basis of this research, you need to consider, with or without the assistance of an adviser, whether the advice is appropriate in light of your particular investment needs, objectives and financial circumstances. There are risks involved in securities trading. The price of securities can and does fluctuate, and an individual security may even become valueless. International investors are reminded of the additional risks inherent in international investments, such as currency fluctuations and international stock market or economic conditions, which may adversely affect the value of the investment. This research is based on information obtained from sources believed to be reliable but we do not make any representation or warranty that it is accurate, complete or up to date. We accept no obligation to correct or update the information or opinions in it. Opinions expressed are subject to change without notice. No member of the Macquarie Group accepts any liability whatsoever for any direct, indirect, consequential or other loss arising from any use of this research and/or further communication in relation to this research. Clients should contact analysts at, and execute transactions through, a Macquarie Group entity in their home jurisdiction unless governing law permits otherwise. Country-Specific Disclaimers: Australia: In Australia, research is issued and distributed by Macquarie Securities (Australia) Ltd (AFSL No. 238947), a participating organisation of the Australian Securities Exchange. New Zealand: In New Zealand, research is issued and distributed by Macquarie Securities (NZ) Ltd, a NZX Firm. Canada: In Canada, research is prepared, approved and distributed by Macquarie Capital Markets Canada Ltd, a participating organisation of the Toronto Stock Exchange, TSX Venture Exchange & Montréal Exchange. Macquarie Capital Markets North America Ltd., which is a registered broker-dealer and member of FINRA, accepts responsibility for the contents of reports issued by Macquarie Capital Markets Canada Ltd in the United States and sent to US persons. Any person wishing to effect transactions in the securities described in the reports issued by Macquarie Capital Markets Canada Ltd should do so with Macquarie Capital Markets North America Ltd. The Research Distribution Policy of Macquarie Capital Markets Canada Ltd is to allow all clients that are entitled to have equal access to our research. United Kingdom: In the United Kingdom, research is issued and distributed by Macquarie Capital (Europe) Ltd, which is authorised and regulated by the Financial Services Authority (No. 193905). Germany: In Germany, research is issued and distributed by 3 March 2011 11
- 12. Macquarie (USA) Research US Internet Macquarie Capital (Europe) Ltd, Niederlassung Deutschland, which is authorised and regulated in the United Kingdom by the Financial Services Authority (No. 193905). France: In France, research is issued and distributed by Macquarie Capital (Europe) Ltd, which is authorised and regulated in the United Kingdom by the Financial Services Authority (No. 193905). Hong Kong: In Hong Kong, research is issued and distributed by Macquarie Capital Securities Ltd, which is licensed and regulated by the Securities and Futures Commission. Japan: In Japan, research is issued and distributed by Macquarie Capital Securities (Japan) Limited, a member of the Tokyo Stock Exchange, Inc. and Osaka Securities Exchange Co. Ltd (Financial Instruments Firm, Kanto Financial Bureau (kin-sho) No. 231, a member of Japan Securities Dealers Association and Financial Futures Association of Japan). India: In India, research is issued and distributed by Macquarie Capital Securities (India) Pvt Ltd. Level 3, Mafatlal Centre, Nariman Point, Mumbai 400 021, INDIA, which is a SEBI registered Stock Broker having membership with National Stock Exchange of India Limited (INB231246738) and Bombay Stock Exchange Limited (INB011246734). Malaysia: In Malaysia, research is issued and distributed by Macquarie Capital Securities (Malaysia) Sdn. Bhd. (Company registration number: 463469-W) which is a Participating Organisation of Bursa Malaysia Berhad and a holder of Capital Markets Services License issued by the Securities Commission. Taiwan: Information on securities/instruments that are traded in Taiwan is distributed by Macquarie Capital Securities Ltd, Taiwan Branch, which is licensed and regulated by the Financial Supervisory Commission. No portion of the report may be reproduced or quoted by the press or any other person without authorisation from Macquarie. Nothing in this research shall be construed as a solicitation to buy or sell any security or product. Thailand: In Thailand, research is issued and distributed by Macquarie Securities (Thailand) Ltd, a licensed securities company that is authorized by the Ministry of Finance, regulated by the Securities and Exchange Commission of Thailand and is an exchange member no. 28 of the Stock Exchange of Thailand. The Thai Institute of Directors Association has disclosed the Corporate Governance Report of Thai Listed Companies made pursuant to the policy of the Securities and Exchange Commission of Thailand. Macquarie Securities (Thailand) Ltd does not endorse the result of the Corporate Governance Report of Thai Listed Companies but this Report can be accessed at: http://www.thai-iod.com/en/publications.asp?type=4. South Korea: In South Korea, unless otherwise stated, research is prepared, issued and distributed by Macquarie Securities Korea Limited, which is regulated by the Financial Supervisory Services. Information on analysts in MSKL is disclosed at http://dis.kofia.or.kr/fs/dis2/fundMgr/DISFundMgrAnalystPop.jsp?companyCd2=A03053&pageDiv=02. South Africa: In South Africa, research is issued and distributed by Macquarie First South Securities (Pty) Limited, a member of the JSE Limited. Singapore: In Singapore, research is issued and distributed by Macquarie Capital Securities (Singapore) Pte Ltd (Company Registration Number: 198702912C), a Capital Markets Services license holder under the Securities and Futures Act to deal in securities and provide custodial services in Singapore. Pursuant to the Financial Advisers (Amendment) Regulations 2005, Macquarie Capital Securities (Singapore) Pte Ltd is exempt from complying with sections 25, 27 and 36 of the Financial Advisers Act. All Singapore- based recipients of research produced by Macquarie Capital (Europe) Limited, Macquarie Capital Markets Canada Ltd, Macquarie First South Securities (Pty) Limited and Macquarie Capital (USA) Inc. represent and warrant that they are institutional investors as defined in the Securities and Futures Act. United States: In the United States, research is issued and distributed by Macquarie Capital (USA) Inc., which is a registered broker-dealer and member of FINRA. Macquarie Capital (USA) Inc, accepts responsibility for the content of each research report prepared by one of its non-US affiliates when the research report is distributed in the United States by Macquarie Capital (USA) Inc. Macquarie Capital (USA) Inc.’s affiliate’s analysts are not registered as research analysts with FINRA, may not be associated persons of Macquarie Capital (USA) Inc., and therefore may not be subject to FINRA rule restrictions on communications with a subject company, public appearances, and trading securities held by a research analyst account. Any persons receiving this report directly from Macquarie Capital (USA) Inc. and wishing to effect a transaction in any security described herein should do so with Macquarie Capital (USA) Inc. Important disclosure information regarding the subject companies covered in this report is available at www.macquarie.com/research/disclosures, or contact your registered representative at 1-888-MAC-STOCK, or write to the Supervisory Analysts, Research Department, Macquarie Securities, 125 W.55th Street, New York, NY 10019. © Macquarie Group Auckland Bangkok Calgary Denver Frankfurt Geneva Hong Kong Tel: (649) 377 6433 Tel: (662) 694 7999 Tel: (1 403) 218 6650 Tel: (303) 952 2800 Tel: (069) 509 578 000 Tel: (41) 22 818 7777 Tel: (852) 2823 3588 Jakarta Johannesburg Kuala Lumpur London Manila Melbourne Montreal Tel: (62 21) 515 1818 Tel: (2711) 583 2000 Tel: (60 3) 2059 8833 Tel: (44 20) 3037 4400 Tel: (63 2) 857 0888 Tel: (613) 9635 8139 Tel: (1 514) 925 2850 Mumbai Munich New York Paris Perth Seoul Shanghai Tel: (91 22) 6653 3000 Tel: (089) 2444 31800 Tel: (1 212) 231 2500 Tel: (33 1) 7842 3823 Tel: (618) 9224 0888 Tel: (82 2) 3705 8500 Tel: (86 21) 6841 3355 Singapore Sydney Taipei Tokyo Toronto Tel: (65) 6231 1111 Tel: (612) 8232 9555 Tel: (886 2) 2734 7500 Tel: (81 3) 3512 7900 Tel: (1 416) 848 3500 Available to clients on the world wide web at www.macquarieresearch.com and through Thomson Financial, FactSet, Reuters, Bloomberg, CapitalIQ and TheMarkets.com. 3 March 2011 12
- 13. Research Heads of Equity Research Financials – cont’d TMET – cont’d John O’Connell (Global Co-Head) (612) 8232 7544 Financial Technology Internet David Rickards (Global Co-Head) (44 20) 3037 4399 Bill Carcache (New York) (1 212) 231 8034 Ben Schachter (New York) (1 212) 231 0644 Graham Copley (US) (1 212) 231 2632 Tom White (New York) (1 212) 231 0643 Life Insurance Stephen Harris (Canada Co-Head) (1 416) 848 3655 Mark Finkelstein (Chicago) (1 312) 660 9179 Media Matthew Akman (Canada Co-Head) (1 416) 848 3510 Paul Sarran (Chicago) (1 312) 660 9137 Andrew Kim (New York) (1 212) 231 2631 Consumer Discretionary & Healthcare Sumit Malhotra (Toronto) (1 416) 848 3687 Semiconductors Market Structure Shawn Webster (New York) (1 212) 231 2539 Life Sciences & Technology Edward Ditmire (Head of Diversified Jon Groberg (Head of US Discretionary Financials) (1 212) 231 8076 Software & IT Hardware & Healthcare) (1 212) 231 2612 Chris Ross (New York) (1 212) 231 8033 Brad Zelnick (New York) (1 212) 231 2618 Gaming & Leisure Mortgage & Consumer Finance Solar & Clean Technology Chad Beynon (New York) (1 212) 231 2634 Matthew Howlett (New York) (1 212) 231 8063 Kelly Dougherty (New York) (1 212) 231 2493 Consumer Staples and Agriculture Mortgage REITs Utilities & Alternative Energy Matthew Howlett (New York) (1 212) 231 8063 David Pupo (Toronto) (1 416) 848 3505 Angie Storozynski (Head of US Utilities & Property & Casualty Insurance Alternative Energy) (1 212) 231 2569 Energy Alan Zimmermann (1 212) 231 8081 Andrew Weisel (New York) (1 212) 231 1159 Amit Kumar (New York) (1 212) 231 8013 Matthew Akman (Toronto) (1 416) 848 3510 US Exploration & Production Caroline Steers (New York) (1 212) 231 8048 Stephen Harris (Toronto) (1 416) 848 3655 Joe Magner (Denver) (1 303) 952 2751 John Nelson (New York) (1 212) 231 2622 Industrials Commodities & Precious Metals US Oilfield Services & Drilling Air Freight & Surface Transportation Metals & Mining Waqar Syed (Head of US Energy) (1 303) 952 2753 Scott Flower (New York) (1 212) 231 2537 Jim Lennon (London) (44 20) 3037 4271 Ryan McCormick (Denver) (1 303) 952 2752 Max Layton (London) (44 20) 3037 4273 Chemicals US Refining Cooley May (New York) (1 212) 231 2586 Kona Haque (London) (44 20) 3037 4334 Chi Chow (Denver) (1 303) 952 2757 Construction and Engineering/Machinery Oil & gas Canadian Oil Sands/Heavy Oil Producers Sameer Rathod (New York) (1 212) 231 2474 Jan Stuart (New York) (1 212) 231 2485 Chris Feltin (Calgary) (1 403) 539 8544 Containers & Packaging Economics and Strategy Canadian Oilfield Services & Drilling Al Kabili (New York) (1 212) 231 2473 Stephen Harris (Toronto) (1 416) 848 3655 Scott Treadwell (Calgary) (1 403) 539 8530 Materials Jan Stuart (Global Oil Economist) (1 212) 231 2485 Canadian Independents Rebecca Hiscock-Croft (US Economist) (1 212) 231 6115 Global Metals & Mining Chris Feltin (Calgary) (1 403) 539 8544 Curt Woodworth (New York) (1 212) 231 2482 Quantitative Analysis Canadian Integrateds Pierre Vaillancourt (Toronto) (1 416) 848 3647 Chris Feltin (Calgary) (1 403) 539 8544 Tony Lesiak (Toronto) (1 416) 848 3594 Charles Lowe (New York) (1 212) 231 2602 Duncan McKeen (Montréal) (1 514) 925 2856 Victor Morange (New York) (1 212) 231 2538 International/Canadian Oil & Gas Producers Michael Gray (Vancouver) (1 604) 639 6372 Cristina Lopez (Calgary) (1 403) 539 8542 David Popowich (Calgary) (1 403) 539 8529 Real Estate Find our research at Ray Kwan (Calgary) (1 403) 539 4355 Macquarie: www.macquarie.com.au/research Property Trusts & Developers Thomson: www.thomson.com/financial Financials Robert Stevenson (Head of US REITs) (1 212) 231 8068 Reuters: www.knowledge.reuters.com Ki Bin Kim (New York) (1 212) 231 6386 Asset Managers Bloomberg: MAC GO Michael Smith (Toronto) (1 416) 848 3696 Roger Smith (New York) (1 212) 231 8016 Factset: http://www.factset.com/home.aspx Banks/Trust Banks TMET CapitalIQ www.capitaliq.com TheMarkets.com www.themarkets.com Albert Savastano (New York) (1 212) 231 8046 Telecommunications Contact Gareth Warfield for access (612) 8232 3207 Thomas Alonso (New York) (1 212) 231 8047 Kevin Smithen (New York) (1 212) 231 0695 Jonathan Elmi (New York) (1 212) 231 8065 Email addresses Bill Young (New York) (1 212) 231 8052 Business Services Kevin McVeigh (New York) (1 212) 231 6191 FirstName.Surname@macquarie.com Sumit Malhotra (Toronto) (1 416) 848 3687 Stephen Scinicariello (New York) (1 212) 231 0663 Cable & Satellite eg. David.Rickards@macquarie.com John Moran (New York) (1 212) 231 0662 Amy Yong (New York) (1 212) 231 2624 Equities Sales Trading Head of Global Cash Equities US Sales US Sales Trading Stevan Vrcelj (Sydney) (612) 8232 5999 Greg Coleman (New York) (1 212) 231 2567 Austin Graham (New York) (1 212) 231 2494 Head of Canadian Equities US Financial Specialist Sales Canada Trading Alex Rothwell (Toronto) (1 416) 848 3677 Blair Smith (New York) (1 212) 231 8004 Perry Catellier (Toronto) (1 416) 848 3619 Head of US Equities Canada Sales International Sales Trading Graham Copley (New York) (1 212) 231 2632 Craig Brenner (Toronto) (1 416) 848-3626 Chris Reale (New York) (1 212) 231 2555 Chris Naprawa (Toronto) (1 416) 848-3634