Student Profile Sample - We help schools to connect the data they have, with ...
The file with the highly informative name "other data"
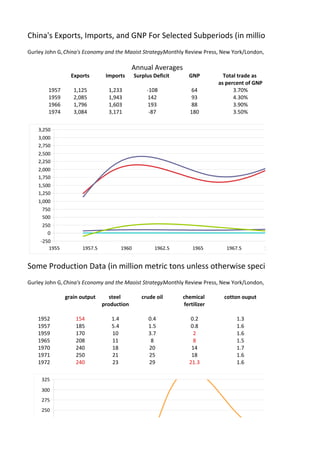
1. China's Exports, Imports, and GNP For Selected Subperiods (in millions of U.S. dollars
Gurley John G, China's Economy and the Maoist Strategy.Monthly Review Press, New York/London, 1976, S. 163.
Annual Averages
Exports Imports Surplus Deficit GNP Total trade as
as percent of GNP
1957 1,125 1,233 -108 64 3.70%
1959 2,085 1,943 142 93 4.30%
1966 1,796 1,603 193 88 3.90%
1974 3,084 3,171 -87 180 3.50%
3,250
3,000
2,750
2,500
2,250
2,000
1,750
1,500
1,250
1,000
750
500
250
0
-250
1955 1957.5 1960 1962.5 1965 1967.5 1970 1972.5
Some Production Data (in million metric tons unless otherwise specified)
Gurley John G, China's Economy and the Maoist Strategy.Monthly Review Press, New York/London, 1976, S. 235.
grain output steel crude oil chemical cotton ouput
production fertilizer
1952 154 1.4 0.4 0.2 1.3
1957 185 5.4 1.5 0.8 1.6
1959 170 10 3.7 2 1.6
1965 208 11 8 8 1.5
1970 240 18 20 14 1.7
1971 250 21 25 18 1.6
1972 240 23 29 21.3 1.6
325
300
275
250
225
200
175
150
2. 300
275
250
225
200
175
150
125
100
75
50
25
0
1950 1952.5 1955 1957.5 1960 1962.5 1965 1967.5 1970
Inputs and outputs of China's agriculture
Gurley John G, China's Economy and the Maoist Strategy.Monthly Review Press, New York/London, 1976, S. 248.
China's production of inputs Other inputs
Chemical tractors electric power inventory area irrigated with
fertilizers of mecanical with mecanical
pumps pumps
in mill metric in 1000 of in bill kwhr in mill horse in 1000 hectares
tons standard power
units
1952 0.2 0 n.a. n.a. n.a.
1959 2 1.5 1.5 3.4 646
1965 8 33.1 2.7 8 1,520
1970 14 62.7 4.6
1971 18 73.4 5.5
1600
1500
1400
1300
1200
1100
1000
900
800
700
600
500
400
300
200
100
5. in millions of U.S. dollars)
rk/London, 1976, S. 163.
1950-1957
1958-1959
1960-1966
1967-1974
Exports
Imports
Surplus Deficit
GNP
Total trade as
.5 1970 1972.5 1975
se specified)
rk/London, 1976, S. 235.
industrial cement coal electic power
production production production
1956=100 in mill kwhr
56 2.9 67 7.3
109 6.9 131 19.3
182 11 300 42
167 11 220 42
220 13 300 60
242 16 325 70
20
grain output
steel
crude oil
chemical
cotton ouput
6. grain output
steel
crude oil
chemical
cotton ouput
industrial
cement
coal
electic power
1965 1967.5 1970 1972.5
rk/London, 1976, S. 248.
Some outputs
imports of grain output sugar output cotton yield
chemical
fertilizers
in mill metric in mill in mill kg per hectare
tons metric tons metric tons
0.1 154 0.45 232
1 170 1.1 285
2.3 200 1.5 333
4.3 240 1.7 377
250 381
Chemical
tractors
electric power
inventory
area irrigated with
imports of
grain output
sugar output
cotton yield
7. grain output
sugar output
cotton yield
1964 1966 1968 1970 1972
me and Nominal Wage in China (All in Percentage)
/Oxford, 1994, S.14
9.
General
Money
Real national
Nominal
8. Money
Real national
Nominal
5 1967.5 1970 1972.5 1975 1977.5