iso-thermal transformation of steel
•Download as DOCX, PDF•
1 like•816 views

Cooling curve of Eutectoid, Hypereutectoid and hypo-eutectoid steel

Recommended
More Related Content
What's hot
What's hot (20)
Viewers also liked
Similar to iso-thermal transformation of steel
Similar to iso-thermal transformation of steel (20)
More from Abdul Rahman
More from Abdul Rahman (20)
Recently uploaded
Recently uploaded (20)
iso-thermal transformation of steel
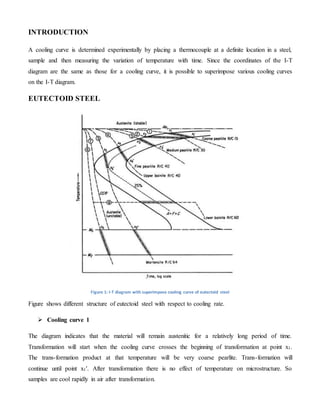
- 1. INTRODUCTION A cooling curve is determined experimentally by placing a thermocouple at a definite location in a steel, sample and then measuring the variation of temperature with time. Since the coordinates of the I-T diagram are the same as those for a cooling curve, it is possible to superimpose various cooling curves on the I-T diagram. EUTECTOID STEEL Figure 1: I-T diagram with superimpose cooling curve of eutectoid steel Figure shows different structure of eutectoid steel with respect to cooling rate. Cooling curve 1 The diagram indicates that the material will remain austenitic for a relatively long period of time. Transformation will start when the cooling curve crosses the beginning of transformation at point x1. The trans-formation product at that temperature will be very coarse pearlite. Trans-formation will continue until point x1'. After transformation there is no effect of temperature on microstructure. So samples are cool rapidly in air after transformation.
- 2. Cooling curve 2 This illustrates "isothermal" or "cycle annealing". In contrast to conventional annealing, this treatment produces a more uniform microstructure and hardness, in many cases with a shorter time cycle. Cooling curve 3 Cooling curve 3 is a faster cooling rate than annealing and may be considered typical of normalizing. The diagram indicates that transformation will start at x3 with the formation of coarse pearlite n a much shorter time than annealing. Since there is a greater temperature difference between x3 and x3' than there is between x1, and x1', the normalized microstructure will show a greater variation in the fineness of pearlite and a smaller proportion of coarse pearlite than the annealed microstructure. Cooling curve 4 Cooling curve 4, typical of a slow oil quenching is similar to the one just the microstructure will be a mixture of medium and fine pearlite. Cooling curve 5 Cooling curve 5, typical of an intermediate cooling rate, will start to trans-form (at X5) to fine pearlite in a relatively short time. The transformation to fine pearlite will continue until the curve becomes tangent to some percentage transformed, (let say 25%) at x'5. Below this temperature, the cooling curve is going in a direction of decreasing percent transformed. Since pearlite cannot form austenite on cooling, the transformation must stop at x'5. The microstructure at this point will consist 25 percent of fine nodular pearlite largely surrounding the existing austenitic grains. It will remain in this condition until Ms line. And all austenite will transform into martensite. So we will have final structure of globular pearlite with surrounded by martensite. Cooling curve 6 Curve 6, typical of a drastic quench, is rapid enough to avoid transformation in the nose region. It remains austenitic until the Ms line is reached at x6. Transformation to martensite will take place between the Ms and Mf, lines. The final microstructure will be entirely martensite of high hardness. Cooling curve 7 This represents critical cooling curve. For formation of martensite cooling curve should be on left side of this and for relatively soft structure cooling curve should be on right side.
- 3. Cooling curve 8 This represents formation of bainite structure. Samples are cooled rapidly to avoid node and above Ms. Above Ms temperature these are put in salt bath at constant temperature for complete transformation in to bainite. Figure 2: cooling rate for different microstructure of eutectoid steel
- 4. HYPO-EUTECTOID STEEL Figure 3: I-T of hypo-eutectoid steel In this diagram it can be seen that nose of curve has been shifted to left because of low carbon contents. In hypo-eutectoid steel martensite formation is much difficult. Drastically quenching is required for the formation of martensite. And chances of, cracking of materials is also there. Figure 4: TimeTemperatureTransformation (TTT) curve for carbon steel AISI 1050 HYPER-EUTECTOID STEEL As carbon contents increase nose of TTT diagram shift toward right side. Formation of martensite is easy in these alloys.
- 5. Figure 5: TTT diagram of hyper-eutectoid steel TRANSFORMATION ON CONTINUOUS COOLING` Theoretically, cooling-rate curves should not be superimposed on the l-T diagram as was done in the previous section. The l-T diagram shows the time-temperature relationship for austenite transformation only as it occurs at constant temperature, but most heat treatments involve transformation on continuous cooling. It is possible to derive from the l-T diagram another diagram which will show the transformation under continuous cooling. This is referred to as the CC-T diagram (continuous cooling-transformation diagram) Figure 6: CCT of eutectoid steel