
Recommended
More Related Content
What's hot
What's hot (20)
More from mrcox
More from mrcox (11)
Recently uploaded
Recently uploaded (20)
BTEC National in ICT: Unit 3 - Data Flow Diagrams Introduction
- 1. Information Systems Data Flow Diagrams 1
- 2. Data Flow Diagrams Objectives: • To define what is meant by structured analysis • To define the symbols used in a Data Flow Diagram (DFD) • To draw a context diagram (Level 0 DFD) for a given scenario • To refine a DFD to a more detailed (lower- level) view
- 3. Structured Analysis • A widely-used top-down method for defining system inputs, processes and outputs. • It shows how information flows through a system, using several diagrams showing progressively more and more detail at each level. • The primary tool of structured analysis is the Data Flow Diagram (DFD).
- 4. Data Flow Diagrams • Data Flow Diagrams – Model how information flows around a system, how it is processed and stored – Partition a system into independent units of more manageable size that is verifiable, concise and easily understood – Hierarchical
- 5. Drawing Data Flow Diagrams • Cannot be achieved without – Paper or Computer – Cross-checking at every stage – Pain and Confusion! • Eventually – Allow understanding of New System – Produce Invaluable Document • Steps are for Guideline purposes only!
- 6. DFD Symbols - External Entity • An external entity is often the source or destination of information e.g. – Customer Entity Name
- 7. DFD Symbols - Data Flow NOT A VERB !!! Description of Data Flow
- 8. DFD Symbols - Data Stores File identifier (Data store) D1 Data Store name The system files
- 9. DFD Symbols - Processes No more than 7 per diagram Sequence 1 Location Process Name Process Description (NOT WHERE or WHO)
- 10. DFD’s - Valid Connections External Process Data Flow Entity (Data Source) (Event or activity) A Process Another Process Data Flow (Event or activity) (Event or activity) A Process Data Flow D1 Data store (Event or activity)
- 11. DFD’s - Invalid Connections Invalid D B Data Store D A Data Store Outside Also Invalid D A Data Store System Outside Also Not only invalid System Outside but nothing to do with system
- 12. Levels of DFD Validate Order Level 0 Order Rejection Customer Valid Order Check Stock Level Check Form Completion Correct Form Customer Order Order Incorrect Form Check Parts Validity Invalid Order Parts Details OOS Letter Order Processing Return Order Order Rejection M Parts GDN Level 2 Level 1 Order Processing M Parts Order Validate Order Customer Parts Details Order Rejection Valid Order Check Stock Level Stock Level Produce OOS letter OOS Letter OOS Orders M Stock In Stock Orders Stock Detail Make up Order Update file Orderb Details GDN
- 13. Context Diagrams Order Invoice Out-of-stock Process Picking List Customer Warehouse notice order Order rejection notice This is a Level 0 DFD or Context Diagram It shows the least amount of detail
- 14. Creating a Context Diagram – step 1 • Producing Context Diagram ( Level 0) – Identify External Entities – Identify Inputs • Data Flows – Identify Outputs • Data Flow – Draw Context Diagram • Possibly combine data flows at this stage • e.g. Orders = Phone Orders and Mail Orders
- 15. Context Diagram Order Rejection Customer Order OOS Letter Order Processing GDN
- 16. Step 2 • Producing Level 1 Diagram – Identify up to seven major processes • Draw a Level 1 DFD – Associate data flows and external entities from Context Diagram • Update Level 1 DFD – Identify the data flows that link the identified processes • Update Level 1 DFD – Identify files associated with identified processes • Update Level 1 DFD – Check Level 1 DFD • You will have made a mistake !! – Possibly correct Level 1 DFD and Context Diagram
- 17. DFD Example Functionality • Companies send in requests for references • Requests are checked and either returned (if invalid) or retained for processing • Request Processing involves reading data from the Assessment file and forwarding the Collated Reference Information for Reference writing
- 18. Level 1 DFD Example 1 Reference Request Check Request Valid Request Company Invalid Request D2 Assessment File 2 Assessment Process records Request Collated D1 Address Assessment Address 3 Reference Write Reference Reference (copy) D3 Reference File
- 19. DFD Level 1 Example 2 Vacancy Vacancy Details Standardise Agency Vacancy D1 Vacancy File 2 Vacancy Vacancy details Enquiry Process Enquiry 3 Matched Vacancies Convert File Client Suitable Vacancies D1 Client Vacancies Converted Vacancy details
- 20. Step 3 • Producing Level 2 Diagrams • For each Level 1 process – Identify up to seven major processes (Draw a Level 2 DFD) – Associate data flows, processes, files and external entities from Level 1 DFD (Update Level 2 DFD) – Identify the data flows that link the identified processes (Update Level 2 DFD) – Identify files associated with identified processes (Update Level 2 DFD) – Check Level 2 DFD (You will have made a mistake !!) – Possibly correct Context Diagram, Level 1 & Level 2 DFD.
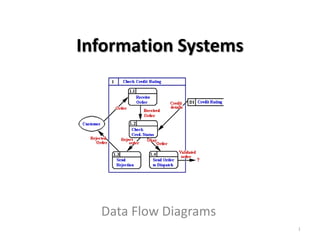
- 21. DFD Exercise • Draw a Level 1 DFD for the following scenario – Customers send in orders. The orders are validated by the Sales Department using information from the Parts file. Invalid orders are returned to customers. Valid orders are passed to Despatch Dept, where the orders are made up and forwarded to the customer • Now have a go at the DFD scenarios worksheet
- 22. DFD Levels - Summary • Level 0 or context diagram shows a system as a single process with inputs and outputs flowing to or from external entities. • Level 1 DFD will split up that single process into subsystems and show more detail about the data flows and data stores. • Level 2 DFD may decompose a single subsystem even further.