
Recommended
Recommended
More Related Content
What's hot
What's hot (20)
Similar to 10 rangeland vegetation_english_072318
Similar to 10 rangeland vegetation_english_072318 (20)
More from natavoloshyna
More from natavoloshyna (20)
Recently uploaded
Recently uploaded (20)
10 rangeland vegetation_english_072318
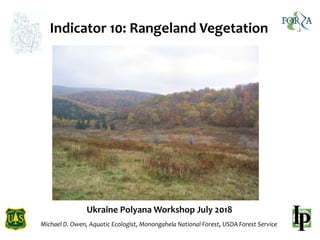
- 1. Ukraine Polyana Workshop July 2018 Michael D. Owen, Aquatic Ecologist, Monongahela National Forest, USDA Forest Service Indicator 10: Rangeland Vegetation
- 2. Indicator 10: Rangeland Vegetation WATERSHED CONDITION INDICATORS (12 Indicator Model) 5. RIPARIAN VEGETATION 1. Vegetation Condition AQUATIC PHYSICAL (Weight = 30%) 12. FOREST HEALTH 1. Insects and Disease 2. Ozone 11. TERRESTRIAL INVASIVE SPECIES 1. Extent & Rate of Spread AQUATIC BIOLOGICAL (Weight = 30%) TERRESTRIAL PHYSICAL (Weight = 30%) TERRESTRIAL BIOLOGICAL (Weight = 10%) 4. AQUATIC BIOTA 1. Life Form Presence 2. Native Species 3. Exotic and/or Invasive Species 6. ROADS & TRAILS 1. Open Road Density 2. Road Maintenance 3. Proximity to Water 4. Mass Wasting 9. FOREST COVER 1. Loss of Forest Cover 7. SOILS 1. Soil Productivity 2. Soil Erosion 3. Soil Contamination 1. WATER QUALITY 1. Impaired Waters (303d Listed) 2. Water Quality Problems (Not Listed) 2. WATER QUANTITY 1. Flow Characteristics 10. RANGELAND VEGETATION 1. Vegetation Condition 8. FIRE REGIME or WILDFIRE 1. Fire Condition Class OR 2. Wildfire Effects 3. AQUATIC HABITAT 1. Habitat Fragmentation 2. Large Woody Debris 3. Channel Shape and Function Purpose: To address effects to soil and water related to the vegetative health of rangelands. Rationale: The status of rangeland vegetation can affect soil stability, hydrologic function, and biological diversity.
- 3. Indicator 10: Rangeland Vegetation Attribute: 10.1 Native / Desirable Non-native Plant Composition Additional Guidance: • If rated “Not Applicable”, Forest Cover must be rated • Use guidance and definitions found in Interpreting Indicators of Rangeland Health (Pellant et al. 2005) to assist with this evaluation
- 4. Indicator 10: Rangeland Vegetation Condition Rating Functioning Properly (1) Functioning at Risk (2) Impaired Function (3) Indicator 10 Rangeland Vegetation Reflect native or desired nonnative plant composition and cover at near-natural levels as defined by the site potential. Reflect native or desired nonnative plant composition and cover with slight to moderate deviation compared to natural levels as defined by the site potential. Native or desired nonnative plant composition and cover are greatly reduced or unacceptably altered compared to natural levels as defined by the site potential. 10.1 Native / Desirable Non- native Plant Composition Vegetation contributes to soil condition, nutrient cycling, and hydrologic regimes at near-natural levels; average annual plant production equals or exceeds 70% of production potential; introduced plant species are being managed to facilitate long-term replacement by site- adapted native species. Functional/structural groups and number of species are slightly to moderately reduced; average annual plant production is 40 to 69% of production potential; introduced plant species are being managed to facilitate long-term replacement by site-adapted native species or to ensure adequate ground cover to protect the soil. Functional/structural groups and number of species are moderately to greatly reduced or altered relative to site potential; average annual plant production is <40% of production potential; introduced plant species are dominant and are not effective in protecting the site and soil.
- 5. Indicator 10: Rangeland Vegetation • likelihood of watershed impacts increases as the average annual plant production decreases relative to the potential • rated “not applicable” in watersheds where no rangelands occur • Informed by rangeland vegetation databases and local knowledge • Interdisciplinary team review is encouraged
- 6. Indicator 10: Rangeland Vegetation
- 7. Indicator 10: Rangeland Vegetation Condition Rating Functioning Properly (1) Functioning at Risk (2) Impaired Function (3) Indicator 10 Rangeland Vegetation Reflect native or desired nonnative plant composition and cover at near-natural levels as defined by the site potential. Reflect native or desired nonnative plant composition and cover with slight to moderate deviation compared to natural levels as defined by the site potential. Native or desired nonnative plant composition and cover are greatly reduced or unacceptably altered compared to natural levels as defined by the site potential. 10.1 Native / Desirable Non- native Plant Composition Vegetation contributes to soil condition, nutrient cycling, and hydrologic regimes at near-natural levels; average annual plant production equals or exceeds 70% of production potential; introduced plant species are being managed to facilitate long-term replacement by site- adapted native species. Functional/structural groups and number of species are slightly to moderately reduced; average annual plant production is 40 to 69% of production potential; introduced plant species are being managed to facilitate long-term replacement by site-adapted native species or to ensure adequate ground cover to protect the soil. Functional/structural groups and number of species are moderately to greatly reduced or altered relative to site potential; average annual plant production is <40% of production potential; introduced plant species are dominant and are not effective in protecting the site and soil.