SlideShare a Scribd company logo
1 of 12
Download to read offline
Putnam fixed-income views
Arrows in the table indicate the change
from the previous quarter.
Underweight
Smallunderweight
Neutral
Smalloverweight
Overweight
Fixed-income asset class
U.S. government and agency debt l
U.S. tax exempt l
Tax-exempt high yield l
Agency mortgage-backed securities l
Collateralized mortgage obligations l
Non-agency residential mortgage-backed securities l
Commercial mortgage-backed securities l
U.S. floating-rate bank loans l
U.S. investment-grade corporates l
Global high yield l
Emerging markets l
U.K. government l
Core Europe government l
Peripheral Europe government l
Japan government l
CURRENCY SNAPSHOT
Dollar vs. yen: Dollar•Dollar vs. euro: Dollar•Dollar vs. pound: Pound
Broad-based economic improvement
supports risk assets
Now at midyear, the global outlook looks
bright. Indeed, the shift in the global econ-
omy’s momentum between the first and
second quarter appears to have been quite
sharp. Some of this, of course, reflects the
U.S. recovery from the weather-related slow-
down in the first quarter, but the acceleration
is more broad-based. Among advanced
economies, the United States and the United
Kingdom look strikingly better, while Japan
looks stronger at this stage than many people
expected. Europe does not look much better,
but it doesn’t look any worse, either.
Across emerging markets, the economic
outlook is a mixed bag, with some countries
improving and others appearing poised to do
worse, but, at the margin, EM is contributing
to the global expansion. China appears to be
moderately stronger, thanks to the targeted
stimulus measures taken over the past few
months.
The window to normalize is open
Importantly, most central banks appear happy
to keep the stimulus flowing, and as a result,
risk assets had a strong quarter through June.
The performance of risk assets against a global
economic backdrop that remains uneven and
harbors significant downside potential has
led to renewed concern about whether asset
markets are adequately pricing risks. Some
observers believe that central banks should
begin normalizing rates soon, to take advan-
tage of the window of opportunity presented
by the current pickup in global growth.
Key takeaways
•	The global economy is improving overall, with the U.S. and U.K.
leading the way.
•	We expect higher GDP growth from the U.S. to support risk
assets in the third quarter.
•	We continue to expect a rise in U.S. interest rates in 2014,
though eurozone policy may help slow a near-term increase.
•	We favor credit, prepayment, and liquidity risks, which we
express in allocations to mezzanine CMBS, peripheral European
sovereigns, select EM sovereigns, and interest-only (IO) CMOs.
Q3 2014 » Putnam Perspectives
Fixed-Income Outlook
D. William Kohli
Co-Head of
Fixed Income
Michael V. Salm
Co-Head of
Fixed Income
Paul D. Scanlon, CFA
Co-Head of
Fixed Income
2
Q3 2014 | Fixed-Income Outlook
The Bank of England may be the first to act. The
BoE has acknowledged that a rate increase is on the
horizon and has introduced macro-prudential measures
to address housing-market risks. The measures, which
include stricter affordability tests for borrowers and
restrictions on loan-to-value ratios for loans that are a
high multiple of borrowers’ incomes, pose an interesting
experiment that bears scrutiny.
U.S. inflation picking up, Euro inflation bottoming
In the United States, economic data surprised to the
upside in the second quarter, including in purchasing
managers’ indexes, labor market dynamics, auto sales,
and a variety of housing-market metrics. However, food
costs are contributing positively to inflation, largely
because the drought in California has pushed up fruit and
vegetable prices, while cost trends in the housing sector
have contributed to core inflation levels.
U.S. policy tends to look through the food-related cost
pressure as it focuses on core inflation, which excludes
the volatile food and energy components. Moreover,
the Fed uses the PCE deflator — personal consump-
tion expenditure — to measure inflation, which puts a
higher weight on medical costs and a lower weight on
shelter prices than the CPI. Fed Chair Yellen, for example,
referred to the May inflation data (2.1% headline, 2.0%
core) as “noise.” Of course, this overlooks the fact that
the May rise in core prices was the largest in a decade
and double the 10-year average. If one takes the past 120
inflation observations, the chance of seeing a May-type
increase would be 5%.
Figure 1. Fixed-income asset
class performance
0%
1%
2%
3%
4%
5%
6%
2Q 141Q 14
Japan
gov’t
Eurozone
gov’t
U.K.
gov’t
Emerging-
market
debt
Global
high
yield
U.S.
investment-
grade
corporate
debt
U.S.
floating-
rate
bankloans
Commercial
mortgage-
backed
securities
Agency
mortgage-
backed
securities
Tax-
exempt
high
yield
U.S.
tax
exempt
U.S.
government
Source: Putnam research, as of 6/30/14. Past performance is not indicative of future results. See page 10 for index definitions.
Fixed income delivered strong performance across
most sectors in the second quarter of 2014.
PUTNAM INVESTMENTS | putnam.com
3
In Europe, the pattern of real growth is largely flat,
despite standout strength in Spain and Germany and
renewed weakness in France. The same goes for inflation.
We think inflation in the United Kingdom and the euro-
zone will bottom during the summer. Potential upward
pressure from energy and food prices is something to
monitor later in the year. Having said that, the disinfla-
tionary threat that prompted the ECB’s policy easing
decisions is not likely to go away, in our view, given the
region’s nontrivial economic weakness.
Rate expectations
Though we expect U.S. rates to move higher through the
year, the ECB’s recent policy moves, including the estab-
lishment of a negative deposit rate and the introduction
of targeted long-term refinancing operations (TLTROs),
may affect that trajectory.
Figure 2. Short-term rates remained
anchored by the Fed’s
monetary policy
0%
1%
2%
3%
4%
6/30/14
3/31/14
30
years
20
years
10
years
7
years
5
years
3
years
1 year
1m
onth
Source: U.S. Department of the Treasury, as of 6/30/14.
Interest rates fell across the intermediate
and long portions of a flattening yield curve
in the second quarter.
4
Q3 2014 | Fixed-Income Outlook
Many investors are looking at the U.S. rate spread rela-
tive to Germany as a constraint on U.S. yields moving
higher. Over the past decade or so, U.S. rates have
generally not traded more than 125 basis points over
German rates, which is approximately where the spread
is today. Given that the European Central Bank is unlikely
to stop providing liquidity very soon, that may keep a lid
on European rates and, some market participants feel,
consequently slow the ability of U.S. rates to move higher.
Outlook for continued support of risk assets
We believe the economic backdrop in the quarters
ahead will be supportive of riskier fixed-income assets.
That said, there are global risk factors we are watching,
including recent developments in Iraq and the effect
this could have on oil prices. Additionally, we continue to
monitor the situation in Ukraine as well as economic tran-
sitions under way in China. Volatility has been relatively
low among most financial assets, and spread markets
have generally continued to tighten toward pre-crisis
levels. In our view, that suggests the markets may be
more vulnerable to shocks and surprises.
In terms of portfolio positioning, we plan to continue
emphasizing sectors that have benefited from increased
liquidity, such as commercial mortgage-backed securities
(CMBS) and non-agency residential mortgage-backed
securities (RMBS). However, the yield advantage over
Treasuries offered by these sectors is not as great as it
was, and with certain central banks potentially raising
rates in the medium term, the liquidity in these areas of
the market could diminish.
Figure 3. High-yield spreads and defaults generally
move in tandem over credit cycles
0
4
8
12
16
20%
0
400
800
1200
1600
2000
’11 ’12 ’13 6/30/14’10’09’08’07’06’05’04’03’02’01’00’99’98’97’96’95’94’93’92’91’90’89’88’87
Defaultrate
Spreads(bps)
1990–91
recession
2001
recession
2007–09
recession
Current spread: 420 bps (as of 6/30/14)
20-year median spread: 523 bps
Average default rate: 3.9%
Today, the gap between spreads
and defaults remains wide, signaling
opportunity for investors.
High-yield default rate
Spread to worst
1Current default rate includes distressed exchanges.
Sources: JPMorgan, High Yield Market Monitor, as of 6/30/14; Putnam Investments.
Spreads have come in from
all-time highs; defaults
remain low.
High-yield default rate*
PUTNAM INVESTMENTS | putnam.com
5
U.S. high-yield and bank loans are still
fundamentally sound
At this stage in the credit cycle, corporate fundamentals
continue to appear positive to us. It is noteworthy that
distressed Texas electric utility TXU Energy, a sizable
issuer in both the high-yield and bank-loan markets,
declared bankruptcy during the quarter, but the event
was anticipated and did not disrupt either market.
Corporations have taken a conservative approach
toward managing their assets and liabilities. Many have
refinanced debt, have lowered their overall borrowing
costs, and are holding substantial cash balances. This
conservatism is evident in many of the more recent
merger-and-acquisition transactions, where deals were
completed using a significant amount of equity, rather
than mostly debt.
High-yield credit spreads — the yield advantage
offered over Treasuries — compressed modestly during
the quarter. By the end of June, spreads were below the
historical average level but still above the all-time low.
However, we continue to view high-yield spreads as
attractive on a loss-adjusted basis, although yields and
prices somewhat less so. Absent an external shock to
the system, we believe the high-yield asset class should
continue generating coupon-like returns in the months
ahead.
Figure 4. Current spreads relative
to historical norms
n Average excess yield over Treasuries
(OAS, 1/1/98–12/31/07)
n Current excess yield over Treasuries
(OAS as of 6/30/14)
Sources: Barclays, Bloomberg, Putnam, as of 6/30/14.
Data is provided for informational use only. Past performance is no guarantee of future results. All spreads are in basis points and measure option-
adjusted yield spread relative to comparable maturity U.S. Treasuries with the exception of non-agency RMBS and mezzanine CMBS, which are
loss-adjusted spreads to swaps calculated using Putnam’s projected assumptions on defaults and severities, and agency IO, which is calculated using
assumptions derived from Putnam’s proprietary prepayment model. Agencies are represented by the Barclays U.S. Agency Index. Agency MBS are
represented by the Barclays U.S. Mortgage Backed Securities Index. Investment-grade corporates are represented by the Barclays U.S. Corporate
Index. High yield is represented by the JPMorgan Developed High Yield Index. AAA CMBS is represented by the Aaa portion of Barclays Investment
Grade CMBS Index; mezzanine CMBS is represented by the same index using the AA, A and BBB components. Average OAS for Mezzanine CMBS
is for the 2000–2007 time period. Emerging-market debt is represented by the Barclays EM Hard Currency Aggregate Index. Non-agency RMBS is
estimated using average market level of a sample of below-investment-grade securities backed by various types of non-agency mortgage collateral
(excluding prime securities). Mezzanine CMBS is estimated from an average spread among baskets of Putnam-monitored new issue and seasoned
mezzanine securities, as well as a synthetic (CMBX) index. Agency IO is estimated from a basket of Putnam-monitored interest-only (IO) and inverse
IO securities. Option-adjusted spread (OAS) measures the yield over duration equivalent Treasuries for securities with different embedded options.
56
130
89
123 123 
150 
129
425
34 35
24
0
200
400
600
800
1000
685
350
100
130
260
500
115
339
104
99
573
Non-agency
 RMBS
CMBS –
Mezzanine
Emerging-
market debt
Agency IOHigh yieldAAA
CMBS
Investment-grade
corporates
Agency
MBS
Agencies
56
130
89
123 123 
150 
129
425
34 35
24
0
200
400
600
800
1000
685
350
100
130
260
500
115
339
104
99
573
Non-agency
 RMBS
CMBS –
Mezzanine
Emerging-
market debt
Agency IOHigh yieldAAA
CMBS
Investment-grade
corporates
Agency
MBS
Agencies
We continue to find compelling investment
opportunities in out-of-benchmark sectors,
given their relative spread levels and solid
underlying fundamentals.
6
Q3 2014 | Fixed-Income Outlook
As for portfolio positioning, we generally increased
high-yield portfolio allocations to Ba-rated bonds while
reducing exposures to Caa-rated securities. In addi-
tion, given the recent underperformance of bank loans
compared with high-yield bonds, we felt loan valuations
had become more attractive, so we increased loan hold-
ings in May and June.
Securitized markets continue to
attract investors
In the second quarter, our mortgage-related credit
strategies performed well, particularly our exposures to
commercial mortgage-backed securities [CMBS] and
non-agency residential mortgage-backed securities
[RMBS]. These sectors were aided by investor demand
for higher-yielding securities, supportive fundamentals,
and the prospect of increased global liquidity in light of
the ECB’s policy announcement.
Figure 5. Excess returns relative
to U.S. Treasuries
0.0%
0.5%
1.0%
1.5%
2.0%
2.5%
3.0%
MBSCMBSU.S. investment-
grade credit
Emerging-markets
debt (EMD)
High yield
Source: Barclays, as of 6/30/14. Past performance is not indicative of future results.
In the context of a 2.66% return for
10-year U.S. Treasuries, most other
sectors outperformed, with high yield
and EMD exhibiting particularly strong
performance.
PUTNAM INVESTMENTS | putnam.com
7
Within CMBS, portfolios generally benefited from solid
security selection in subordinated “mezzanine” bonds
rated BBB/Baa, which offered higher yields at what we
believe are acceptable risks. Within non-agency RMBS,
pay-option adjustable-rate mortgage-backed securities
were the main contributors.
Our prepayment strategies, which we implemented
with securities such as interest-only and inverse interest-
only collateralized mortgage obligations [CMOs],
provided a further boost to relative performance.
Although rates fell during the quarter, the decline wasn’t
great enough to trigger increased refinancing of the
mortgages underlying our CMO holdings. As a result,
continued slow prepayment speeds bolstered the securi-
ties’ values.
Emerging markets: Latin American favorites
In emerging Asian economies, we found debt markets to
be priced fairly, which means they represented relatively
little upside potential. Consequently, we de-emphasized
exposures to this region. In Eastern Europe, the Middle
East, and Africa, we believed geopolitical tensions were
likely to remain high, so we were selective in our approach
to debt markets in this broad region, which also helped
our EM portfolios.
Notably, despite soaring volatility in Russian and Ukrai-
nian asset markets, these areas performed better as the
period wore on. Ukrainian debt became a top performer
relative to other EMD in May as tensions between Ukraine
and Russia — and the spillover anxiety these tensions
caused for a variety of other markets — eased somewhat
on a global stage.
We found the best relative risk-reward potential was
in Latin American debt markets. Importantly, Latin Amer-
ican credit fundamentals did not deteriorate through the
period and thus continued to support government bonds
in this region. Credit spreads were not nearly as wide in
Latin America as in some of the riskier emerging markets,
such as Ukraine, nor were they as tight as in some Asian
markets, which contributed to the upside potential we
perceived in Latin American government debt.
Argentine debt encountered difficulties starting in May
as the approach of a key date in the multi-year legal battle
between Argentina and holdout creditors — investors
who refused to accept a restructured, and less valuable,
form of the country’s debt in the wake of the country’s
prior default — made many investors nervous.
Nevertheless, we think the country represents a posi-
tive long-term value to investors and that the yields are
attractive given the country’s fundamentals. Problems
with creditors pose a major political hurdle, but we
believe the country’s significant agricultural assets and
recent discoveries of natural resources put Argentina in a
better position economically to weather a difficult cycle
for its debt.
Municipal bonds post favorable results
Fundamental and technical (supply/demand) factors
contributed to a very hospitable environment for
municipal bonds during the second quarter. Falling rates,
lower-trending volatility in both equity and bond markets,
ECB easing, and the U.S. Fed’s affirmation of its commit-
ment to low rates all converged as helpful factors. By the
end of the quarter, the yield on the benchmark 10-year
Treasury note had fallen from 2.72% to 2.53%, and prices
rose commensurately.
Municipal bonds followed a similar path as Treasuries
during the rally but had other tailwinds propelling their
prices higher. Municipal bond issuance, which has been
trending down in recent years, continued at a modest
pace, and this was beneficial for prices. The declining
volume of new long-term municipal bonds coming to
market is due, in part, to state and local governments
undertaking fewer projects while turning their fiscal
attention toward funding employee pensions and other
fixed costs in their budgets. This modest level of supply
has not kept pace with the solid demand from traditional
tax-sensitive retail investors. Crossover taxable buyers
have also been drawn to the competitive yields and
attractive relative value offered by this asset class rather
than its tax benefit.
8
Q3 2014 | Fixed-Income Outlook
Figure 6: Muni credit spreads have
narrowed from historical
wides, but remain attractive
Municipal bond spreads by quality rating
AA A BBB
0
100
200
300
400
500
6/30/14201320122011201020092008200720062005200420032002200120001999
Source: Putnam, as of 6/30/14. Credit ratings are as determined by Putnam.
The most attractive relative values
continue to populate in the BBB-rated
segment of the muni market.
Meanwhile, inflows to tax-free mutual funds, an impor-
tant measure of demand, remained positive during the
second quarter of 2014 — primarily in tax-free high-yield
bond funds. Thus, with interest rates still low and funda-
mental credit quality improving, there has been greater
investor appetite for the yields offered by the relatively
riskier municipal bonds further out on the maturity
spectrum as well as for those in the lower-rated, higher-
yielding sectors.
Despite the strong start for municipal bonds in 2014
and our belief that the credit outlook for municipal bonds
appears solid given improvement in U.S. growth, we still
remain cautious and believe that there could be some
volatility surrounding supply/demand factors and interest
rates in the coming months. With regard to tax policy, we
think comprehensive tax reform is unlikely at least until
after the 2014 mid-term elections.
PUTNAM INVESTMENTS | putnam.com
9
Currency outlook
Within active currency strategies, we now favor a small
overweight position in the U.S. dollar. The outcome of
the June FOMC meeting was largely as expected: The
taper continued, the post-meeting statement was little
changed, the 2015 and 2016 interest-rate forecasts were
revised somewhat higher and the longer-term forecast
somewhat lower, and Yellen’s press conference continued
to indicate no urgency to step back from highly accom-
modative monetary policy. As a result, future monetary
policy remains very much data dependent. If growth and
inflation rebound soundly, as we expect, the Fed’s view
is likely to be challenged and rate hikes will begin to get
priced in sooner, which should be supportive of the U.S.
dollar over the course of the year.
The euro position remains an underweight. Over
the past month, the ECB agreed to cut its deposit
rate below zero, provide new four-year long-term
refinancing operation loans in September and December,
stop sterilizing its Securities Markets Program bond
purchases, and work on options for buying private-sector
asset-backed securities in future. All of these measures
appear sufficient to cap the single currency in its current
1.35–1.40 range against the dollar, and the anticipated
developments in the U.S. story should help to push this
value down over the coming months.
The British pound sterling positioning remains a
modest overweight. Bank of England Governor Mark
Carney signaled in a June speech that interest rates may
need to rise earlier than markets were anticipating. He
subsequently highlighted that the economy continues to
have more slack to absorb before interest rates need to
rise. Also, while the pace of job creation has been strong,
wage growth had been softer than expected. This some-
what puzzling outlook should be viewed as preparing the
market for earlier tightening but at a more gradual pace,
and eventually arriving at a lower terminal rate than past
tightening cycles.
A quite modest underweight position to the Japanese
yen remains after an extended period of being neutral.
We expect that the Bank of Japan will have to do more,
which should provide further impetus for the U.S. dollar
to move higher versus the yen. However, Bank of Japan
Governor Haruhiko Kuroda remains optimistic around
the recovery in the economy and the trajectory of recent
inflation data. He remains clear that if growth is weaker
than expected and inflation does not accelerate, then the
BoJ will do more.
10
Q3 2014 | Fixed-Income Outlook
Agencymortgage-backedsecurities are represented by the Barclays U.S. Mortgage
Backed Securities Index, which covers agency mortgage-backed pass-through
securities (both fixed-rate and hybrid ARM) issued by Ginnie Mae (GNMA), Fannie Mae
(FNMA), and Freddie Mac (FHLMC).
Commercialmortgage-backedsecurities are represented by the Barclays U.S.
CMBS Investment Grade Index, which measures the market of commercial mortgage-
backed securities with a minimum deal size of $500 million. The two subcomponents
of the U.S. CMBS Investment Grade Index are U.S. aggregate-eligible securities and
non-eligible securities. To be included in the U.S. Aggregate Index, the securities must
meet the guidelines for ERISA eligibility.
Emerging-marketdebt is represented by the JPMorgan Emerging Markets Global
Diversified Index, which is composed of U.S. dollar-denominated Brady bonds,
eurobonds, traded loans, and local market debt instruments issued by sovereign
and quasi-sovereign entities.
Eurozonegovernment is represented by the Barclays European Aggregate Bond
Index, which tracks fixed-rate, investment-grade securities issued in the following
European currencies: euro, Norwegian krone, Danish krone, Swedish krona, Czech
koruna, Hungarian forint, Polish zloty, and Swiss franc.
Globalhighyield is represented by the BofA Merrill Lynch Global High Yield
Constrained Index, an unmanaged index of global high-yield fixed-income securities.
Japangovernment is represented by the Barclays Japanese Aggregate Bond Index,
a broad-based investment-grade benchmark consisting of fixed-rate Japanese
yen-denominated securities.
Tax-exempthighyieldisrepresentedbytheBarclaysMunicipalBondHighYieldIndex,
which consists of below-investment-grade or unrated bonds with outstanding par
valuesofatleast$3millionandatleastoneyearremaininguntiltheirmaturitydates.
U.K.government is represented by the Barclays Sterling Aggregate Bond Index,
which contains fixed-rate, investment-grade, sterling-denominated securities,
including gilt and non-gilt bonds.
U.S.floating-ratebankloans are represented by the SP/LSTA Leveraged Loan
Index, an unmanaged index of U.S. leveraged loans.
U.S.governmentandagencydebt is represented by the Barclays U.S. Aggregate
Bond Index, an unmanaged index of U.S. investment-grade fixed-income securities.
U.S.investment-gradecorporatedebt is represented by the Barclays U.S. Corporate
Index, a broad-based benchmark that measures the U.S. taxable investment-grade
corporate bond market.
U.S.taxexempt is represented by the Barclays Municipal Bond Index, an unmanaged
index of long-term fixed-rate investment-grade tax-exempt bonds.
You cannot invest directly in an index.
This material is provided for limited purposes. It is not intended as an offer or solicitation for the purchase or sale of any financial
instrument, or any Putnam product or strategy. References to specific securities, asset classes, and financial markets are for illustrative
purposes only and are not intended to be, and should not be interpreted as, recommendations or investment advice. The opinions
expressed in this article represent the current, good-faith views of the author(s) at the time of publication. The views are provided for
informational purposes only and are subject to change. This material does not take into account any investor’s particular investment
objectives, strategies, tax status, or investment horizon. The views and strategies described herein may not be suitable for all investors.
Investors should consult a financial advisor for advice suited to their individual financial needs. Putnam Investments cannot guarantee
the accuracy or completeness of any statements or data contained in the article. Predictions, opinions, and other information contained
in this article are subject to change. Any forward-looking statements speak only as of the date they are made, and Putnam assumes
no duty to update them. Forward-looking statements are subject to numerous assumptions, risks, and uncertainties. Actual results
could differ materially from those anticipated. Past performance is not a guarantee of future results. As with any investment, there is a
potential for profit as well as the possibility of loss.
The information provided relates to Putnam Investments and its affiliates, which include The Putnam Advisory Company, LLC and
Putnam Investments Limited®.
Prepared for use in Canada by Putnam Investments Inc. [Investissements Putnam Inc.] (o/a Putnam Management in Manitoba).
Where permitted, advisory services are provided in Canada by Putnam Investments Inc. [Investissements Putnam Inc.] (o/a Putnam
Management in Manitoba) and its affiliate, The Putnam Advisory Company, LLC.
PUTNAM INVESTMENTS | putnam.com
11
Putnam’s veteran fixed-income
team offers a depth and breadth
of insight and an independent
view of risk.
Successful investing in today’s markets requires
a broad-based approach, the flexibility to exploit
a range of sectors and investment opportunities,
and a keen understanding of the complex
global interrelationships that drive the markets.
That is why Putnam has more than 70 fixed-
income professionals focusing on delivering
comprehensive coverage of every aspect of the
fixed-income markets, based not only on sector,
but also on the broad sources of risk — and
opportunities — most likely to drive returns.
D. William Kohli
Co-Head of Fixed Income
Global Strategies
Investing since 1987
Joined Putnam in 1994
Michael V. Salm
Co-Head of Fixed Income
Liquid Markets and Securitized Products
Investing since 1989
Joined Putnam in 1997
Paul D. Scanlon, CFA
Co-Head of Fixed Income
Global Credit
Investing since 1986
Joined Putnam in 1999
Consider these risks before investing: International investing involves certain risks, such as currency fluctuations,
economic instability, and political developments. Additional risks may be associated with emerging-market securities,
including illiquidity and volatility. Lower-rated bonds may offer higher yields in return for more risk. Funds that invest
in government securities are not guaranteed. Mortgage-backed securities are subject to prepayment risk. Derivatives
also involve the risk, in the case of many over-the-counter instruments, of the potential inability to terminate or sell
derivatives positions and the potential failure of the other party to the instrument to meet its obligations.
Bond investments are subject to interest-rate risk, which means the prices of the funds’ bond investments are likely to
fall if interest rates rise. Bond investments also are subject to credit risk, which is the risk that the issuer of the bond may
default on payment of interest or principal. Interest-rate risk is generally greater for longer-term bonds, and credit risk
is generally greater for below-investment-grade bonds, which may be considered speculative. Unlike bonds, funds that
invest in bonds have ongoing fees and expenses.
You can lose money by investing in a mutual fund.
If you are a U.S. retail investor, please request a prospectus, or a summary prospectus if available, from your
financial representative or by calling Putnam at 1-800-225-1581. The prospectus includes investment objectives,
risks, fees, expenses, and other information that you should read and consider carefully before investing.
In the United States, mutual funds are distributed by Putnam Retail Management.
PUTNAM INVESTMENTS | putnam.com CM0200 289088 7/14
Market update
putnam.com/markets
Research
putnam.com/perspectives
putnam.com/white-papers
Find us

More Related Content

What's hot

Putnam Capital Markets Outlook Q4 2013
Putnam Capital Markets Outlook Q4 2013Putnam Capital Markets Outlook Q4 2013
Putnam Capital Markets Outlook Q4 2013Putnam Investments
 
Investment Mid year outlook by Linked Investments, Ltd
Investment Mid year outlook by Linked Investments, LtdInvestment Mid year outlook by Linked Investments, Ltd
Investment Mid year outlook by Linked Investments, LtdLinked Investments, Ltd.
 
Investment outlook 2022
Investment outlook 2022 Investment outlook 2022
Investment outlook 2022 LaThoa
 
Signs of an impending stock market crash
Signs of an impending stock market crashSigns of an impending stock market crash
Signs of an impending stock market crashSwapnilRege2
 
BlackRock: 2014 Outlook The List - What to Know, What to Do
BlackRock: 2014 Outlook The List - What to Know, What to DoBlackRock: 2014 Outlook The List - What to Know, What to Do
BlackRock: 2014 Outlook The List - What to Know, What to DoEcon Matters
 
A Checklist for Wanna-be Helicopter Pilots
A Checklist for Wanna-be Helicopter PilotsA Checklist for Wanna-be Helicopter Pilots
A Checklist for Wanna-be Helicopter PilotsAndrea Iannelli
 
Investor Compass - Portfolio Manager Viewpoints
Investor Compass - Portfolio Manager ViewpointsInvestor Compass - Portfolio Manager Viewpoints
Investor Compass - Portfolio Manager Viewpointsadvisorshares
 
7 wells fargo 2015 mid-year outlook - turning points
7 wells fargo 2015 mid-year outlook - turning points7 wells fargo 2015 mid-year outlook - turning points
7 wells fargo 2015 mid-year outlook - turning points123jumpad
 
FI Insights V17I1 Print Version
FI Insights V17I1 Print VersionFI Insights V17I1 Print Version
FI Insights V17I1 Print VersionDean Miller
 
Brent woyat q2 2014 pimg commentary jul2014
Brent woyat q2 2014 pimg commentary jul2014Brent woyat q2 2014 pimg commentary jul2014
Brent woyat q2 2014 pimg commentary jul2014bwoyat
 
Whats Ahead In 2012 - An Investment Perspective (Spring Update)
Whats Ahead In 2012 - An Investment Perspective (Spring Update)Whats Ahead In 2012 - An Investment Perspective (Spring Update)
Whats Ahead In 2012 - An Investment Perspective (Spring Update)scottmeek
 
Capital Market 1st Quarter 2010
Capital Market 1st Quarter 2010Capital Market 1st Quarter 2010
Capital Market 1st Quarter 2010pospime
 
2013.10.10 accuvest bpv-q4
2013.10.10 accuvest bpv-q42013.10.10 accuvest bpv-q4
2013.10.10 accuvest bpv-q4advisorshares
 
2013’s Top 10 Lessons for Investors from LPL Financial Research
2013’s Top 10 Lessons for Investors from LPL Financial Research2013’s Top 10 Lessons for Investors from LPL Financial Research
2013’s Top 10 Lessons for Investors from LPL Financial ResearchJP Marketing | NE
 
LPL Market Insight 1Q14: Stocks Cool Off as U.S. Economy Weathers Deep Freeze
LPL Market Insight 1Q14: Stocks Cool Off as U.S. Economy Weathers Deep FreezeLPL Market Insight 1Q14: Stocks Cool Off as U.S. Economy Weathers Deep Freeze
LPL Market Insight 1Q14: Stocks Cool Off as U.S. Economy Weathers Deep FreezeMarc Freedman CFP® at Freedman Financial
 
Current Thinking, Q1 2015
Current Thinking, Q1 2015Current Thinking, Q1 2015
Current Thinking, Q1 2015Kevin Lenox
 
clear channel swap
clear channel swapclear channel swap
clear channel swapDylan Bateh
 

What's hot (20)

Putnam Capital Markets Outlook Q4 2013
Putnam Capital Markets Outlook Q4 2013Putnam Capital Markets Outlook Q4 2013
Putnam Capital Markets Outlook Q4 2013
 
Investment Mid year outlook by Linked Investments, Ltd
Investment Mid year outlook by Linked Investments, LtdInvestment Mid year outlook by Linked Investments, Ltd
Investment Mid year outlook by Linked Investments, Ltd
 
Investment outlook 2022
Investment outlook 2022 Investment outlook 2022
Investment outlook 2022
 
Signs of an impending stock market crash
Signs of an impending stock market crashSigns of an impending stock market crash
Signs of an impending stock market crash
 
TAP QuarterlyLetter 201603
TAP QuarterlyLetter 201603TAP QuarterlyLetter 201603
TAP QuarterlyLetter 201603
 
BlackRock: 2014 Outlook The List - What to Know, What to Do
BlackRock: 2014 Outlook The List - What to Know, What to DoBlackRock: 2014 Outlook The List - What to Know, What to Do
BlackRock: 2014 Outlook The List - What to Know, What to Do
 
A Checklist for Wanna-be Helicopter Pilots
A Checklist for Wanna-be Helicopter PilotsA Checklist for Wanna-be Helicopter Pilots
A Checklist for Wanna-be Helicopter Pilots
 
2010 outlook
2010 outlook2010 outlook
2010 outlook
 
Investor Compass - Portfolio Manager Viewpoints
Investor Compass - Portfolio Manager ViewpointsInvestor Compass - Portfolio Manager Viewpoints
Investor Compass - Portfolio Manager Viewpoints
 
7 wells fargo 2015 mid-year outlook - turning points
7 wells fargo 2015 mid-year outlook - turning points7 wells fargo 2015 mid-year outlook - turning points
7 wells fargo 2015 mid-year outlook - turning points
 
FI Insights V17I1 Print Version
FI Insights V17I1 Print VersionFI Insights V17I1 Print Version
FI Insights V17I1 Print Version
 
Brent woyat q2 2014 pimg commentary jul2014
Brent woyat q2 2014 pimg commentary jul2014Brent woyat q2 2014 pimg commentary jul2014
Brent woyat q2 2014 pimg commentary jul2014
 
Whats Ahead In 2012 - An Investment Perspective (Spring Update)
Whats Ahead In 2012 - An Investment Perspective (Spring Update)Whats Ahead In 2012 - An Investment Perspective (Spring Update)
Whats Ahead In 2012 - An Investment Perspective (Spring Update)
 
2013 Mid Year Outlook
2013 Mid Year Outlook2013 Mid Year Outlook
2013 Mid Year Outlook
 
Capital Market 1st Quarter 2010
Capital Market 1st Quarter 2010Capital Market 1st Quarter 2010
Capital Market 1st Quarter 2010
 
2013.10.10 accuvest bpv-q4
2013.10.10 accuvest bpv-q42013.10.10 accuvest bpv-q4
2013.10.10 accuvest bpv-q4
 
2013’s Top 10 Lessons for Investors from LPL Financial Research
2013’s Top 10 Lessons for Investors from LPL Financial Research2013’s Top 10 Lessons for Investors from LPL Financial Research
2013’s Top 10 Lessons for Investors from LPL Financial Research
 
LPL Market Insight 1Q14: Stocks Cool Off as U.S. Economy Weathers Deep Freeze
LPL Market Insight 1Q14: Stocks Cool Off as U.S. Economy Weathers Deep FreezeLPL Market Insight 1Q14: Stocks Cool Off as U.S. Economy Weathers Deep Freeze
LPL Market Insight 1Q14: Stocks Cool Off as U.S. Economy Weathers Deep Freeze
 
Current Thinking, Q1 2015
Current Thinking, Q1 2015Current Thinking, Q1 2015
Current Thinking, Q1 2015
 
clear channel swap
clear channel swapclear channel swap
clear channel swap
 

Similar to Putnam Perspectives: Fixed-Income Outlook Q3 2014

Quarterly Investment Outlook - May 2015
Quarterly Investment Outlook - May 2015Quarterly Investment Outlook - May 2015
Quarterly Investment Outlook - May 2015JonGrant01
 
4Q2014-In-a-Bond-Bind
4Q2014-In-a-Bond-Bind4Q2014-In-a-Bond-Bind
4Q2014-In-a-Bond-BindRon New
 
BT SFC 2015
BT SFC 2015BT SFC 2015
BT SFC 2015Tiffany Gui
 
Economic Outlook | LIC Preneed Forum 2012
Economic Outlook  | LIC Preneed Forum 2012Economic Outlook  | LIC Preneed Forum 2012
Economic Outlook | LIC Preneed Forum 2012Strategic Asset Alliance
 
High Yield Bonds - The Rise of the Fallen
High Yield Bonds - The Rise of the FallenHigh Yield Bonds - The Rise of the Fallen
High Yield Bonds - The Rise of the FallenAranca
 
Accenture Spend Trends Report Q1 2015
Accenture Spend Trends Report Q1 2015Accenture Spend Trends Report Q1 2015
Accenture Spend Trends Report Q1 2015Accenture Operations
 
Accenture Spend Trends Report Q1 2015
Accenture Spend Trends Report Q1 2015Accenture Spend Trends Report Q1 2015
Accenture Spend Trends Report Q1 2015accenture
 
Blackrock 2015 outlook rpt
Blackrock 2015 outlook rptBlackrock 2015 outlook rpt
Blackrock 2015 outlook rptLance Conn
 
Economic Prospects Challenges And Opportunities Lloyds Tsb Trevor Williams
Economic Prospects Challenges And Opportunities Lloyds Tsb Trevor WilliamsEconomic Prospects Challenges And Opportunities Lloyds Tsb Trevor Williams
Economic Prospects Challenges And Opportunities Lloyds Tsb Trevor WilliamsRoberto Grossi
 
Pictet Asset Management Perspectives
Pictet Asset Management PerspectivesPictet Asset Management Perspectives
Pictet Asset Management PerspectivesForward Management
 
US Fed rate hike in September 2015: Who will be the top 4 winners and losers?
US Fed rate hike in September 2015: Who will be the top 4 winners and losers?US Fed rate hike in September 2015: Who will be the top 4 winners and losers?
US Fed rate hike in September 2015: Who will be the top 4 winners and losers?Aranca
 
RSM_The_Real_Economy_Global_ENG_UK.PDF
RSM_The_Real_Economy_Global_ENG_UK.PDFRSM_The_Real_Economy_Global_ENG_UK.PDF
RSM_The_Real_Economy_Global_ENG_UK.PDFDavid Carlisle
 
Dealing With Divergences - Blackrock 2015 Outlook
Dealing With Divergences - Blackrock 2015 OutlookDealing With Divergences - Blackrock 2015 Outlook
Dealing With Divergences - Blackrock 2015 OutlookJoĂŁo Pinto
 
01.2015 - The 2014 Surprises - Oil and Interest Rates
01.2015 - The 2014 Surprises - Oil and Interest Rates01.2015 - The 2014 Surprises - Oil and Interest Rates
01.2015 - The 2014 Surprises - Oil and Interest RatesAdam Phillips
 
Current Thinking, Q1 2014
Current Thinking, Q1 2014Current Thinking, Q1 2014
Current Thinking, Q1 2014Kevin Lenox
 
Finlight Research - Market perspectives - Jan 2015
Finlight Research - Market perspectives - Jan 2015Finlight Research - Market perspectives - Jan 2015
Finlight Research - Market perspectives - Jan 2015Zouheir Ben Tamarout
 
April Commentary
April CommentaryApril Commentary
April Commentaryjeffbrownct
 
CM15007 Compendium July
CM15007 Compendium JulyCM15007 Compendium July
CM15007 Compendium JulyDerek Phelan
 
How strong a comeback for inflation?
How strong a comeback for inflation?How strong a comeback for inflation?
How strong a comeback for inflation?Jurgen Vluijmans
 

Similar to Putnam Perspectives: Fixed-Income Outlook Q3 2014 (20)

Quarterly Investment Outlook - May 2015
Quarterly Investment Outlook - May 2015Quarterly Investment Outlook - May 2015
Quarterly Investment Outlook - May 2015
 
4Q2014-In-a-Bond-Bind
4Q2014-In-a-Bond-Bind4Q2014-In-a-Bond-Bind
4Q2014-In-a-Bond-Bind
 
BT SFC 2015
BT SFC 2015BT SFC 2015
BT SFC 2015
 
Economic Outlook | LIC Preneed Forum 2012
Economic Outlook  | LIC Preneed Forum 2012Economic Outlook  | LIC Preneed Forum 2012
Economic Outlook | LIC Preneed Forum 2012
 
High Yield Bonds - The Rise of the Fallen
High Yield Bonds - The Rise of the FallenHigh Yield Bonds - The Rise of the Fallen
High Yield Bonds - The Rise of the Fallen
 
Accenture Spend Trends Report Q1 2015
Accenture Spend Trends Report Q1 2015Accenture Spend Trends Report Q1 2015
Accenture Spend Trends Report Q1 2015
 
Accenture Spend Trends Report Q1 2015
Accenture Spend Trends Report Q1 2015Accenture Spend Trends Report Q1 2015
Accenture Spend Trends Report Q1 2015
 
Blackrock 2015 outlook rpt
Blackrock 2015 outlook rptBlackrock 2015 outlook rpt
Blackrock 2015 outlook rpt
 
Economic Prospects Challenges And Opportunities Lloyds Tsb Trevor Williams
Economic Prospects Challenges And Opportunities Lloyds Tsb Trevor WilliamsEconomic Prospects Challenges And Opportunities Lloyds Tsb Trevor Williams
Economic Prospects Challenges And Opportunities Lloyds Tsb Trevor Williams
 
Pictet Asset Management Perspectives
Pictet Asset Management PerspectivesPictet Asset Management Perspectives
Pictet Asset Management Perspectives
 
US Fed rate hike in September 2015: Who will be the top 4 winners and losers?
US Fed rate hike in September 2015: Who will be the top 4 winners and losers?US Fed rate hike in September 2015: Who will be the top 4 winners and losers?
US Fed rate hike in September 2015: Who will be the top 4 winners and losers?
 
RSM_The_Real_Economy_Global_ENG_UK.PDF
RSM_The_Real_Economy_Global_ENG_UK.PDFRSM_The_Real_Economy_Global_ENG_UK.PDF
RSM_The_Real_Economy_Global_ENG_UK.PDF
 
Dealing With Divergences - Blackrock 2015 Outlook
Dealing With Divergences - Blackrock 2015 OutlookDealing With Divergences - Blackrock 2015 Outlook
Dealing With Divergences - Blackrock 2015 Outlook
 
01.2015 - The 2014 Surprises - Oil and Interest Rates
01.2015 - The 2014 Surprises - Oil and Interest Rates01.2015 - The 2014 Surprises - Oil and Interest Rates
01.2015 - The 2014 Surprises - Oil and Interest Rates
 
Current Thinking, Q1 2014
Current Thinking, Q1 2014Current Thinking, Q1 2014
Current Thinking, Q1 2014
 
Finlight Research - Market perspectives - Jan 2015
Finlight Research - Market perspectives - Jan 2015Finlight Research - Market perspectives - Jan 2015
Finlight Research - Market perspectives - Jan 2015
 
April Commentary
April CommentaryApril Commentary
April Commentary
 
FNB
FNBFNB
FNB
 
CM15007 Compendium July
CM15007 Compendium JulyCM15007 Compendium July
CM15007 Compendium July
 
How strong a comeback for inflation?
How strong a comeback for inflation?How strong a comeback for inflation?
How strong a comeback for inflation?
 

More from Putnam Investments

The Parquet by the numbers
The Parquet by the numbersThe Parquet by the numbers
The Parquet by the numbersPutnam Investments
 
Putnam Investment's 2015 Financial Advisors and Social Media Survey
Putnam Investment's 2015 Financial Advisors and Social Media SurveyPutnam Investment's 2015 Financial Advisors and Social Media Survey
Putnam Investment's 2015 Financial Advisors and Social Media SurveyPutnam Investments
 
Putnam Social Media Survey 2014
Putnam Social Media Survey 2014Putnam Social Media Survey 2014
Putnam Social Media Survey 2014Putnam Investments
 
Who is the social advisor?
Who is the social advisor?Who is the social advisor?
Who is the social advisor?Putnam Investments
 
Putnam Lifetime Income Survey 2013
Putnam Lifetime Income Survey 2013Putnam Lifetime Income Survey 2013
Putnam Lifetime Income Survey 2013Putnam Investments
 
Putnam Fixed Income Outlook Q4 2013
Putnam Fixed Income Outlook Q4 2013Putnam Fixed Income Outlook Q4 2013
Putnam Fixed Income Outlook Q4 2013Putnam Investments
 
Putnam Social Media Survey
Putnam Social Media SurveyPutnam Social Media Survey
Putnam Social Media SurveyPutnam Investments
 
Fostering innovation to improve retirement security
Fostering innovation to improve retirement securityFostering innovation to improve retirement security
Fostering innovation to improve retirement securityPutnam Investments
 
Putnam municipal bond funds Q&A Q2 2013
Putnam municipal bond funds Q&A Q2 2013Putnam municipal bond funds Q&A Q2 2013
Putnam municipal bond funds Q&A Q2 2013Putnam Investments
 
Putnam Global Income Trust Q&A Q2 2013
Putnam Global Income Trust Q&A Q2 2013Putnam Global Income Trust Q&A Q2 2013
Putnam Global Income Trust Q&A Q2 2013Putnam Investments
 
Putnam Equity Income Fund Q&A Q2 2013
Putnam Equity Income Fund Q&A Q2 2013Putnam Equity Income Fund Q&A Q2 2013
Putnam Equity Income Fund Q&A Q2 2013Putnam Investments
 
Putnam Income Fund Q&A Q2 2013
Putnam Income Fund Q&A Q2 2013Putnam Income Fund Q&A Q2 2013
Putnam Income Fund Q&A Q2 2013Putnam Investments
 
Putnam Dynamic Risk Allocation Fund Q&A Q2 2013
Putnam Dynamic Risk Allocation Fund Q&A Q2 2013Putnam Dynamic Risk Allocation Fund Q&A Q2 2013
Putnam Dynamic Risk Allocation Fund Q&A Q2 2013Putnam Investments
 
Putnam Absolute Return Funds Q&A Q2 2013
Putnam Absolute Return Funds Q&A Q2 2013Putnam Absolute Return Funds Q&A Q2 2013
Putnam Absolute Return Funds Q&A Q2 2013Putnam Investments
 
Robert L. Reynolds: New thinking, new solutions
Robert L. Reynolds: New thinking, new solutionsRobert L. Reynolds: New thinking, new solutions
Robert L. Reynolds: New thinking, new solutionsPutnam Investments
 
Putnam Lifetime Income Scores III
Putnam Lifetime Income Scores IIIPutnam Lifetime Income Scores III
Putnam Lifetime Income Scores IIIPutnam Investments
 
New Thinking, New Solutions
New Thinking, New Solutions New Thinking, New Solutions
New Thinking, New Solutions Putnam Investments
 
Taxes after the fiscal cliff: Planning opportunities in 2013
Taxes after the fiscal cliff: Planning opportunities in 2013Taxes after the fiscal cliff: Planning opportunities in 2013
Taxes after the fiscal cliff: Planning opportunities in 2013Putnam Investments
 
Putnam Investments: You can take it with you
Putnam Investments: You can take it with youPutnam Investments: You can take it with you
Putnam Investments: You can take it with youPutnam Investments
 
Putnam Investments: Pathway to Independence
Putnam Investments: Pathway to IndependencePutnam Investments: Pathway to Independence
Putnam Investments: Pathway to IndependencePutnam Investments
 

More from Putnam Investments (20)

The Parquet by the numbers
The Parquet by the numbersThe Parquet by the numbers
The Parquet by the numbers
 
Putnam Investment's 2015 Financial Advisors and Social Media Survey
Putnam Investment's 2015 Financial Advisors and Social Media SurveyPutnam Investment's 2015 Financial Advisors and Social Media Survey
Putnam Investment's 2015 Financial Advisors and Social Media Survey
 
Putnam Social Media Survey 2014
Putnam Social Media Survey 2014Putnam Social Media Survey 2014
Putnam Social Media Survey 2014
 
Who is the social advisor?
Who is the social advisor?Who is the social advisor?
Who is the social advisor?
 
Putnam Lifetime Income Survey 2013
Putnam Lifetime Income Survey 2013Putnam Lifetime Income Survey 2013
Putnam Lifetime Income Survey 2013
 
Putnam Fixed Income Outlook Q4 2013
Putnam Fixed Income Outlook Q4 2013Putnam Fixed Income Outlook Q4 2013
Putnam Fixed Income Outlook Q4 2013
 
Putnam Social Media Survey
Putnam Social Media SurveyPutnam Social Media Survey
Putnam Social Media Survey
 
Fostering innovation to improve retirement security
Fostering innovation to improve retirement securityFostering innovation to improve retirement security
Fostering innovation to improve retirement security
 
Putnam municipal bond funds Q&A Q2 2013
Putnam municipal bond funds Q&A Q2 2013Putnam municipal bond funds Q&A Q2 2013
Putnam municipal bond funds Q&A Q2 2013
 
Putnam Global Income Trust Q&A Q2 2013
Putnam Global Income Trust Q&A Q2 2013Putnam Global Income Trust Q&A Q2 2013
Putnam Global Income Trust Q&A Q2 2013
 
Putnam Equity Income Fund Q&A Q2 2013
Putnam Equity Income Fund Q&A Q2 2013Putnam Equity Income Fund Q&A Q2 2013
Putnam Equity Income Fund Q&A Q2 2013
 
Putnam Income Fund Q&A Q2 2013
Putnam Income Fund Q&A Q2 2013Putnam Income Fund Q&A Q2 2013
Putnam Income Fund Q&A Q2 2013
 
Putnam Dynamic Risk Allocation Fund Q&A Q2 2013
Putnam Dynamic Risk Allocation Fund Q&A Q2 2013Putnam Dynamic Risk Allocation Fund Q&A Q2 2013
Putnam Dynamic Risk Allocation Fund Q&A Q2 2013
 
Putnam Absolute Return Funds Q&A Q2 2013
Putnam Absolute Return Funds Q&A Q2 2013Putnam Absolute Return Funds Q&A Q2 2013
Putnam Absolute Return Funds Q&A Q2 2013
 
Robert L. Reynolds: New thinking, new solutions
Robert L. Reynolds: New thinking, new solutionsRobert L. Reynolds: New thinking, new solutions
Robert L. Reynolds: New thinking, new solutions
 
Putnam Lifetime Income Scores III
Putnam Lifetime Income Scores IIIPutnam Lifetime Income Scores III
Putnam Lifetime Income Scores III
 
New Thinking, New Solutions
New Thinking, New Solutions New Thinking, New Solutions
New Thinking, New Solutions
 
Taxes after the fiscal cliff: Planning opportunities in 2013
Taxes after the fiscal cliff: Planning opportunities in 2013Taxes after the fiscal cliff: Planning opportunities in 2013
Taxes after the fiscal cliff: Planning opportunities in 2013
 
Putnam Investments: You can take it with you
Putnam Investments: You can take it with youPutnam Investments: You can take it with you
Putnam Investments: You can take it with you
 
Putnam Investments: Pathway to Independence
Putnam Investments: Pathway to IndependencePutnam Investments: Pathway to Independence
Putnam Investments: Pathway to Independence
 

Recently uploaded

03_Emmanuel Ndiaye_Degroof Petercam.pptx
03_Emmanuel Ndiaye_Degroof Petercam.pptx03_Emmanuel Ndiaye_Degroof Petercam.pptx
03_Emmanuel Ndiaye_Degroof Petercam.pptxFinTech Belgium
 
05_Annelore Lenoir_Docbyte_MeetupDora&Cybersecurity.pptx
05_Annelore Lenoir_Docbyte_MeetupDora&Cybersecurity.pptx05_Annelore Lenoir_Docbyte_MeetupDora&Cybersecurity.pptx
05_Annelore Lenoir_Docbyte_MeetupDora&Cybersecurity.pptxFinTech Belgium
 
High Class Call Girls Nashik Maya 7001305949 Independent Escort Service Nashik
High Class Call Girls Nashik Maya 7001305949 Independent Escort Service NashikHigh Class Call Girls Nashik Maya 7001305949 Independent Escort Service Nashik
High Class Call Girls Nashik Maya 7001305949 Independent Escort Service NashikCall Girls in Nagpur High Profile
 
Gurley shaw Theory of Monetary Economics.
Gurley shaw Theory of Monetary Economics.Gurley shaw Theory of Monetary Economics.
Gurley shaw Theory of Monetary Economics.Vinodha Devi
 
High Class Call Girls Nagpur Grishma Call 7001035870 Meet With Nagpur Escorts
High Class Call Girls Nagpur Grishma Call 7001035870 Meet With Nagpur EscortsHigh Class Call Girls Nagpur Grishma Call 7001035870 Meet With Nagpur Escorts
High Class Call Girls Nagpur Grishma Call 7001035870 Meet With Nagpur Escortsranjana rawat
 
The Economic History of the U.S. Lecture 26.pdf
The Economic History of the U.S. Lecture 26.pdfThe Economic History of the U.S. Lecture 26.pdf
The Economic History of the U.S. Lecture 26.pdfGale Pooley
 
Call Girls Service Nagpur Maya Call 7001035870 Meet With Nagpur Escorts
Call Girls Service Nagpur Maya Call 7001035870 Meet With Nagpur EscortsCall Girls Service Nagpur Maya Call 7001035870 Meet With Nagpur Escorts
Call Girls Service Nagpur Maya Call 7001035870 Meet With Nagpur Escortsranjana rawat
 
02_Fabio Colombo_Accenture_MeetupDora&Cybersecurity.pptx
02_Fabio Colombo_Accenture_MeetupDora&Cybersecurity.pptx02_Fabio Colombo_Accenture_MeetupDora&Cybersecurity.pptx
02_Fabio Colombo_Accenture_MeetupDora&Cybersecurity.pptxFinTech Belgium
 
20240429 Calibre April 2024 Investor Presentation.pdf
20240429 Calibre April 2024 Investor Presentation.pdf20240429 Calibre April 2024 Investor Presentation.pdf
20240429 Calibre April 2024 Investor Presentation.pdfAdnet Communications
 
Indore Real Estate Market Trends Report.pdf
Indore Real Estate Market Trends Report.pdfIndore Real Estate Market Trends Report.pdf
Indore Real Estate Market Trends Report.pdfSaviRakhecha1
 
Stock Market Brief Deck (Under Pressure).pdf
Stock Market Brief Deck (Under Pressure).pdfStock Market Brief Deck (Under Pressure).pdf
Stock Market Brief Deck (Under Pressure).pdfMichael Silva
 
(ANIKA) Budhwar Peth Call Girls Just Call 7001035870 [ Cash on Delivery ] Pun...
(ANIKA) Budhwar Peth Call Girls Just Call 7001035870 [ Cash on Delivery ] Pun...(ANIKA) Budhwar Peth Call Girls Just Call 7001035870 [ Cash on Delivery ] Pun...
(ANIKA) Budhwar Peth Call Girls Just Call 7001035870 [ Cash on Delivery ] Pun...ranjana rawat
 
Log your LOA pain with Pension Lab's brilliant campaign
Log your LOA pain with Pension Lab's brilliant campaignLog your LOA pain with Pension Lab's brilliant campaign
Log your LOA pain with Pension Lab's brilliant campaignHenry Tapper
 
00_Main ppt_MeetupDORA&CyberSecurity.pptx
00_Main ppt_MeetupDORA&CyberSecurity.pptx00_Main ppt_MeetupDORA&CyberSecurity.pptx
00_Main ppt_MeetupDORA&CyberSecurity.pptxFinTech Belgium
 
Best VIP Call Girls Noida Sector 18 Call Me: 8448380779
Best VIP Call Girls Noida Sector 18 Call Me: 8448380779Best VIP Call Girls Noida Sector 18 Call Me: 8448380779
Best VIP Call Girls Noida Sector 18 Call Me: 8448380779Delhi Call girls
 
TEST BANK For Corporate Finance, 13th Edition By Stephen Ross, Randolph Weste...
TEST BANK For Corporate Finance, 13th Edition By Stephen Ross, Randolph Weste...TEST BANK For Corporate Finance, 13th Edition By Stephen Ross, Randolph Weste...
TEST BANK For Corporate Finance, 13th Edition By Stephen Ross, Randolph Weste...ssifa0344
 

Recently uploaded (20)

03_Emmanuel Ndiaye_Degroof Petercam.pptx
03_Emmanuel Ndiaye_Degroof Petercam.pptx03_Emmanuel Ndiaye_Degroof Petercam.pptx
03_Emmanuel Ndiaye_Degroof Petercam.pptx
 
05_Annelore Lenoir_Docbyte_MeetupDora&Cybersecurity.pptx
05_Annelore Lenoir_Docbyte_MeetupDora&Cybersecurity.pptx05_Annelore Lenoir_Docbyte_MeetupDora&Cybersecurity.pptx
05_Annelore Lenoir_Docbyte_MeetupDora&Cybersecurity.pptx
 
VIP Call Girl in Mira Road đź’§ 9920725232 ( Call Me ) Get A New Crush Everyday ...
VIP Call Girl in Mira Road đź’§ 9920725232 ( Call Me ) Get A New Crush Everyday ...VIP Call Girl in Mira Road đź’§ 9920725232 ( Call Me ) Get A New Crush Everyday ...
VIP Call Girl in Mira Road đź’§ 9920725232 ( Call Me ) Get A New Crush Everyday ...
 
VIP Call Girl Service Andheri West ⚡ 9920725232 What It Takes To Be The Best ...
VIP Call Girl Service Andheri West ⚡ 9920725232 What It Takes To Be The Best ...VIP Call Girl Service Andheri West ⚡ 9920725232 What It Takes To Be The Best ...
VIP Call Girl Service Andheri West ⚡ 9920725232 What It Takes To Be The Best ...
 
VIP Independent Call Girls in Bandra West 🌹 9920725232 ( Call Me ) Mumbai Esc...
VIP Independent Call Girls in Bandra West 🌹 9920725232 ( Call Me ) Mumbai Esc...VIP Independent Call Girls in Bandra West 🌹 9920725232 ( Call Me ) Mumbai Esc...
VIP Independent Call Girls in Bandra West 🌹 9920725232 ( Call Me ) Mumbai Esc...
 
High Class Call Girls Nashik Maya 7001305949 Independent Escort Service Nashik
High Class Call Girls Nashik Maya 7001305949 Independent Escort Service NashikHigh Class Call Girls Nashik Maya 7001305949 Independent Escort Service Nashik
High Class Call Girls Nashik Maya 7001305949 Independent Escort Service Nashik
 
Gurley shaw Theory of Monetary Economics.
Gurley shaw Theory of Monetary Economics.Gurley shaw Theory of Monetary Economics.
Gurley shaw Theory of Monetary Economics.
 
High Class Call Girls Nagpur Grishma Call 7001035870 Meet With Nagpur Escorts
High Class Call Girls Nagpur Grishma Call 7001035870 Meet With Nagpur EscortsHigh Class Call Girls Nagpur Grishma Call 7001035870 Meet With Nagpur Escorts
High Class Call Girls Nagpur Grishma Call 7001035870 Meet With Nagpur Escorts
 
The Economic History of the U.S. Lecture 26.pdf
The Economic History of the U.S. Lecture 26.pdfThe Economic History of the U.S. Lecture 26.pdf
The Economic History of the U.S. Lecture 26.pdf
 
Call Girls Service Nagpur Maya Call 7001035870 Meet With Nagpur Escorts
Call Girls Service Nagpur Maya Call 7001035870 Meet With Nagpur EscortsCall Girls Service Nagpur Maya Call 7001035870 Meet With Nagpur Escorts
Call Girls Service Nagpur Maya Call 7001035870 Meet With Nagpur Escorts
 
02_Fabio Colombo_Accenture_MeetupDora&Cybersecurity.pptx
02_Fabio Colombo_Accenture_MeetupDora&Cybersecurity.pptx02_Fabio Colombo_Accenture_MeetupDora&Cybersecurity.pptx
02_Fabio Colombo_Accenture_MeetupDora&Cybersecurity.pptx
 
20240429 Calibre April 2024 Investor Presentation.pdf
20240429 Calibre April 2024 Investor Presentation.pdf20240429 Calibre April 2024 Investor Presentation.pdf
20240429 Calibre April 2024 Investor Presentation.pdf
 
Indore Real Estate Market Trends Report.pdf
Indore Real Estate Market Trends Report.pdfIndore Real Estate Market Trends Report.pdf
Indore Real Estate Market Trends Report.pdf
 
Stock Market Brief Deck (Under Pressure).pdf
Stock Market Brief Deck (Under Pressure).pdfStock Market Brief Deck (Under Pressure).pdf
Stock Market Brief Deck (Under Pressure).pdf
 
(ANIKA) Budhwar Peth Call Girls Just Call 7001035870 [ Cash on Delivery ] Pun...
(ANIKA) Budhwar Peth Call Girls Just Call 7001035870 [ Cash on Delivery ] Pun...(ANIKA) Budhwar Peth Call Girls Just Call 7001035870 [ Cash on Delivery ] Pun...
(ANIKA) Budhwar Peth Call Girls Just Call 7001035870 [ Cash on Delivery ] Pun...
 
Veritas Interim Report 1 January–31 March 2024
Veritas Interim Report 1 January–31 March 2024Veritas Interim Report 1 January–31 March 2024
Veritas Interim Report 1 January–31 March 2024
 
Log your LOA pain with Pension Lab's brilliant campaign
Log your LOA pain with Pension Lab's brilliant campaignLog your LOA pain with Pension Lab's brilliant campaign
Log your LOA pain with Pension Lab's brilliant campaign
 
00_Main ppt_MeetupDORA&CyberSecurity.pptx
00_Main ppt_MeetupDORA&CyberSecurity.pptx00_Main ppt_MeetupDORA&CyberSecurity.pptx
00_Main ppt_MeetupDORA&CyberSecurity.pptx
 
Best VIP Call Girls Noida Sector 18 Call Me: 8448380779
Best VIP Call Girls Noida Sector 18 Call Me: 8448380779Best VIP Call Girls Noida Sector 18 Call Me: 8448380779
Best VIP Call Girls Noida Sector 18 Call Me: 8448380779
 
TEST BANK For Corporate Finance, 13th Edition By Stephen Ross, Randolph Weste...
TEST BANK For Corporate Finance, 13th Edition By Stephen Ross, Randolph Weste...TEST BANK For Corporate Finance, 13th Edition By Stephen Ross, Randolph Weste...
TEST BANK For Corporate Finance, 13th Edition By Stephen Ross, Randolph Weste...
 

Putnam Perspectives: Fixed-Income Outlook Q3 2014

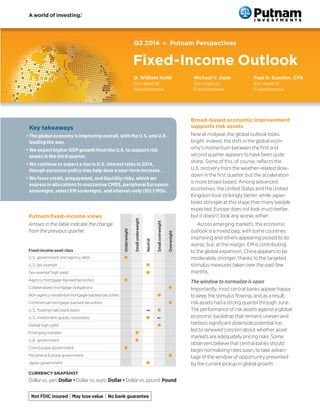
  • 1. Putnam fixed-income views Arrows in the table indicate the change from the previous quarter. Underweight Smallunderweight Neutral Smalloverweight Overweight Fixed-income asset class U.S. government and agency debt l U.S. tax exempt l Tax-exempt high yield l Agency mortgage-backed securities l Collateralized mortgage obligations l Non-agency residential mortgage-backed securities l Commercial mortgage-backed securities l U.S. floating-rate bank loans l U.S. investment-grade corporates l Global high yield l Emerging markets l U.K. government l Core Europe government l Peripheral Europe government l Japan government l CURRENCY SNAPSHOT Dollar vs. yen: Dollar•Dollar vs. euro: Dollar•Dollar vs. pound: Pound Broad-based economic improvement supports risk assets Now at midyear, the global outlook looks bright. Indeed, the shift in the global econ- omy’s momentum between the first and second quarter appears to have been quite sharp. Some of this, of course, reflects the U.S. recovery from the weather-related slow- down in the first quarter, but the acceleration is more broad-based. Among advanced economies, the United States and the United Kingdom look strikingly better, while Japan looks stronger at this stage than many people expected. Europe does not look much better, but it doesn’t look any worse, either. Across emerging markets, the economic outlook is a mixed bag, with some countries improving and others appearing poised to do worse, but, at the margin, EM is contributing to the global expansion. China appears to be moderately stronger, thanks to the targeted stimulus measures taken over the past few months. The window to normalize is open Importantly, most central banks appear happy to keep the stimulus flowing, and as a result, risk assets had a strong quarter through June. The performance of risk assets against a global economic backdrop that remains uneven and harbors significant downside potential has led to renewed concern about whether asset markets are adequately pricing risks. Some observers believe that central banks should begin normalizing rates soon, to take advan- tage of the window of opportunity presented by the current pickup in global growth. Key takeaways • The global economy is improving overall, with the U.S. and U.K. leading the way. • We expect higher GDP growth from the U.S. to support risk assets in the third quarter. • We continue to expect a rise in U.S. interest rates in 2014, though eurozone policy may help slow a near-term increase. • We favor credit, prepayment, and liquidity risks, which we express in allocations to mezzanine CMBS, peripheral European sovereigns, select EM sovereigns, and interest-only (IO) CMOs. Q3 2014 » Putnam Perspectives Fixed-Income Outlook D. William Kohli Co-Head of Fixed Income Michael V. Salm Co-Head of Fixed Income Paul D. Scanlon, CFA Co-Head of Fixed Income
  • 2. 2 Q3 2014 | Fixed-Income Outlook The Bank of England may be the first to act. The BoE has acknowledged that a rate increase is on the horizon and has introduced macro-prudential measures to address housing-market risks. The measures, which include stricter affordability tests for borrowers and restrictions on loan-to-value ratios for loans that are a high multiple of borrowers’ incomes, pose an interesting experiment that bears scrutiny. U.S. inflation picking up, Euro inflation bottoming In the United States, economic data surprised to the upside in the second quarter, including in purchasing managers’ indexes, labor market dynamics, auto sales, and a variety of housing-market metrics. However, food costs are contributing positively to inflation, largely because the drought in California has pushed up fruit and vegetable prices, while cost trends in the housing sector have contributed to core inflation levels. U.S. policy tends to look through the food-related cost pressure as it focuses on core inflation, which excludes the volatile food and energy components. Moreover, the Fed uses the PCE deflator — personal consump- tion expenditure — to measure inflation, which puts a higher weight on medical costs and a lower weight on shelter prices than the CPI. Fed Chair Yellen, for example, referred to the May inflation data (2.1% headline, 2.0% core) as “noise.” Of course, this overlooks the fact that the May rise in core prices was the largest in a decade and double the 10-year average. If one takes the past 120 inflation observations, the chance of seeing a May-type increase would be 5%. Figure 1. Fixed-income asset class performance 0% 1% 2% 3% 4% 5% 6% 2Q 141Q 14 Japan gov’t Eurozone gov’t U.K. gov’t Emerging- market debt Global high yield U.S. investment- grade corporate debt U.S. floating- rate bankloans Commercial mortgage- backed securities Agency mortgage- backed securities Tax- exempt high yield U.S. tax exempt U.S. government Source: Putnam research, as of 6/30/14. Past performance is not indicative of future results. See page 10 for index definitions. Fixed income delivered strong performance across most sectors in the second quarter of 2014.
  • 3. PUTNAM INVESTMENTS | putnam.com 3 In Europe, the pattern of real growth is largely flat, despite standout strength in Spain and Germany and renewed weakness in France. The same goes for inflation. We think inflation in the United Kingdom and the euro- zone will bottom during the summer. Potential upward pressure from energy and food prices is something to monitor later in the year. Having said that, the disinfla- tionary threat that prompted the ECB’s policy easing decisions is not likely to go away, in our view, given the region’s nontrivial economic weakness. Rate expectations Though we expect U.S. rates to move higher through the year, the ECB’s recent policy moves, including the estab- lishment of a negative deposit rate and the introduction of targeted long-term refinancing operations (TLTROs), may affect that trajectory. Figure 2. Short-term rates remained anchored by the Fed’s monetary policy 0% 1% 2% 3% 4% 6/30/14 3/31/14 30 years 20 years 10 years 7 years 5 years 3 years 1 year 1m onth Source: U.S. Department of the Treasury, as of 6/30/14. Interest rates fell across the intermediate and long portions of a flattening yield curve in the second quarter.
  • 4. 4 Q3 2014 | Fixed-Income Outlook Many investors are looking at the U.S. rate spread rela- tive to Germany as a constraint on U.S. yields moving higher. Over the past decade or so, U.S. rates have generally not traded more than 125 basis points over German rates, which is approximately where the spread is today. Given that the European Central Bank is unlikely to stop providing liquidity very soon, that may keep a lid on European rates and, some market participants feel, consequently slow the ability of U.S. rates to move higher. Outlook for continued support of risk assets We believe the economic backdrop in the quarters ahead will be supportive of riskier fixed-income assets. That said, there are global risk factors we are watching, including recent developments in Iraq and the effect this could have on oil prices. Additionally, we continue to monitor the situation in Ukraine as well as economic tran- sitions under way in China. Volatility has been relatively low among most financial assets, and spread markets have generally continued to tighten toward pre-crisis levels. In our view, that suggests the markets may be more vulnerable to shocks and surprises. In terms of portfolio positioning, we plan to continue emphasizing sectors that have benefited from increased liquidity, such as commercial mortgage-backed securities (CMBS) and non-agency residential mortgage-backed securities (RMBS). However, the yield advantage over Treasuries offered by these sectors is not as great as it was, and with certain central banks potentially raising rates in the medium term, the liquidity in these areas of the market could diminish. Figure 3. High-yield spreads and defaults generally move in tandem over credit cycles 0 4 8 12 16 20% 0 400 800 1200 1600 2000 ’11 ’12 ’13 6/30/14’10’09’08’07’06’05’04’03’02’01’00’99’98’97’96’95’94’93’92’91’90’89’88’87 Defaultrate Spreads(bps) 1990–91 recession 2001 recession 2007–09 recession Current spread: 420 bps (as of 6/30/14) 20-year median spread: 523 bps Average default rate: 3.9% Today, the gap between spreads and defaults remains wide, signaling opportunity for investors. High-yield default rate Spread to worst 1Current default rate includes distressed exchanges. Sources: JPMorgan, High Yield Market Monitor, as of 6/30/14; Putnam Investments. Spreads have come in from all-time highs; defaults remain low. High-yield default rate*
  • 5. PUTNAM INVESTMENTS | putnam.com 5 U.S. high-yield and bank loans are still fundamentally sound At this stage in the credit cycle, corporate fundamentals continue to appear positive to us. It is noteworthy that distressed Texas electric utility TXU Energy, a sizable issuer in both the high-yield and bank-loan markets, declared bankruptcy during the quarter, but the event was anticipated and did not disrupt either market. Corporations have taken a conservative approach toward managing their assets and liabilities. Many have refinanced debt, have lowered their overall borrowing costs, and are holding substantial cash balances. This conservatism is evident in many of the more recent merger-and-acquisition transactions, where deals were completed using a significant amount of equity, rather than mostly debt. High-yield credit spreads — the yield advantage offered over Treasuries — compressed modestly during the quarter. By the end of June, spreads were below the historical average level but still above the all-time low. However, we continue to view high-yield spreads as attractive on a loss-adjusted basis, although yields and prices somewhat less so. Absent an external shock to the system, we believe the high-yield asset class should continue generating coupon-like returns in the months ahead. Figure 4. Current spreads relative to historical norms n Average excess yield over Treasuries (OAS, 1/1/98–12/31/07) n Current excess yield over Treasuries (OAS as of 6/30/14) Sources: Barclays, Bloomberg, Putnam, as of 6/30/14. Data is provided for informational use only. Past performance is no guarantee of future results. All spreads are in basis points and measure option- adjusted yield spread relative to comparable maturity U.S. Treasuries with the exception of non-agency RMBS and mezzanine CMBS, which are loss-adjusted spreads to swaps calculated using Putnam’s projected assumptions on defaults and severities, and agency IO, which is calculated using assumptions derived from Putnam’s proprietary prepayment model. Agencies are represented by the Barclays U.S. Agency Index. Agency MBS are represented by the Barclays U.S. Mortgage Backed Securities Index. Investment-grade corporates are represented by the Barclays U.S. Corporate Index. High yield is represented by the JPMorgan Developed High Yield Index. AAA CMBS is represented by the Aaa portion of Barclays Investment Grade CMBS Index; mezzanine CMBS is represented by the same index using the AA, A and BBB components. Average OAS for Mezzanine CMBS is for the 2000–2007 time period. Emerging-market debt is represented by the Barclays EM Hard Currency Aggregate Index. Non-agency RMBS is estimated using average market level of a sample of below-investment-grade securities backed by various types of non-agency mortgage collateral (excluding prime securities). Mezzanine CMBS is estimated from an average spread among baskets of Putnam-monitored new issue and seasoned mezzanine securities, as well as a synthetic (CMBX) index. Agency IO is estimated from a basket of Putnam-monitored interest-only (IO) and inverse IO securities. Option-adjusted spread (OAS) measures the yield over duration equivalent Treasuries for securities with different embedded options. 56 130 89 123 123  150  129 425 34 35 24 0 200 400 600 800 1000 685 350 100 130 260 500 115 339 104 99 573 Non-agency  RMBS CMBS – Mezzanine Emerging- market debt Agency IOHigh yieldAAA CMBS Investment-grade corporates Agency MBS Agencies 56 130 89 123 123  150  129 425 34 35 24 0 200 400 600 800 1000 685 350 100 130 260 500 115 339 104 99 573 Non-agency  RMBS CMBS – Mezzanine Emerging- market debt Agency IOHigh yieldAAA CMBS Investment-grade corporates Agency MBS Agencies We continue to find compelling investment opportunities in out-of-benchmark sectors, given their relative spread levels and solid underlying fundamentals.
  • 6. 6 Q3 2014 | Fixed-Income Outlook As for portfolio positioning, we generally increased high-yield portfolio allocations to Ba-rated bonds while reducing exposures to Caa-rated securities. In addi- tion, given the recent underperformance of bank loans compared with high-yield bonds, we felt loan valuations had become more attractive, so we increased loan hold- ings in May and June. Securitized markets continue to attract investors In the second quarter, our mortgage-related credit strategies performed well, particularly our exposures to commercial mortgage-backed securities [CMBS] and non-agency residential mortgage-backed securities [RMBS]. These sectors were aided by investor demand for higher-yielding securities, supportive fundamentals, and the prospect of increased global liquidity in light of the ECB’s policy announcement. Figure 5. Excess returns relative to U.S. Treasuries 0.0% 0.5% 1.0% 1.5% 2.0% 2.5% 3.0% MBSCMBSU.S. investment- grade credit Emerging-markets debt (EMD) High yield Source: Barclays, as of 6/30/14. Past performance is not indicative of future results. In the context of a 2.66% return for 10-year U.S. Treasuries, most other sectors outperformed, with high yield and EMD exhibiting particularly strong performance.
  • 7. PUTNAM INVESTMENTS | putnam.com 7 Within CMBS, portfolios generally benefited from solid security selection in subordinated “mezzanine” bonds rated BBB/Baa, which offered higher yields at what we believe are acceptable risks. Within non-agency RMBS, pay-option adjustable-rate mortgage-backed securities were the main contributors. Our prepayment strategies, which we implemented with securities such as interest-only and inverse interest- only collateralized mortgage obligations [CMOs], provided a further boost to relative performance. Although rates fell during the quarter, the decline wasn’t great enough to trigger increased refinancing of the mortgages underlying our CMO holdings. As a result, continued slow prepayment speeds bolstered the securi- ties’ values. Emerging markets: Latin American favorites In emerging Asian economies, we found debt markets to be priced fairly, which means they represented relatively little upside potential. Consequently, we de-emphasized exposures to this region. In Eastern Europe, the Middle East, and Africa, we believed geopolitical tensions were likely to remain high, so we were selective in our approach to debt markets in this broad region, which also helped our EM portfolios. Notably, despite soaring volatility in Russian and Ukrai- nian asset markets, these areas performed better as the period wore on. Ukrainian debt became a top performer relative to other EMD in May as tensions between Ukraine and Russia — and the spillover anxiety these tensions caused for a variety of other markets — eased somewhat on a global stage. We found the best relative risk-reward potential was in Latin American debt markets. Importantly, Latin Amer- ican credit fundamentals did not deteriorate through the period and thus continued to support government bonds in this region. Credit spreads were not nearly as wide in Latin America as in some of the riskier emerging markets, such as Ukraine, nor were they as tight as in some Asian markets, which contributed to the upside potential we perceived in Latin American government debt. Argentine debt encountered difficulties starting in May as the approach of a key date in the multi-year legal battle between Argentina and holdout creditors — investors who refused to accept a restructured, and less valuable, form of the country’s debt in the wake of the country’s prior default — made many investors nervous. Nevertheless, we think the country represents a posi- tive long-term value to investors and that the yields are attractive given the country’s fundamentals. Problems with creditors pose a major political hurdle, but we believe the country’s significant agricultural assets and recent discoveries of natural resources put Argentina in a better position economically to weather a difficult cycle for its debt. Municipal bonds post favorable results Fundamental and technical (supply/demand) factors contributed to a very hospitable environment for municipal bonds during the second quarter. Falling rates, lower-trending volatility in both equity and bond markets, ECB easing, and the U.S. Fed’s affirmation of its commit- ment to low rates all converged as helpful factors. By the end of the quarter, the yield on the benchmark 10-year Treasury note had fallen from 2.72% to 2.53%, and prices rose commensurately. Municipal bonds followed a similar path as Treasuries during the rally but had other tailwinds propelling their prices higher. Municipal bond issuance, which has been trending down in recent years, continued at a modest pace, and this was beneficial for prices. The declining volume of new long-term municipal bonds coming to market is due, in part, to state and local governments undertaking fewer projects while turning their fiscal attention toward funding employee pensions and other fixed costs in their budgets. This modest level of supply has not kept pace with the solid demand from traditional tax-sensitive retail investors. Crossover taxable buyers have also been drawn to the competitive yields and attractive relative value offered by this asset class rather than its tax benefit.
  • 8. 8 Q3 2014 | Fixed-Income Outlook Figure 6: Muni credit spreads have narrowed from historical wides, but remain attractive Municipal bond spreads by quality rating AA A BBB 0 100 200 300 400 500 6/30/14201320122011201020092008200720062005200420032002200120001999 Source: Putnam, as of 6/30/14. Credit ratings are as determined by Putnam. The most attractive relative values continue to populate in the BBB-rated segment of the muni market. Meanwhile, inflows to tax-free mutual funds, an impor- tant measure of demand, remained positive during the second quarter of 2014 — primarily in tax-free high-yield bond funds. Thus, with interest rates still low and funda- mental credit quality improving, there has been greater investor appetite for the yields offered by the relatively riskier municipal bonds further out on the maturity spectrum as well as for those in the lower-rated, higher- yielding sectors. Despite the strong start for municipal bonds in 2014 and our belief that the credit outlook for municipal bonds appears solid given improvement in U.S. growth, we still remain cautious and believe that there could be some volatility surrounding supply/demand factors and interest rates in the coming months. With regard to tax policy, we think comprehensive tax reform is unlikely at least until after the 2014 mid-term elections.
  • 9. PUTNAM INVESTMENTS | putnam.com 9 Currency outlook Within active currency strategies, we now favor a small overweight position in the U.S. dollar. The outcome of the June FOMC meeting was largely as expected: The taper continued, the post-meeting statement was little changed, the 2015 and 2016 interest-rate forecasts were revised somewhat higher and the longer-term forecast somewhat lower, and Yellen’s press conference continued to indicate no urgency to step back from highly accom- modative monetary policy. As a result, future monetary policy remains very much data dependent. If growth and inflation rebound soundly, as we expect, the Fed’s view is likely to be challenged and rate hikes will begin to get priced in sooner, which should be supportive of the U.S. dollar over the course of the year. The euro position remains an underweight. Over the past month, the ECB agreed to cut its deposit rate below zero, provide new four-year long-term refinancing operation loans in September and December, stop sterilizing its Securities Markets Program bond purchases, and work on options for buying private-sector asset-backed securities in future. All of these measures appear sufficient to cap the single currency in its current 1.35–1.40 range against the dollar, and the anticipated developments in the U.S. story should help to push this value down over the coming months. The British pound sterling positioning remains a modest overweight. Bank of England Governor Mark Carney signaled in a June speech that interest rates may need to rise earlier than markets were anticipating. He subsequently highlighted that the economy continues to have more slack to absorb before interest rates need to rise. Also, while the pace of job creation has been strong, wage growth had been softer than expected. This some- what puzzling outlook should be viewed as preparing the market for earlier tightening but at a more gradual pace, and eventually arriving at a lower terminal rate than past tightening cycles. A quite modest underweight position to the Japanese yen remains after an extended period of being neutral. We expect that the Bank of Japan will have to do more, which should provide further impetus for the U.S. dollar to move higher versus the yen. However, Bank of Japan Governor Haruhiko Kuroda remains optimistic around the recovery in the economy and the trajectory of recent inflation data. He remains clear that if growth is weaker than expected and inflation does not accelerate, then the BoJ will do more.
  • 10. 10 Q3 2014 | Fixed-Income Outlook Agencymortgage-backedsecurities are represented by the Barclays U.S. Mortgage Backed Securities Index, which covers agency mortgage-backed pass-through securities (both fixed-rate and hybrid ARM) issued by Ginnie Mae (GNMA), Fannie Mae (FNMA), and Freddie Mac (FHLMC). Commercialmortgage-backedsecurities are represented by the Barclays U.S. CMBS Investment Grade Index, which measures the market of commercial mortgage- backed securities with a minimum deal size of $500 million. The two subcomponents of the U.S. CMBS Investment Grade Index are U.S. aggregate-eligible securities and non-eligible securities. To be included in the U.S. Aggregate Index, the securities must meet the guidelines for ERISA eligibility. Emerging-marketdebt is represented by the JPMorgan Emerging Markets Global Diversified Index, which is composed of U.S. dollar-denominated Brady bonds, eurobonds, traded loans, and local market debt instruments issued by sovereign and quasi-sovereign entities. Eurozonegovernment is represented by the Barclays European Aggregate Bond Index, which tracks fixed-rate, investment-grade securities issued in the following European currencies: euro, Norwegian krone, Danish krone, Swedish krona, Czech koruna, Hungarian forint, Polish zloty, and Swiss franc. Globalhighyield is represented by the BofA Merrill Lynch Global High Yield Constrained Index, an unmanaged index of global high-yield fixed-income securities. Japangovernment is represented by the Barclays Japanese Aggregate Bond Index, a broad-based investment-grade benchmark consisting of fixed-rate Japanese yen-denominated securities. Tax-exempthighyieldisrepresentedbytheBarclaysMunicipalBondHighYieldIndex, which consists of below-investment-grade or unrated bonds with outstanding par valuesofatleast$3millionandatleastoneyearremaininguntiltheirmaturitydates. U.K.government is represented by the Barclays Sterling Aggregate Bond Index, which contains fixed-rate, investment-grade, sterling-denominated securities, including gilt and non-gilt bonds. U.S.floating-ratebankloans are represented by the SP/LSTA Leveraged Loan Index, an unmanaged index of U.S. leveraged loans. U.S.governmentandagencydebt is represented by the Barclays U.S. Aggregate Bond Index, an unmanaged index of U.S. investment-grade fixed-income securities. U.S.investment-gradecorporatedebt is represented by the Barclays U.S. Corporate Index, a broad-based benchmark that measures the U.S. taxable investment-grade corporate bond market. U.S.taxexempt is represented by the Barclays Municipal Bond Index, an unmanaged index of long-term fixed-rate investment-grade tax-exempt bonds. You cannot invest directly in an index. This material is provided for limited purposes. It is not intended as an offer or solicitation for the purchase or sale of any financial instrument, or any Putnam product or strategy. References to specific securities, asset classes, and financial markets are for illustrative purposes only and are not intended to be, and should not be interpreted as, recommendations or investment advice. The opinions expressed in this article represent the current, good-faith views of the author(s) at the time of publication. The views are provided for informational purposes only and are subject to change. This material does not take into account any investor’s particular investment objectives, strategies, tax status, or investment horizon. The views and strategies described herein may not be suitable for all investors. Investors should consult a financial advisor for advice suited to their individual financial needs. Putnam Investments cannot guarantee the accuracy or completeness of any statements or data contained in the article. Predictions, opinions, and other information contained in this article are subject to change. Any forward-looking statements speak only as of the date they are made, and Putnam assumes no duty to update them. Forward-looking statements are subject to numerous assumptions, risks, and uncertainties. Actual results could differ materially from those anticipated. Past performance is not a guarantee of future results. As with any investment, there is a potential for profit as well as the possibility of loss. The information provided relates to Putnam Investments and its affiliates, which include The Putnam Advisory Company, LLC and Putnam Investments Limited®. Prepared for use in Canada by Putnam Investments Inc. [Investissements Putnam Inc.] (o/a Putnam Management in Manitoba). Where permitted, advisory services are provided in Canada by Putnam Investments Inc. [Investissements Putnam Inc.] (o/a Putnam Management in Manitoba) and its affiliate, The Putnam Advisory Company, LLC.
  • 11. PUTNAM INVESTMENTS | putnam.com 11 Putnam’s veteran fixed-income team offers a depth and breadth of insight and an independent view of risk. Successful investing in today’s markets requires a broad-based approach, the flexibility to exploit a range of sectors and investment opportunities, and a keen understanding of the complex global interrelationships that drive the markets. That is why Putnam has more than 70 fixed- income professionals focusing on delivering comprehensive coverage of every aspect of the fixed-income markets, based not only on sector, but also on the broad sources of risk — and opportunities — most likely to drive returns. D. William Kohli Co-Head of Fixed Income Global Strategies Investing since 1987 Joined Putnam in 1994 Michael V. Salm Co-Head of Fixed Income Liquid Markets and Securitized Products Investing since 1989 Joined Putnam in 1997 Paul D. Scanlon, CFA Co-Head of Fixed Income Global Credit Investing since 1986 Joined Putnam in 1999
  • 12. Consider these risks before investing: International investing involves certain risks, such as currency fluctuations, economic instability, and political developments. Additional risks may be associated with emerging-market securities, including illiquidity and volatility. Lower-rated bonds may offer higher yields in return for more risk. Funds that invest in government securities are not guaranteed. Mortgage-backed securities are subject to prepayment risk. Derivatives also involve the risk, in the case of many over-the-counter instruments, of the potential inability to terminate or sell derivatives positions and the potential failure of the other party to the instrument to meet its obligations. Bond investments are subject to interest-rate risk, which means the prices of the funds’ bond investments are likely to fall if interest rates rise. Bond investments also are subject to credit risk, which is the risk that the issuer of the bond may default on payment of interest or principal. Interest-rate risk is generally greater for longer-term bonds, and credit risk is generally greater for below-investment-grade bonds, which may be considered speculative. Unlike bonds, funds that invest in bonds have ongoing fees and expenses. You can lose money by investing in a mutual fund. If you are a U.S. retail investor, please request a prospectus, or a summary prospectus if available, from your financial representative or by calling Putnam at 1-800-225-1581. The prospectus includes investment objectives, risks, fees, expenses, and other information that you should read and consider carefully before investing. In the United States, mutual funds are distributed by Putnam Retail Management. PUTNAM INVESTMENTS | putnam.com CM0200 289088 7/14 Market update putnam.com/markets Research putnam.com/perspectives putnam.com/white-papers Find us