

Recommended
More Related Content
What's hot
What's hot (20)
Viewers also liked
Viewers also liked (14)
Similar to Candlestick Course
Similar to Candlestick Course (19)
Recently uploaded
Recently uploaded (20)
Candlestick Course
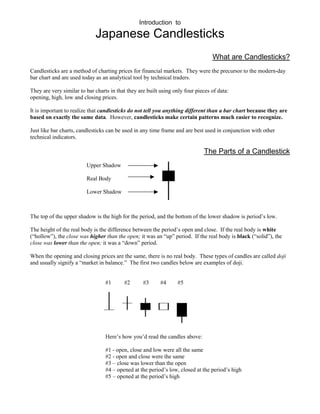
- 1. Introduction to Japanese Candlesticks What are Candlesticks? Candlesticks are a method of charting prices for financial markets. They were the precursor to the modern-day bar chart and are used today as an analytical tool by technical traders. They are very similar to bar charts in that they are built using only four pieces of data: opening, high, low and closing prices. It is important to realize that candlesticks do not tell you anything different than a bar chart because they are based on exactly the same data. However, candlesticks make certain patterns much easier to recognize. Just like bar charts, candlesticks can be used in any time frame and are best used in conjunction with other technical indicators. The Parts of a Candlestick Upper Shadow Real Body Lower Shadow The top of the upper shadow is the high for the period, and the bottom of the lower shadow is period’s low. The height of the real body is the difference between the period’s open and close. If the real body is white (“hollow”), the close was higher than the open; it was an “up” period. If the real body is black (“solid”), the close was lower than the open; it was a “down” period. When the opening and closing prices are the same, there is no real body. These types of candles are called doji and usually signify a “market in balance.” The first two candles below are examples of doji. #1 #2 #3 #4 #5 Here’s how you’d read the candles above: #1 - open, close and low were all the same #2 - open and close were the same #3 – close was lower than the open #4 – opened at the period’s low, closed at the period’s high #5 – opened at the period’s high
- 2. Bullish Candlestick Patterns The Hammer A candle like the one shown at the right that appears during a downtrend can signal that the downtrend is over and a reversal is beginning. Characteristics: small real body (either white or black), no upper shadow. Hammer (white or black body) Bullish Engulfing Pattern This is a two candle pattern that can signal a reversal when it is formed during a downtrend. Characteristics: a larger white body candle follows and “engulfs” the previous black candle. (i.e. the black candle’s open is lower than the white candle’s close, and the black candle’s close is higher than the white candle’s open). Since you’d need to wait until the second candle has finished being built in order to verify the pattern, you may miss a profitable trading opportunity if you use this pattern as an entry point. Another use of the Bearish Engulfing Pattern is as a support level for future prices. When prices retry the low of this two candle pattern, they will usually find strong support at this level. The Piercing Pattern This pattern can also signal a reversal when it appears during a downtrend. There are some important differences between this pattern and the Bearish Engulfing Pattern. Characteristics: after a black candle, a white body candle gaps lower on the open, but closes within the body of the previous black candle. The Morning Star The Morning Star is a three candle pattern that signals a bottom reversal. Characteristics: 1st Candle: long black real body 2nd Candle: small real body (either white or black) that doesn’t touch the previous candle’s body 3rd Candle: white real body that trades into the range of the body of the first black candle. This can be a black or white body
- 3. Bearish Candlestick Patterns The Shooting Star When a Shooting Star appears This can be a black or white body during an uptrend, it can signal a bearish reversal. Characteristics: long upper shadow, small real body near the lower end of the period’s trading range, little or no lower shadow. Bearish Engulfing Pattern This pattern is the bearish equivalent of the Bullish Engulfing Pattern. It signals a reversal in a rally. Characteristics: a white candle occurring during a rally is followed by a black candle whose real body envelopes the white candle’s real body (i.e. the black candle’s open is higher than the white candle’s close, and the black candle’s close is lower than the white candle’s open). Dark Cloud Cover Dark Cloud Cover is the bearish equivalent of the bullish Piercing Pattern. When it occurs during a rally, we expect a reversal is on the way. Characteristics: long white real body, followed by a black candle. The black candle opens higher than the previous close, but closes well within the body of the white candle. Evening Star This bearish reversal is similar to the Morning Star pattern, except that it occurs when the market is in a rally and signals the beginning of a downtrend . Like the Morning Star, it is a three candle pattern. 1st Candle: long white real body 2nd Candle: small real body (either white or black) that doesn’t touch the previous candle’s body 3rd Candle: black real body that trades into the range of the body of the first white candle. This can be a black or white body
- 4. Learn Forex trading with full time Professional Forex trader! ReadyForex.com is educating Forex traders since 2006 by offering Forex training video courses and 1 on 1 live mentoring program. Flexible choices of trading courses are available for day traders, medium term and position traders. 1/- Candlesticks Course http://www.readyforex.com/Candlestick-Course.php 2/- Price Patterns Course http://readyforex.com/Price-Patterns.php 3/- Smart Trader Forex Course http://readyforex.com/Smart-Trader-Forex-Course.php 4/- Forex Expert Advisor Course http://readyforex.com/Forex-Expert-Advisor-Course.php Copyright © 2006-2010 http://www.readyforex.com All rights reserved