SlideShare a Scribd company logo
1 of 3
Download to read offline
222/2016 - 14 November 2016
Duration of working life
People in the EU can expect to work almost 2
years longer than 10 years ago
Increase mainly driven by longer duration of working life for women
The expected duration of working life in the European Union (EU) stood at 35.4 years on average in 2015, up by
1.9 years compared with 2005. In detail over this 10-year period, duration of working life has increased more rapidly
for women (32.8 years in 2015 compared with 30.2 years in 2005, or +2.6 years) than for men (37.9 years in 2015
vs. 36.7 years in 2005, or +1.2 year).
Among the EU Member States, working life in 2015 was expected to be longest on average in Sweden (41.2 years)
and shortest in Italy (30.7 years).
This information is issued by Eurostat, the statistical office of the European Union. This indicator "duration of
working life" measures the number of years a person aged 15 is expected to be active (either employed or
unemployed) in the labour market throughout his/her life.
Working life more than ten years longer in Sweden than in Italy
Across the EU Member States, the average working life was in 2015 expected to be the longest in Sweden (41.2
years), ahead of the Netherlands (39.9 years), Denmark (39.2 years), the United Kingdom (38.6 years) and
Germany (38.0 years). At the opposite end of the scale, working life was expected to last less than 33 years in Italy
(30.7 years), Bulgaria (32.1 years), Greece (32.3 years), Belgium, Croatia, Hungary and Poland (32.6 years
each) as well as Romania (32.8 years). In all Member States except Lithuania, duration of working life was
expected in 2015 to be longer for men than for women.
Largest increase of duration of working life in Malta, smallest in Denmark
Between 2005 and 2015, the expected duration of working life has increased in all EU Member States, albeit to
different extents. It has risen the most in Malta (+5.1 years), followed by Hungary (+4.2 years), Luxembourg (+3.1
years), Estonia (+3.0 years) and Lithuania (+2.9 years), while it remained nearly the same in Denmark (+0.2 year),
Portugal (+0.3 year) and Ireland (+0.4 year). The overall increase in duration of working life is generally driven
across Member States by the change in women's duration of working life. This latter has increased between 2005
and 2015 in all EU Member States, notably in Malta (+8.6 years), Spain (+5.1 years), Luxembourg (+4.7 years),
Hungary (+4.0 years), Cyprus (+3.6 years), Lithuania (+3.5 years), Germany and Austria (+3.4 years each). In
contrast, duration of working life for men has dropped in five Member States: Cyprus (-1.9 years), Greece (-1.4
years), Ireland (-1.0 year), Spain (-0.7 year), and Portugal (-0.6 year).
Average expected years of working life in the EU Member States, 2005-2015
Total
Of which:
Men Women
2005 2015
Change
2015/2005
(in years)
2005 2015
Change
2015/2005
(in years)
2005 2015
Change
2015/2005
(in years)
EU 33.5 35.4 1.9 36.7 37.9 1.2 30.2 32.8 2.6
Belgium 31.4 32.6 1.2 34.6 34.6 0.0 28.1 30.4 2.3
Bulgaria 29.6 32.1 2.5 31.3 33.4 2.1 27.7 30.7 3.0
Czech Republic 33.7 35.1 1.4 36.8 38.2 1.4 30.4 31.9 1.5
Denmark 39.0 39.2 0.2 40.8 40.9 0.1 37.1 37.5 0.4
Germany 35.6 38.0 2.4 38.6 40.1 1.5 32.4 35.8 3.4
Estonia 34.0 37.0 3.0 34.2 37.6 3.4 33.8 36.4 2.6
Ireland 34.6 35.0 0.4 39.9 38.9 -1.0 29.1 30.9 1.8
Greece 31.6 32.3 0.7 37.0 35.6 -1.4 25.8 28.9 3.1
Spain 32.8 34.9 2.1 37.9 37.2 -0.7 27.4 32.5 5.1
France 32.9 34.9 2.0 35.1 36.6 1.5 30.6 33.0 2.4
Croatia 31.4 32.6 1.2 33.7 34.5 0.8 28.8 30.7 1.9
Italy 29.6 30.7 1.1 35.2 35.4 0.2 23.7 25.7 2.0
Cyprus 35.7 36.4 0.7 40.9 39.0 -1.9 30.1 33.7 3.6
Latvia 33.1 35.2 2.1 34.0 35.4 1.4 32.1 35.0 2.9
Lithuania 31.9 34.8 2.9 32.2 34.5 2.3 31.6 35.1 3.5
Luxembourg 30.4 33.5 3.1 34.4 35.8 1.4 26.3 31.0 4.7
Hungary 28.4 32.6 4.2 30.7 34.9 4.2 26.0 30.0 4.0
Malta 28.3 33.4 5.1 38.2 39.9 1.7 18.1 26.7 8.6
Netherlands 37.5 39.9 2.4 40.8 42.5 1.7 34.0 37.2 3.2
Austria 34.1 36.7 2.6 37.0 38.8 1.8 31.1 34.5 3.4
Poland 30.6 32.6 2.0 33.0 35.2 2.2 28.1 29.9 1.8
Portugal 36.5 36.8 0.3 38.9 38.3 -0.6 34.0 35.3 1.3
Romania 31.1 32.8 1.7 33.4 36.0 2.6 28.7 29.4 0.7
Slovenia 33.5 34.3 0.8 35.3 35.7 0.4 31.5 32.8 1.3
Slovakia 32.3 33.5 1.2 35.3 35.9 0.6 29.2 30.9 1.7
Finland 35.9 37.6 1.7 36.6 38.1 1.5 35.3 37.2 1.9
Sweden 38.9 41.2 2.3 40.1 42.2 2.1 37.6 40.1 2.5
United Kingdom 37.4 38.6 1.2 40.5 41.2 0.7 34.1 35.9 1.8
Iceland 45.0 46.6 1.6 47.4 48.6 1.2 42.6 44.7 2.1
Norway 38.4 39.8 1.4 39.9 41.0 1.1 36.8 38.5 1.7
Switzerland 40.1 42.5 2.4 43.1 44.7 1.6 36.8 40.1 3.3
The source dataset can be found here.
Geographical information
The European Union (EU) includes Belgium, Bulgaria, the Czech Republic, Denmark, Germany, Estonia, Ireland, Greece,
Spain, France, Croatia, Italy, Cyprus, Latvia, Lithuania, Luxembourg, Hungary, Malta, the Netherlands, Austria, Poland,
Portugal, Romania, Slovenia, Slovakia, Finland, Sweden and the United Kingdom.
Methods and definitions
The duration of working life indicator measures the number of years a person aged 15 is expected to be active (meaning
either employed or unemployed) in the labour market throughout his/her life. This indicator is derived from demographic data
and labour market data (EU-LFS survey).
Data refer to the resident population and therefore results relate to persons resident in a country irrespective of the country
where those persons work. This difference may be significant in countries with large cross-border flows. For further information,
please consult the Eurostat EU-LFS publication.
For more information
Eurostat website section dedicated to the EU Labour Force Survey (LFS).
Eurostat database on EU-LFS results.
Issued by: Eurostat Press Office
Vincent BOURGEAIS
Tel: +352-4301-33 444
eurostat-pressoffice@ec.europa.eu
ec.europa.eu/eurostat
Production of data:
Havard LIEN
Tel: +352-4301-35 226
havard.lien@ec.europa.eu
@EU_Eurostat
Media requests: Eurostat media support / Tel: +352-4301-33 408 / eurostat-mediasupport@ec.europa.eu

More Related Content

Viewers also liked (7)

Campaña "Donar sangre es vida"
Campaña "Donar sangre es vida"Campaña "Donar sangre es vida"
Campaña "Donar sangre es vida"
 
vb profile 150825
vb profile 150825vb profile 150825
vb profile 150825
 
B.serv project 2 (final report)
B.serv   project 2 (final report)B.serv   project 2 (final report)
B.serv project 2 (final report)
 
Sociedad y cultura
Sociedad y culturaSociedad y cultura
Sociedad y cultura
 
Tema 5(para aula-prática)
Tema 5(para aula-prática)Tema 5(para aula-prática)
Tema 5(para aula-prática)
 
Мовний табір 2016 Луковичі
Мовний табір 2016 ЛуковичіМовний табір 2016 Луковичі
Мовний табір 2016 Луковичі
 
Software aplikasi komputer
Software aplikasi  komputerSoftware aplikasi  komputer
Software aplikasi komputer
 

More from Agi

Leggi il dossier completo Global 500, edizione 2017
Leggi il dossier completo Global 500, edizione 2017 Leggi il dossier completo Global 500, edizione 2017
Leggi il dossier completo Global 500, edizione 2017 Agi
 
Leggi il dossier completo Global 500, edizione 2017
Leggi il dossier completo Global 500, edizione 2017 Leggi il dossier completo Global 500, edizione 2017
Leggi il dossier completo Global 500, edizione 2017 Agi
 
Trump intelligence allegations
Trump intelligence allegationsTrump intelligence allegations
Trump intelligence allegationsAgi
 
Un anno della buona scuola
Un anno della buona scuolaUn anno della buona scuola
Un anno della buona scuolaAgi
 
La buona scuola_sintesi_schede
La buona scuola_sintesi_schedeLa buona scuola_sintesi_schede
La buona scuola_sintesi_schedeAgi
 
Statuto città metropolitana di Milano del 22-12-2014
Statuto città metropolitana di Milano del 22-12-2014Statuto città metropolitana di Milano del 22-12-2014
Statuto città metropolitana di Milano del 22-12-2014Agi
 
Pdf documenti Marra
Pdf documenti MarraPdf documenti Marra
Pdf documenti MarraAgi
 
Vacanze di Natale 2016
Vacanze di Natale 2016Vacanze di Natale 2016
Vacanze di Natale 2016Agi
 
Bozza conclusioni vertice Ue
Bozza conclusioni vertice UeBozza conclusioni vertice Ue
Bozza conclusioni vertice UeAgi
 
Riforma contratti statali
Riforma contratti stataliRiforma contratti statali
Riforma contratti stataliAgi
 
Comunicato stampa nidi di stelle
Comunicato stampa nidi di stelleComunicato stampa nidi di stelle
Comunicato stampa nidi di stelleAgi
 
Articolo 4 decreto legge 193 2016
Articolo 4 decreto legge 193  2016Articolo 4 decreto legge 193  2016
Articolo 4 decreto legge 193 2016Agi
 
1000giorni
1000giorni1000giorni
1000giorniAgi
 
1000 giorni in numeri
1000 giorni in numeri1000 giorni in numeri
1000 giorni in numeriAgi
 
Rapporto bankitalia
Rapporto bankitaliaRapporto bankitalia
Rapporto bankitaliaAgi
 
Atlante dell'infanzia save the children
Atlante dell'infanzia save the childrenAtlante dell'infanzia save the children
Atlante dell'infanzia save the childrenAgi
 
Dossier maltrattamento bambini 2016 web
Dossier maltrattamento bambini 2016 webDossier maltrattamento bambini 2016 web
Dossier maltrattamento bambini 2016 webAgi
 
Dossier maltrattamento bambini 2016 web
Dossier maltrattamento bambini 2016 webDossier maltrattamento bambini 2016 web
Dossier maltrattamento bambini 2016 webAgi
 
Comunicato comitato-referendario-12112016
Comunicato comitato-referendario-12112016Comunicato comitato-referendario-12112016
Comunicato comitato-referendario-12112016Agi
 
Comunicato comitato-referendario-12112016
Comunicato comitato-referendario-12112016Comunicato comitato-referendario-12112016
Comunicato comitato-referendario-12112016Agi
 

More from Agi (20)

Leggi il dossier completo Global 500, edizione 2017
Leggi il dossier completo Global 500, edizione 2017 Leggi il dossier completo Global 500, edizione 2017
Leggi il dossier completo Global 500, edizione 2017
 
Leggi il dossier completo Global 500, edizione 2017
Leggi il dossier completo Global 500, edizione 2017 Leggi il dossier completo Global 500, edizione 2017
Leggi il dossier completo Global 500, edizione 2017
 
Trump intelligence allegations
Trump intelligence allegationsTrump intelligence allegations
Trump intelligence allegations
 
Un anno della buona scuola
Un anno della buona scuolaUn anno della buona scuola
Un anno della buona scuola
 
La buona scuola_sintesi_schede
La buona scuola_sintesi_schedeLa buona scuola_sintesi_schede
La buona scuola_sintesi_schede
 
Statuto città metropolitana di Milano del 22-12-2014
Statuto città metropolitana di Milano del 22-12-2014Statuto città metropolitana di Milano del 22-12-2014
Statuto città metropolitana di Milano del 22-12-2014
 
Pdf documenti Marra
Pdf documenti MarraPdf documenti Marra
Pdf documenti Marra
 
Vacanze di Natale 2016
Vacanze di Natale 2016Vacanze di Natale 2016
Vacanze di Natale 2016
 
Bozza conclusioni vertice Ue
Bozza conclusioni vertice UeBozza conclusioni vertice Ue
Bozza conclusioni vertice Ue
 
Riforma contratti statali
Riforma contratti stataliRiforma contratti statali
Riforma contratti statali
 
Comunicato stampa nidi di stelle
Comunicato stampa nidi di stelleComunicato stampa nidi di stelle
Comunicato stampa nidi di stelle
 
Articolo 4 decreto legge 193 2016
Articolo 4 decreto legge 193  2016Articolo 4 decreto legge 193  2016
Articolo 4 decreto legge 193 2016
 
1000giorni
1000giorni1000giorni
1000giorni
 
1000 giorni in numeri
1000 giorni in numeri1000 giorni in numeri
1000 giorni in numeri
 
Rapporto bankitalia
Rapporto bankitaliaRapporto bankitalia
Rapporto bankitalia
 
Atlante dell'infanzia save the children
Atlante dell'infanzia save the childrenAtlante dell'infanzia save the children
Atlante dell'infanzia save the children
 
Dossier maltrattamento bambini 2016 web
Dossier maltrattamento bambini 2016 webDossier maltrattamento bambini 2016 web
Dossier maltrattamento bambini 2016 web
 
Dossier maltrattamento bambini 2016 web
Dossier maltrattamento bambini 2016 webDossier maltrattamento bambini 2016 web
Dossier maltrattamento bambini 2016 web
 
Comunicato comitato-referendario-12112016
Comunicato comitato-referendario-12112016Comunicato comitato-referendario-12112016
Comunicato comitato-referendario-12112016
 
Comunicato comitato-referendario-12112016
Comunicato comitato-referendario-12112016Comunicato comitato-referendario-12112016
Comunicato comitato-referendario-12112016
 

Recently uploaded

16042024_First India Newspaper Jaipur.pdf
16042024_First India Newspaper Jaipur.pdf16042024_First India Newspaper Jaipur.pdf
16042024_First India Newspaper Jaipur.pdfFIRST INDIA
 
Political-Ideologies-and-The-Movements.pptx
Political-Ideologies-and-The-Movements.pptxPolitical-Ideologies-and-The-Movements.pptx
Political-Ideologies-and-The-Movements.pptxSasikiranMarri
 
Global Terrorism and its types and prevention ppt.
Global Terrorism and its types and prevention ppt.Global Terrorism and its types and prevention ppt.
Global Terrorism and its types and prevention ppt.NaveedKhaskheli1
 
57 Bidens Annihilation Nation Policy.pdf
57 Bidens Annihilation Nation Policy.pdf57 Bidens Annihilation Nation Policy.pdf
57 Bidens Annihilation Nation Policy.pdfGerald Furnkranz
 
Geostrategic significance of South Asian countries.ppt
Geostrategic significance of South Asian countries.pptGeostrategic significance of South Asian countries.ppt
Geostrategic significance of South Asian countries.pptUsmanKaran
 
15042024_First India Newspaper Jaipur.pdf
15042024_First India Newspaper Jaipur.pdf15042024_First India Newspaper Jaipur.pdf
15042024_First India Newspaper Jaipur.pdfFIRST INDIA
 
Rohan Jaitley: Central Gov't Standing Counsel for Justice
Rohan Jaitley: Central Gov't Standing Counsel for JusticeRohan Jaitley: Central Gov't Standing Counsel for Justice
Rohan Jaitley: Central Gov't Standing Counsel for JusticeAbdulGhani778830
 
IndiaWest: Your Trusted Source for Today's Global News
IndiaWest: Your Trusted Source for Today's Global NewsIndiaWest: Your Trusted Source for Today's Global News
IndiaWest: Your Trusted Source for Today's Global NewsIndiaWest2
 
Foreign Relation of Pakistan with Neighboring Countries.pptx
Foreign Relation of Pakistan with Neighboring Countries.pptxForeign Relation of Pakistan with Neighboring Countries.pptx
Foreign Relation of Pakistan with Neighboring Countries.pptxunark75
 

Recently uploaded (9)

16042024_First India Newspaper Jaipur.pdf
16042024_First India Newspaper Jaipur.pdf16042024_First India Newspaper Jaipur.pdf
16042024_First India Newspaper Jaipur.pdf
 
Political-Ideologies-and-The-Movements.pptx
Political-Ideologies-and-The-Movements.pptxPolitical-Ideologies-and-The-Movements.pptx
Political-Ideologies-and-The-Movements.pptx
 
Global Terrorism and its types and prevention ppt.
Global Terrorism and its types and prevention ppt.Global Terrorism and its types and prevention ppt.
Global Terrorism and its types and prevention ppt.
 
57 Bidens Annihilation Nation Policy.pdf
57 Bidens Annihilation Nation Policy.pdf57 Bidens Annihilation Nation Policy.pdf
57 Bidens Annihilation Nation Policy.pdf
 
Geostrategic significance of South Asian countries.ppt
Geostrategic significance of South Asian countries.pptGeostrategic significance of South Asian countries.ppt
Geostrategic significance of South Asian countries.ppt
 
15042024_First India Newspaper Jaipur.pdf
15042024_First India Newspaper Jaipur.pdf15042024_First India Newspaper Jaipur.pdf
15042024_First India Newspaper Jaipur.pdf
 
Rohan Jaitley: Central Gov't Standing Counsel for Justice
Rohan Jaitley: Central Gov't Standing Counsel for JusticeRohan Jaitley: Central Gov't Standing Counsel for Justice
Rohan Jaitley: Central Gov't Standing Counsel for Justice
 
IndiaWest: Your Trusted Source for Today's Global News
IndiaWest: Your Trusted Source for Today's Global NewsIndiaWest: Your Trusted Source for Today's Global News
IndiaWest: Your Trusted Source for Today's Global News
 
Foreign Relation of Pakistan with Neighboring Countries.pptx
Foreign Relation of Pakistan with Neighboring Countries.pptxForeign Relation of Pakistan with Neighboring Countries.pptx
Foreign Relation of Pakistan with Neighboring Countries.pptx
 

In Italia si lavora 'solo' 30,7 anni, fanalino di coda Ue

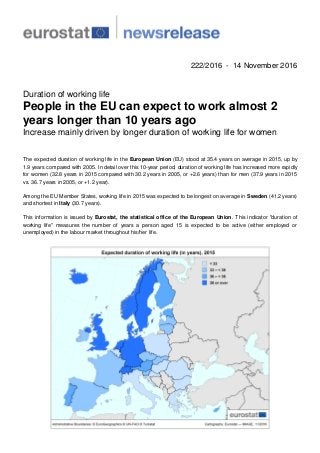
  • 1. 222/2016 - 14 November 2016 Duration of working life People in the EU can expect to work almost 2 years longer than 10 years ago Increase mainly driven by longer duration of working life for women The expected duration of working life in the European Union (EU) stood at 35.4 years on average in 2015, up by 1.9 years compared with 2005. In detail over this 10-year period, duration of working life has increased more rapidly for women (32.8 years in 2015 compared with 30.2 years in 2005, or +2.6 years) than for men (37.9 years in 2015 vs. 36.7 years in 2005, or +1.2 year). Among the EU Member States, working life in 2015 was expected to be longest on average in Sweden (41.2 years) and shortest in Italy (30.7 years). This information is issued by Eurostat, the statistical office of the European Union. This indicator "duration of working life" measures the number of years a person aged 15 is expected to be active (either employed or unemployed) in the labour market throughout his/her life.
  • 2. Working life more than ten years longer in Sweden than in Italy Across the EU Member States, the average working life was in 2015 expected to be the longest in Sweden (41.2 years), ahead of the Netherlands (39.9 years), Denmark (39.2 years), the United Kingdom (38.6 years) and Germany (38.0 years). At the opposite end of the scale, working life was expected to last less than 33 years in Italy (30.7 years), Bulgaria (32.1 years), Greece (32.3 years), Belgium, Croatia, Hungary and Poland (32.6 years each) as well as Romania (32.8 years). In all Member States except Lithuania, duration of working life was expected in 2015 to be longer for men than for women. Largest increase of duration of working life in Malta, smallest in Denmark Between 2005 and 2015, the expected duration of working life has increased in all EU Member States, albeit to different extents. It has risen the most in Malta (+5.1 years), followed by Hungary (+4.2 years), Luxembourg (+3.1 years), Estonia (+3.0 years) and Lithuania (+2.9 years), while it remained nearly the same in Denmark (+0.2 year), Portugal (+0.3 year) and Ireland (+0.4 year). The overall increase in duration of working life is generally driven across Member States by the change in women's duration of working life. This latter has increased between 2005 and 2015 in all EU Member States, notably in Malta (+8.6 years), Spain (+5.1 years), Luxembourg (+4.7 years), Hungary (+4.0 years), Cyprus (+3.6 years), Lithuania (+3.5 years), Germany and Austria (+3.4 years each). In contrast, duration of working life for men has dropped in five Member States: Cyprus (-1.9 years), Greece (-1.4 years), Ireland (-1.0 year), Spain (-0.7 year), and Portugal (-0.6 year). Average expected years of working life in the EU Member States, 2005-2015 Total Of which: Men Women 2005 2015 Change 2015/2005 (in years) 2005 2015 Change 2015/2005 (in years) 2005 2015 Change 2015/2005 (in years) EU 33.5 35.4 1.9 36.7 37.9 1.2 30.2 32.8 2.6 Belgium 31.4 32.6 1.2 34.6 34.6 0.0 28.1 30.4 2.3 Bulgaria 29.6 32.1 2.5 31.3 33.4 2.1 27.7 30.7 3.0 Czech Republic 33.7 35.1 1.4 36.8 38.2 1.4 30.4 31.9 1.5 Denmark 39.0 39.2 0.2 40.8 40.9 0.1 37.1 37.5 0.4 Germany 35.6 38.0 2.4 38.6 40.1 1.5 32.4 35.8 3.4 Estonia 34.0 37.0 3.0 34.2 37.6 3.4 33.8 36.4 2.6 Ireland 34.6 35.0 0.4 39.9 38.9 -1.0 29.1 30.9 1.8 Greece 31.6 32.3 0.7 37.0 35.6 -1.4 25.8 28.9 3.1 Spain 32.8 34.9 2.1 37.9 37.2 -0.7 27.4 32.5 5.1 France 32.9 34.9 2.0 35.1 36.6 1.5 30.6 33.0 2.4 Croatia 31.4 32.6 1.2 33.7 34.5 0.8 28.8 30.7 1.9 Italy 29.6 30.7 1.1 35.2 35.4 0.2 23.7 25.7 2.0 Cyprus 35.7 36.4 0.7 40.9 39.0 -1.9 30.1 33.7 3.6 Latvia 33.1 35.2 2.1 34.0 35.4 1.4 32.1 35.0 2.9 Lithuania 31.9 34.8 2.9 32.2 34.5 2.3 31.6 35.1 3.5 Luxembourg 30.4 33.5 3.1 34.4 35.8 1.4 26.3 31.0 4.7 Hungary 28.4 32.6 4.2 30.7 34.9 4.2 26.0 30.0 4.0 Malta 28.3 33.4 5.1 38.2 39.9 1.7 18.1 26.7 8.6 Netherlands 37.5 39.9 2.4 40.8 42.5 1.7 34.0 37.2 3.2 Austria 34.1 36.7 2.6 37.0 38.8 1.8 31.1 34.5 3.4 Poland 30.6 32.6 2.0 33.0 35.2 2.2 28.1 29.9 1.8 Portugal 36.5 36.8 0.3 38.9 38.3 -0.6 34.0 35.3 1.3 Romania 31.1 32.8 1.7 33.4 36.0 2.6 28.7 29.4 0.7 Slovenia 33.5 34.3 0.8 35.3 35.7 0.4 31.5 32.8 1.3 Slovakia 32.3 33.5 1.2 35.3 35.9 0.6 29.2 30.9 1.7 Finland 35.9 37.6 1.7 36.6 38.1 1.5 35.3 37.2 1.9 Sweden 38.9 41.2 2.3 40.1 42.2 2.1 37.6 40.1 2.5 United Kingdom 37.4 38.6 1.2 40.5 41.2 0.7 34.1 35.9 1.8 Iceland 45.0 46.6 1.6 47.4 48.6 1.2 42.6 44.7 2.1 Norway 38.4 39.8 1.4 39.9 41.0 1.1 36.8 38.5 1.7 Switzerland 40.1 42.5 2.4 43.1 44.7 1.6 36.8 40.1 3.3 The source dataset can be found here.
  • 3. Geographical information The European Union (EU) includes Belgium, Bulgaria, the Czech Republic, Denmark, Germany, Estonia, Ireland, Greece, Spain, France, Croatia, Italy, Cyprus, Latvia, Lithuania, Luxembourg, Hungary, Malta, the Netherlands, Austria, Poland, Portugal, Romania, Slovenia, Slovakia, Finland, Sweden and the United Kingdom. Methods and definitions The duration of working life indicator measures the number of years a person aged 15 is expected to be active (meaning either employed or unemployed) in the labour market throughout his/her life. This indicator is derived from demographic data and labour market data (EU-LFS survey). Data refer to the resident population and therefore results relate to persons resident in a country irrespective of the country where those persons work. This difference may be significant in countries with large cross-border flows. For further information, please consult the Eurostat EU-LFS publication. For more information Eurostat website section dedicated to the EU Labour Force Survey (LFS). Eurostat database on EU-LFS results. Issued by: Eurostat Press Office Vincent BOURGEAIS Tel: +352-4301-33 444 eurostat-pressoffice@ec.europa.eu ec.europa.eu/eurostat Production of data: Havard LIEN Tel: +352-4301-35 226 havard.lien@ec.europa.eu @EU_Eurostat Media requests: Eurostat media support / Tel: +352-4301-33 408 / eurostat-mediasupport@ec.europa.eu