SlideShare a Scribd company logo
1 of 15
Dynamics  of GDP   9 months of 2008
Dynamics of Foreign Currencies
3 022,2  3 022.2 1 816,40  1 816.40 803,60  803.60 3 053,0  3 053.0 2180,6  2180.6 Paid services to population, billion soums 8 735,6  8 735.6 5 522,20  5 522.20 2 548,80  2 548.80 9 464,0  9 464.0 7460,8  7460.8 Retail trade, billion soums 47,1  47.1 30,1  30.1 13,2  13.2 56,5  56.5 52  52 Passenger, billion passenger-kilometers 61,5  61.5 39,9  39.9 18,5  18.5 78,9  78.9 73,9  73.9 Turnover, billion ton-kilometers 2 482,0  2 482.0 1 464,10  1 464.10 496,70  496.70 2 593,2  2 593.2 1843,4  1843.4 Construction, billion soums 5 809,8  5 809.8 3 713,10  3 713.10 1 622,80  1 622.80 5 479,7  5 479.7 3383,3  3383.3 Инвестиции в основные средства, млрд. сум  Investments in fixed assets, billion soums 5 164,5  5 164.5 3 172,80  3 172.80 1 440,10  1 440.10 5 312,4  5 312.4 4069,7  4069.7 Production of consumer goods, billion soums 7 686,8  7 686.8 4 281,30  4 281.30 863,20  863.20 8 988,9  8 988.9 7314  7314 Agricultural production, billion soums 16 762,6  16 762.6 10 965,10  10 965.10 5 184,70  5 184.70 18 318,7  18 318.7 14521,1  14521.1 Industrial production, billion soums 11 664,3  11 664.3 7 278,20  7 278.20 3 324,40  3 324.40 12 409,8  12 409.8 9538,9  9538.9 Money expenditure of population to purchase goods and services, billion soums 15 434,3  15 434.3 9 474,20  9 474.20 4 431,70  4 431.70 16 572,8  16 572.8 12680,7  12680.7 Money expenditures and savings billion soums 15 779,2  15 779.2 9 649,50  9 649.50 4 515,30  4 515.30 16 872,7  16 872.7 12954,9  12954.9 Incomes of people, billion soums       1 040,1  1 040.1 777,5  777.5 GDP per capita, thousand sum 24 720,5  24 720.5 13 559,90  13 559.90 5 580,40  5 580.40 28 186,2  28 186.2 20759,3  20759.3 GDP, billion soums           Economic structure 27,4  27.4 27,3  27.3 27,2  27.2 27,1  27.1 26,7  26.7 Population, million people.           Population and employment 9M08 1H08 1 Q08 2007 2006  
$ 2 272.33 $ 1 396.55 $620.36  $ 2 415.98 $ 1 788.36 Paid services to population, million $ 6 568.12 $ 4 245.77 $ 1 967.61 $ 7 489.30 $ 6 118.77 Retail, million $ 1 866.17 $ 1 125.68 $383.44  $ 2 052.12 $ 1 511.81 Construction, million $ 4 368.27 $ 2 854.84 $ 1 252.76 $ 4 336.34 $ 2 774.72 Investments in fixed assets, million dollars $ 3 883.08 $ 2 439.42 $ 1 111.72 $ 4 203.95 $ 3 337.65 Production of consumer goods, U.S. $ million $ 5 779.55 $ 3 291.70 $666.37  $ 7 113.33 $ 5 998.38 Agricultural production, million $ 12 603.46 $ 8 430.57 $ 4 002.46 $ 14 496.43 $ 11 909.08 Industrial production, million $ 8 770.15 $ 5 595.88 $ 2 566.36 $ 9 820.44 $ 7 823.07 Money expenditure of population for the purchase of goods and services, million U.S. $ $ 11 604.74 $ 7 284.29 $ 3 421.16 $ 13 114.82 $ 10 399.73 Money expenditures and savings, million $ 11 864.06 $ 7 419.07 $ 3 485.70 $ 13 352.14 $ 10 624.61 Cash income, million       823.06 637.65 GDP per capita, thousand sum $ 18 586.84 $ 10 425.60 $ 4 307.93 $ 22 305.03 $ 17 025.17 GDP million           Economic structure
$ 4 462.7 $ 2 437.90 $778.20  $ 3 755.9 $ 1 988,3 Trade balance (+,-) $ 5 634.8 $ 3 682.70 $ 1 842.20 $ 5 235.6 $ 4 396.2 Imports (million U.S. $) $ 10 097.5 $ 6 120,60 $ 2 620.40 $ 8 991.5 $ 6 384.5 Exports (million U.S. $)           Including: $ 15 732.3 $ 9 803.30 $ 4 462.60 $ 14 227.1 $ 10 780.7 Foreign trade turnover ($ million)           Trade Balance
4,5%    2,40% 6,80% 6,80% Inflation,% 53.2 54.2 53.2 49.4 44.8 The official rate of UZS to RUB (average) 1 928.9 1 982.36 1 924.38 1 728.7 1531.2 The official rate of UZS to EURO (annual average) 1 330.0 1 300.64 1 295.38 1 263.7 1219.3 The official rate of UZS to USD (annual average) 14,0% 14,00% 14,00% 14,00% 14,00% The refinancing rate (% pa)           Monetary system
Investments
Social sphere Changes in size MRZP (sum)   33645  30040  25030  22350  18625  14900  12415  Benefit for the elderly  55550  49600  41330  36900  30750  24600  20500  Benefit disabled  28040  25040  20865  18630  15525  12420  10350  Zero discharge  55550  49600  41330  36900  30750  24600  20500  Retirement age  28040  25040  20865  18630  15525  12420  10350  MRZP  16.11.08  01.09.08  01.04.08  16.11.07  01.08.07  01.11.06  01.07.06   
Social sphere Changes in size MRZP ($ U.S.)   $ 25.09  $ 22.74  $ 19.28  $ 17.42  $ 14.69  $ 12.09  $ 10.14  Benefit for the elderly  $ 41.43  $ 37.55  $ 31.84  $ 28.76  $ 24.25  $ 19.96  $ 16.74  Benefit disabled  $ 20.91  $ 18.96  $ 16.07  $ 14.52  $ 12.24  $ 10.08  $ 8.45  Zero discharge  $ 41.43  $ 37.55  $ 31.84  $ 28.76  $ 24.25  $ 19.96  $ 16.74  Retirement age  $ 20.91  $ 18.96  $ 16.07  $ 14.52  $ 12.24  $ 10.08  $ 8.45  MRZP  16.11.08  01.09.08  01.04.08  16.11.07  01.08.07  01.11.06  01.07.06   
Cash Flows in Uzbekistan
Dynamics of Trade
 
Structure of exports of Uzbekistan
Structure import of Uzbekistan
 

More Related Content

Viewers also liked

Return of Video eLearning as DIY (Do It Yourself)
Return of Video eLearning as DIY (Do It Yourself)Return of Video eLearning as DIY (Do It Yourself)
Return of Video eLearning as DIY (Do It Yourself)Upside Learning Solutions
 
Top 13 Qualities of an Ideal Instructional Designer
Top 13 Qualities of an Ideal Instructional DesignerTop 13 Qualities of an Ideal Instructional Designer
Top 13 Qualities of an Ideal Instructional DesignerUpside Learning Solutions
 
Pedagogy and School Leadership
Pedagogy  and School LeadershipPedagogy  and School Leadership
Pedagogy and School LeadershipJudy O'Connell
 
Cybersecurity Health Checks: Safeguarding Your Organisation
Cybersecurity Health Checks: Safeguarding Your OrganisationCybersecurity Health Checks: Safeguarding Your Organisation
Cybersecurity Health Checks: Safeguarding Your OrganisationLinkedIn Learning Solutions
 
Colleges that get you the BEST internships!
Colleges that get you the BEST internships!Colleges that get you the BEST internships!
Colleges that get you the BEST internships!The Princeton Review
 
Ruang lingkup desain pembelajaran
Ruang lingkup desain pembelajaranRuang lingkup desain pembelajaran
Ruang lingkup desain pembelajaranUwes Chaeruman
 
What Happens When Kids Learn To Code?
What Happens When Kids Learn To Code?What Happens When Kids Learn To Code?
What Happens When Kids Learn To Code?Vizwik
 
Here Comes The iPad Generation - Future of Higher Education 2015
Here Comes The iPad Generation - Future of Higher Education 2015Here Comes The iPad Generation - Future of Higher Education 2015
Here Comes The iPad Generation - Future of Higher Education 2015Martin Hamilton
 
3 Things to Focus on for Creating Engaging Multi-device eLearning
3 Things to Focus on for Creating Engaging Multi-device eLearning3 Things to Focus on for Creating Engaging Multi-device eLearning
3 Things to Focus on for Creating Engaging Multi-device eLearningUpside Learning Solutions
 
The CRUX of the Matter: Amplifying Authentic Voices Across the Institution
The CRUX of the Matter: Amplifying Authentic Voices Across the InstitutionThe CRUX of the Matter: Amplifying Authentic Voices Across the Institution
The CRUX of the Matter: Amplifying Authentic Voices Across the InstitutionSarah Maxell Crosby
 
Create a productive workplace
Create a productive workplaceCreate a productive workplace
Create a productive workplaceDaniel Goleman
 
Digital Assessment Tools and Resources
Digital Assessment Tools and ResourcesDigital Assessment Tools and Resources
Digital Assessment Tools and ResourcesShelly Sanchez Terrell
 

Viewers also liked (16)

Return of Video eLearning as DIY (Do It Yourself)
Return of Video eLearning as DIY (Do It Yourself)Return of Video eLearning as DIY (Do It Yourself)
Return of Video eLearning as DIY (Do It Yourself)
 
Top 13 Qualities of an Ideal Instructional Designer
Top 13 Qualities of an Ideal Instructional DesignerTop 13 Qualities of an Ideal Instructional Designer
Top 13 Qualities of an Ideal Instructional Designer
 
Venezuela Technology Integration 2015
Venezuela Technology Integration 2015Venezuela Technology Integration 2015
Venezuela Technology Integration 2015
 
MOOCs: still a viable business model?
MOOCs: still a viable business model?MOOCs: still a viable business model?
MOOCs: still a viable business model?
 
Pedagogy and School Leadership
Pedagogy  and School LeadershipPedagogy  and School Leadership
Pedagogy and School Leadership
 
Cybersecurity Health Checks: Safeguarding Your Organisation
Cybersecurity Health Checks: Safeguarding Your OrganisationCybersecurity Health Checks: Safeguarding Your Organisation
Cybersecurity Health Checks: Safeguarding Your Organisation
 
Colleges that get you the BEST internships!
Colleges that get you the BEST internships!Colleges that get you the BEST internships!
Colleges that get you the BEST internships!
 
Ruang lingkup desain pembelajaran
Ruang lingkup desain pembelajaranRuang lingkup desain pembelajaran
Ruang lingkup desain pembelajaran
 
What Happens When Kids Learn To Code?
What Happens When Kids Learn To Code?What Happens When Kids Learn To Code?
What Happens When Kids Learn To Code?
 
The Design Of Interaction For eLearning
The Design Of Interaction For eLearningThe Design Of Interaction For eLearning
The Design Of Interaction For eLearning
 
Here Comes The iPad Generation - Future of Higher Education 2015
Here Comes The iPad Generation - Future of Higher Education 2015Here Comes The iPad Generation - Future of Higher Education 2015
Here Comes The iPad Generation - Future of Higher Education 2015
 
3 Things to Focus on for Creating Engaging Multi-device eLearning
3 Things to Focus on for Creating Engaging Multi-device eLearning3 Things to Focus on for Creating Engaging Multi-device eLearning
3 Things to Focus on for Creating Engaging Multi-device eLearning
 
The CRUX of the Matter: Amplifying Authentic Voices Across the Institution
The CRUX of the Matter: Amplifying Authentic Voices Across the InstitutionThe CRUX of the Matter: Amplifying Authentic Voices Across the Institution
The CRUX of the Matter: Amplifying Authentic Voices Across the Institution
 
Converting eLearning to mLearning
Converting eLearning to mLearning Converting eLearning to mLearning
Converting eLearning to mLearning
 
Create a productive workplace
Create a productive workplaceCreate a productive workplace
Create a productive workplace
 
Digital Assessment Tools and Resources
Digital Assessment Tools and ResourcesDigital Assessment Tools and Resources
Digital Assessment Tools and Resources
 

Similar to Dynamics Of Gdp

July 2021 - Market Report
July 2021 - Market Report July 2021 - Market Report
July 2021 - Market Report Michelle Makos
 
September 2020 - Market Report - Toronto & GTA Housing Sales
September 2020 - Market Report - Toronto & GTA Housing SalesSeptember 2020 - Market Report - Toronto & GTA Housing Sales
September 2020 - Market Report - Toronto & GTA Housing SalesMichelle Makos
 
Principals of Business Finance
Principals of Business FinancePrincipals of Business Finance
Principals of Business FinanceKathleen Boushele
 
Socio econ data_2014_e
Socio econ data_2014_eSocio econ data_2014_e
Socio econ data_2014_eNiluka Darshi
 
Brunswick (BC) Pitch - Jonathan Chang - FINAL COPY
Brunswick (BC) Pitch - Jonathan Chang - FINAL COPYBrunswick (BC) Pitch - Jonathan Chang - FINAL COPY
Brunswick (BC) Pitch - Jonathan Chang - FINAL COPYJonathan Chang
 
Financial Forecasting
Financial ForecastingFinancial Forecasting
Financial ForecastingJamariHodges1
 
2015 q2 google_earnings_slides
2015 q2 google_earnings_slides2015 q2 google_earnings_slides
2015 q2 google_earnings_slidesSergey Ulankin
 
Market Watch June 2013
Market Watch June 2013Market Watch June 2013
Market Watch June 2013Chaba Tamasi
 
WatchOver - Alzheimer's Caregiver Wearable Technology
WatchOver - Alzheimer's Caregiver Wearable TechnologyWatchOver - Alzheimer's Caregiver Wearable Technology
WatchOver - Alzheimer's Caregiver Wearable TechnologyJohn W. Quinn
 
October Market Watch is Here !
October Market Watch is Here !October Market Watch is Here !
October Market Watch is Here !Michelle Makos
 
Financial Forecast
Financial ForecastFinancial Forecast
Financial ForecastMarc Tejeda
 
June Market Report 2014
June Market Report 2014June Market Report 2014
June Market Report 2014Michelle Makos
 
Market Watch APRIL 2015
Market Watch APRIL 2015Market Watch APRIL 2015
Market Watch APRIL 2015Chaba Tamasi
 
Financial statements
Financial statementsFinancial statements
Financial statementsBritteny2
 
Financial Forecasting
Financial ForecastingFinancial Forecasting
Financial ForecastingTravonnLee
 
2222020 Report Pagehttpsww3.capsim.comcgi-bindispla.docx
2222020 Report Pagehttpsww3.capsim.comcgi-bindispla.docx2222020 Report Pagehttpsww3.capsim.comcgi-bindispla.docx
2222020 Report Pagehttpsww3.capsim.comcgi-bindispla.docxRAJU852744
 
November Market Watch 2020
November Market Watch 2020November Market Watch 2020
November Market Watch 2020Michelle Makos
 

Similar to Dynamics Of Gdp (20)

Financial forecast
Financial forecastFinancial forecast
Financial forecast
 
July 2021 - Market Report
July 2021 - Market Report July 2021 - Market Report
July 2021 - Market Report
 
delaura 02 restaurant-projections 1
delaura 02 restaurant-projections 1delaura 02 restaurant-projections 1
delaura 02 restaurant-projections 1
 
September 2020 - Market Report - Toronto & GTA Housing Sales
September 2020 - Market Report - Toronto & GTA Housing SalesSeptember 2020 - Market Report - Toronto & GTA Housing Sales
September 2020 - Market Report - Toronto & GTA Housing Sales
 
Principals of Business Finance
Principals of Business FinancePrincipals of Business Finance
Principals of Business Finance
 
Socio econ data_2014_e
Socio econ data_2014_eSocio econ data_2014_e
Socio econ data_2014_e
 
Brunswick (BC) Pitch - Jonathan Chang - FINAL COPY
Brunswick (BC) Pitch - Jonathan Chang - FINAL COPYBrunswick (BC) Pitch - Jonathan Chang - FINAL COPY
Brunswick (BC) Pitch - Jonathan Chang - FINAL COPY
 
Financial Forecasting
Financial ForecastingFinancial Forecasting
Financial Forecasting
 
2015 q2 google_earnings_slides
2015 q2 google_earnings_slides2015 q2 google_earnings_slides
2015 q2 google_earnings_slides
 
Market Watch June 2013
Market Watch June 2013Market Watch June 2013
Market Watch June 2013
 
Exhibits - Copy
Exhibits - CopyExhibits - Copy
Exhibits - Copy
 
WatchOver - Alzheimer's Caregiver Wearable Technology
WatchOver - Alzheimer's Caregiver Wearable TechnologyWatchOver - Alzheimer's Caregiver Wearable Technology
WatchOver - Alzheimer's Caregiver Wearable Technology
 
October Market Watch is Here !
October Market Watch is Here !October Market Watch is Here !
October Market Watch is Here !
 
Financial Forecast
Financial ForecastFinancial Forecast
Financial Forecast
 
June Market Report 2014
June Market Report 2014June Market Report 2014
June Market Report 2014
 
Market Watch APRIL 2015
Market Watch APRIL 2015Market Watch APRIL 2015
Market Watch APRIL 2015
 
Financial statements
Financial statementsFinancial statements
Financial statements
 
Financial Forecasting
Financial ForecastingFinancial Forecasting
Financial Forecasting
 
2222020 Report Pagehttpsww3.capsim.comcgi-bindispla.docx
2222020 Report Pagehttpsww3.capsim.comcgi-bindispla.docx2222020 Report Pagehttpsww3.capsim.comcgi-bindispla.docx
2222020 Report Pagehttpsww3.capsim.comcgi-bindispla.docx
 
November Market Watch 2020
November Market Watch 2020November Market Watch 2020
November Market Watch 2020
 

Dynamics Of Gdp

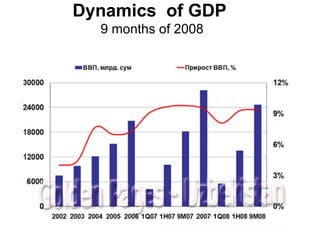
  • 1. Dynamics of GDP 9 months of 2008
  • 2. Dynamics of Foreign Currencies
  • 3. 3 022,2 3 022.2 1 816,40 1 816.40 803,60 803.60 3 053,0 3 053.0 2180,6 2180.6 Paid services to population, billion soums 8 735,6 8 735.6 5 522,20 5 522.20 2 548,80 2 548.80 9 464,0 9 464.0 7460,8 7460.8 Retail trade, billion soums 47,1 47.1 30,1 30.1 13,2 13.2 56,5 56.5 52 52 Passenger, billion passenger-kilometers 61,5 61.5 39,9 39.9 18,5 18.5 78,9 78.9 73,9 73.9 Turnover, billion ton-kilometers 2 482,0 2 482.0 1 464,10 1 464.10 496,70 496.70 2 593,2 2 593.2 1843,4 1843.4 Construction, billion soums 5 809,8 5 809.8 3 713,10 3 713.10 1 622,80 1 622.80 5 479,7 5 479.7 3383,3 3383.3 Инвестиции в основные средства, млрд. сум Investments in fixed assets, billion soums 5 164,5 5 164.5 3 172,80 3 172.80 1 440,10 1 440.10 5 312,4 5 312.4 4069,7 4069.7 Production of consumer goods, billion soums 7 686,8 7 686.8 4 281,30 4 281.30 863,20 863.20 8 988,9 8 988.9 7314 7314 Agricultural production, billion soums 16 762,6 16 762.6 10 965,10 10 965.10 5 184,70 5 184.70 18 318,7 18 318.7 14521,1 14521.1 Industrial production, billion soums 11 664,3 11 664.3 7 278,20 7 278.20 3 324,40 3 324.40 12 409,8 12 409.8 9538,9 9538.9 Money expenditure of population to purchase goods and services, billion soums 15 434,3 15 434.3 9 474,20 9 474.20 4 431,70 4 431.70 16 572,8 16 572.8 12680,7 12680.7 Money expenditures and savings billion soums 15 779,2 15 779.2 9 649,50 9 649.50 4 515,30 4 515.30 16 872,7 16 872.7 12954,9 12954.9 Incomes of people, billion soums       1 040,1 1 040.1 777,5 777.5 GDP per capita, thousand sum 24 720,5 24 720.5 13 559,90 13 559.90 5 580,40 5 580.40 28 186,2 28 186.2 20759,3 20759.3 GDP, billion soums           Economic structure 27,4 27.4 27,3 27.3 27,2 27.2 27,1 27.1 26,7 26.7 Population, million people.           Population and employment 9M08 1H08 1 Q08 2007 2006  
  • 4. $ 2 272.33 $ 1 396.55 $620.36 $ 2 415.98 $ 1 788.36 Paid services to population, million $ 6 568.12 $ 4 245.77 $ 1 967.61 $ 7 489.30 $ 6 118.77 Retail, million $ 1 866.17 $ 1 125.68 $383.44 $ 2 052.12 $ 1 511.81 Construction, million $ 4 368.27 $ 2 854.84 $ 1 252.76 $ 4 336.34 $ 2 774.72 Investments in fixed assets, million dollars $ 3 883.08 $ 2 439.42 $ 1 111.72 $ 4 203.95 $ 3 337.65 Production of consumer goods, U.S. $ million $ 5 779.55 $ 3 291.70 $666.37 $ 7 113.33 $ 5 998.38 Agricultural production, million $ 12 603.46 $ 8 430.57 $ 4 002.46 $ 14 496.43 $ 11 909.08 Industrial production, million $ 8 770.15 $ 5 595.88 $ 2 566.36 $ 9 820.44 $ 7 823.07 Money expenditure of population for the purchase of goods and services, million U.S. $ $ 11 604.74 $ 7 284.29 $ 3 421.16 $ 13 114.82 $ 10 399.73 Money expenditures and savings, million $ 11 864.06 $ 7 419.07 $ 3 485.70 $ 13 352.14 $ 10 624.61 Cash income, million       823.06 637.65 GDP per capita, thousand sum $ 18 586.84 $ 10 425.60 $ 4 307.93 $ 22 305.03 $ 17 025.17 GDP million           Economic structure
  • 5. $ 4 462.7 $ 2 437.90 $778.20 $ 3 755.9 $ 1 988,3 Trade balance (+,-) $ 5 634.8 $ 3 682.70 $ 1 842.20 $ 5 235.6 $ 4 396.2 Imports (million U.S. $) $ 10 097.5 $ 6 120,60 $ 2 620.40 $ 8 991.5 $ 6 384.5 Exports (million U.S. $)           Including: $ 15 732.3 $ 9 803.30 $ 4 462.60 $ 14 227.1 $ 10 780.7 Foreign trade turnover ($ million)           Trade Balance
  • 6. 4,5%   2,40% 6,80% 6,80% Inflation,% 53.2 54.2 53.2 49.4 44.8 The official rate of UZS to RUB (average) 1 928.9 1 982.36 1 924.38 1 728.7 1531.2 The official rate of UZS to EURO (annual average) 1 330.0 1 300.64 1 295.38 1 263.7 1219.3 The official rate of UZS to USD (annual average) 14,0% 14,00% 14,00% 14,00% 14,00% The refinancing rate (% pa)           Monetary system
  • 8. Social sphere Changes in size MRZP (sum) 33645 30040 25030 22350 18625 14900 12415 Benefit for the elderly 55550 49600 41330 36900 30750 24600 20500 Benefit disabled 28040 25040 20865 18630 15525 12420 10350 Zero discharge 55550 49600 41330 36900 30750 24600 20500 Retirement age 28040 25040 20865 18630 15525 12420 10350 MRZP 16.11.08 01.09.08 01.04.08 16.11.07 01.08.07 01.11.06 01.07.06  
  • 9. Social sphere Changes in size MRZP ($ U.S.) $ 25.09 $ 22.74 $ 19.28 $ 17.42 $ 14.69 $ 12.09 $ 10.14 Benefit for the elderly $ 41.43 $ 37.55 $ 31.84 $ 28.76 $ 24.25 $ 19.96 $ 16.74 Benefit disabled $ 20.91 $ 18.96 $ 16.07 $ 14.52 $ 12.24 $ 10.08 $ 8.45 Zero discharge $ 41.43 $ 37.55 $ 31.84 $ 28.76 $ 24.25 $ 19.96 $ 16.74 Retirement age $ 20.91 $ 18.96 $ 16.07 $ 14.52 $ 12.24 $ 10.08 $ 8.45 MRZP 16.11.08 01.09.08 01.04.08 16.11.07 01.08.07 01.11.06 01.07.06  
  • 10. Cash Flows in Uzbekistan
  • 12.  
  • 13. Structure of exports of Uzbekistan
  • 14. Structure import of Uzbekistan
  • 15.