
Recommended
More Related Content
Viewers also liked
Viewers also liked (19)
More from scottbrooker
More from scottbrooker (20)
Q1 2010 Ottawa Industrial Marketbeat
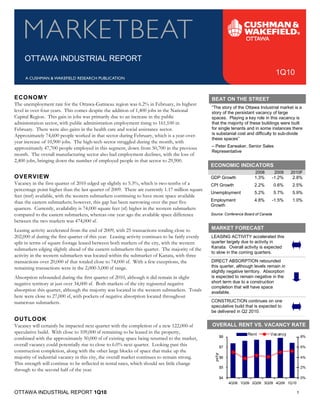
- 1. OTTAWA INDUSTRIAL REPORT 1Q10 ECONOMY BEAT ON THE STREET “The story of the Ottawa Industrial market is a The unemployment rate for the Ottawa-Gatineau region was 6.2% in February, its highest level in over four years. This comes despite the addition of 1,400 jobs in the National story of the persistant vacancy of large Capital Region. This gain in jobs was primarily due to an increase in the public spaces. Playing a key role in this vacancy is that the majority of these buildings were built for single tenants and in some instances there administration sector, with public administration employment rising to 161,100 in is substanial cost and difficulty to sub-divide February. There were also gains in the health care and social assistance sector. these spaces” Approximately 74,600 people worked in that sector during February, which is a year-over- – Peter Earwaker, Senior Sales year increase of 10,900 jobs. The high-tech sector struggled during the month, with Representative approximately 47,700 people employed in this segment, down from 50,700 in the previous month. The overall manufacturing sector also had employment declines, with the loss of ECONOMIC INDICATORS 2,400 jobs, bringing down the number of employed people in that sector to 29,900. 2008 2009 2010F OVERVIEW GDP Growth 1.3% -1.2% 2.8% Vacancy in the first quarter of 2010 edged up slightly to 5.3%, which is two-tenths of a CPI Growth 2.2% 0.6% 2.5% Unemployment 5.2% 5.7% 5.9% percentage point higher than the last quarter of 2009. There are currently 1.17 million square Employment 4.8% -1.5% 1.0% feet (msf) available, with the western submarkets continuing to have more space available Growth than the eastern submarkets; however, this gap has been narrowing over the past five quarters. Currently, availability is 74,000 square feet (sf) higher in the western submarkets compared to the eastern submarkets, whereas one year ago the available space difference Source: Conference Board of Canada between the two markets was 474,000 sf. Leasing activity accelerated from the end of 2009, with 25 transactions totaling close to MARKET FORECAST LEASING ACTIVITY accelerated this quarter largely due to activity in 202,000 sf during the first quarter of this year. Leasing activity continues to be fairly evenly Kanata. Overall activity is expected split in terms of square footage leased between both markets of the city, with the western to slow in the coming quarters. submarkets edging slightly ahead of the eastern submarkets this quarter. The majority of the DIRECT ABSORPTION rebounded activity in the western submarkets was located within the submarket of Kanata, with three this quarter, although levels remain in transactions over 20,000 sf that totaled close to 74,000 sf. With a few exceptions, the slightly negative territory. Absorption remaining transactions were in the 2,000-5,000 sf range. is expected to remain negative in the short term due to a construction Absorption rebounded during the first quarter of 2010, although it did remain in slight completion that will have space negative territory at just over 34,000 sf. Both markets of the city registered negative available. absorption this quarter, although the majority was located in the western submarkets. Totals CONSTRUCTION continues on one here were close to 27,000 sf, with pockets of negative absorption located throughout speculative build that is expected to numerous submarkets. be delivered in Q2 2010. OUTLOOK Vacancy will certainly be impacted next quarter with the completion of a new 122,000-sf OVERALL RENT VS. VACANCY RATE Rent Vac ancy $8 8% speculative build. With close to 109,000 sf remaining to be leased in the property, combined with the approximately 50,000 sf of existing space being returned to the market, $7 6% overall vacancy could potentially rise to close to 6.0% next quarter. Looking past this psf/yr construction completion, along with the other large blocks of space that make up the majority of industrial vacancy in this city, the overall market continues to remain strong. $6 4% $5 2% This strength will continue to be reflected in rental rates, which should see little change through to the second half of the year. $4 0% 4Q08 1Q09 2Q09 3Q09 4Q09 1Q10 OTTAWA INDUSTRIAL REPORT 1Q10 1
- 2. WEST OTTAWA INDUSTRIAL REPORT 1Q10 Vacancy Rate vs. Overall Rental Overall Available Space vs. Leasing Activity Rent Vacancy Available Spac e Leasing Activity $10 10.0% 820 $9 8.0% 620 sf ( '00 0 ) psf/yr $8 6.0% 420 $7 4.0% 220 20 $6 2.0% 4Q08 1Q09 2Q09 3Q09 4Q09 1Q10 4Q08 1Q09 2Q09 3Q09 4Q09 1Q10 After four consecutive quarters of vacancy trending downwards, The amount of available space located in the western submarkets vacancy rose in the western submarkets during the first quarter of ticked upwards this quarter to reach over 621,000 sf. Although this the year to reach 7.4%, an increase of five-tenths of a percentage marks the first increase in a year, the amount of available space is point from last quarter. lower than one year ago when approximately 666,000 sf was After abnormally higher than average rental rates last quarter, available. rental rates edged back down and are now more in line with the Leasing activity rebounded strongly this quarter to reach over previous four quarters. The weighted average rental rate for the 104,000 sf, a total that is almost three times higher than the fourth western submarkets this quarter was $7.23 per square foot (psf), a quarter of 2009. Kanata was the largest contributor to activity slight drop from the fourth quarter of 2009. Softening rental rates totals, with over 73,000 sf contained within three transactions. throughout numerous submarkets in the western submarket contributed to the overall decline. Available Space Trends Overall vs. Sublease Absorption Overall Sublease 150 800 650 100 s f (' 00 0) 500 sf ('0 00 ) 50 350 0 200 50 -50 4Q08 1Q09 2Q09 3Q09 4Q09 1Q10 -100 4Q08 1Q09 2Q09 3Q09 4Q09 1Q10 The amount of sublet space in the western submarkets almost Absorption dipped into negative territory this quarter at close to doubled this quarter to reach just over 100,000 sf, the highest 27,000 sf. This negative absorption was entirely the result of the amount in over a year. previously mentioned 45,000 sf block of space coming back on the This increase in the amount of sublet space was due to one block market. of space, totaling approximately 45,000 sf, coming back on the Absorption levels may continue to languish in negative territory as market. This space is not new and, in fact, had been available for close to 42,000 sf is forecasted to come on the market over the next almost two years—it was removed from the market for 2009, and six months, with 21,000 sf of that space located in one block. then returned to the market this quarter. Throughout the next six months absorption levels will be hampered by the fact that vacant space in the western submarkets is increasingly being contained in blocks of space over 10,000 sf. With demand for these pockets of space remaining fairly low, it will prove increasingly difficult to counteract space being returned to the market with new demand. 2
- 3. EAST OTTAWA INDUSTRIAL REPORT 1Q10 Vacancy Rate vs. Overall Rental Overall Available Space vs. Leasing Activity Rent Vacancy Available Space Leasing Activity $9 5.0% 4.0% 600 $8 500 3.0% sf ('0 00 ) 400 ps f/yr $7 2.0% 300 $6 200 1.0% 100 $5 0.0% 0 4Q08 1Q09 2Q09 3Q09 4Q09 1Q10 4Q08 1Q09 2Q09 3Q09 4Q09 1Q10 After a sharp climb in vacancy last quarter, vacancy stabilized in There was minimal change in the amount of available space located the eastern submarkets in the first quarter to sit at 4.0%, a one- in the eastern submarkets this quarter, increasing by only tenth of a percentage point increase from the fourth quarter of approximately 8,000 sf to reach close to 547,000 sf. 2009. As was the case with the western submarkets, leasing activity also Mirroring this stabilizing vacancy, rental rates remained virtually accelerated in the eastern submarkets this quarter to over 97,000 sf, unchanged this quarter compared to last, with the average rental the highest total in over five quarters. This activity was distributed rate sitting at $7.75 psf. in over half of the submarkets and, with a few exceptions, the transactions were in the 2,000-5,000 sf range. Available Space Trends Overall vs. Sublease Absorption Overall Sublease 150 100 600 50 500 0 sf ('0 0 0) 400 -50 sf ('0 0 0) 300 -100 200 -150 100 -200 0 -250 -300 4Q08 1Q09 2Q09 3Q09 4Q09 1Q10 4Q08 1Q09 2Q09 3Q09 4Q09 1Q10 The amount of sublet space available increased slightly this quarter Absorption rebounded this quarter, although figures remained in to reach just over 52,000 sf. negative territory at approximately 7,000 sf. This increase came as a result of one property having their entire It is anticipated that absorption will head back into positive territory premises of 12,000 sf becoming available for sublease. Currently, next quarter, as demand should be strong enough to counteract the the space available for sublease is located in six properties with the minimal 8,000 sf that is forecasted to come on the market during largest blocks being the above mentioned 12,000 sf and an the second quarter. additional block of 20,000 sf. 3
- 4. OTTAWA INDUSTRIAL REPORT 1Q10 MARKET/SUBMARKET STATISTICS Overall Direct YTD YTD YTD Average No. of Vacancy Vacancy Leasing Under Construction Overall Rental Market/Submarket Inventory Bldgs. Rate Rate Activity Construction Completions Absorption Rate West Ottawa Submarkets Kanata 3,211,680 54 10.2% 10.2% 73,633 0 0 50,443 $7.24 Bell’s Corners 363,842 12 2.2% 2.2% 0 0 0 (2,700) N/A Morrison/Queensview 415,519 9 0.0% 0.0% 16,206 0 0 16,206 N/A Woodward/Carling 540,800 23 7.2% 7.2% 0 0 0 0 N/A Ottawa Centre 833,814 29 3.4% 3.4% 0 0 0 0 $6.00 Ottawa South 695,111 11 11.9% 5.5% 0 0 0 (66,514) $6.50 West Merivale 554,593 27 3.0% 2.7% 4,070 0 0 (2,085) $8.57 East Merivale 587,403 26 7.6% 7.6% 0 0 0 (27,100) $9.20 Colonnade 621,923 21 9.9% 1.5% 10,440 0 0 10,440 $10.21 Rideau Heights 622,918 28 2.2% 1.9% 0 0 0 (5,455) N/A East Ottawa Submarkets South Walkley 441,680 15 1.9% 1.9% 0 0 0 0 $9.00 Ottawa Business Park 1,321,259 30 1.8% 1.8% 22,547 0 0 (12,841) $9.75 Coventry/Belfast 1,886,526 51 2.5% 1.9% 23,160 0 0 2,512 $8.18 Cyrville 2,161,942 59 3.2% 3.2% 35,741 0 0 3,581 $7.30 Sheffield 3,276,043 63 7.6% 7.3% 0 0 0 (9,800) $6.25 Sheffield/Lancaster 1,170,820 20 1.4% 1.1% 2,681 0 0 (1,121) $7.66 Stevenage/Belgreen 1,854,224 52 4.3% 3.2% 9,890 0 0 9,890 $8.00 South Gloucester/Albion 409,334 16 3.6% 2.5% 0 0 0 0 N/A Queensway 639,185 22 1.4% 1.0% 3,212 122,500 0 115 $8.00 Orleans 458,369 13 6.8% 6.8% 0 0 0 0 $7.50 Total 22,066,985 581 5.3% 4.6% 201,580 122,500 0 (34,429) $7.43 *Rental rates reflect $psf/year MARKET HIGHLIGHTS SIGNIFICANT 1Q10 NEW LEASE TRANSACTIONS BUILDING SUBMARKET TENANT SQ FT BLDG CLASS 302 Legget Drive Kanata Furoy’s Insulation 7,334 SIGNIFICANT 1Q10 SALE TRANSACTIONS BUILDING SUBMARKET BUYER SQ FT PURCHASE PRICE 1071-1091, 1111 Ages Drive Stevenage/Belgreen Insurance Corporation of British 109,928 $14,000,000 Columbia 2801 Sheffield Road Sheffield Business Park 1075748 Ontario Inc. 15,000 $1,350,000 SIGNIFICANT 1Q10 CONSTRUCTION COMPLETIONS BUILDING SUBMARKET MAJOR TENANT SQ FT COMPLETION DATE 1400 Ages Drive Stevenage/Belgreen Busy Bee Tools 20,900 03/10 SIGNIFICANT PROJECTS UNDER CONSTRUCTION BUILDING SUBMARKET MAJOR TENANT SQ FT COMPLETION DATE 1100 Polytek Street Queensway Business Park University of Ottawa 122,500 04/10 For industry-leading intelligence to support your real estate and This report contains information available to the public and has been relied upon by business decisions, go to Cushman & Wakefield’s Knowledge Cushman & Wakefield Ottawa on the basis that it is accurate and complete. Cushman & Wakefield Ottawa accepts no responsibility if this should prove not to be the case. No Center at www.cushmanwakefield.com/knowledge warranty or representation, express or implied, is made to the accuracy or completeness of the information contained herein, and same is submitted subject to errors, omissions, Cushman & Wakefield Ottawa change of price, rental or other conditions, withdrawal without notice, and to any special 99 Bank Street Suite 700 listing conditions imposed by our principals. Ottawa, ON K1P 1B9 (613) 236-7777 ©2010 Cushman & Wakefield Ottawa All rights reserved.