SlideShare a Scribd company logo
1 of 4
Download to read offline
OTTAWA OFFICE REPORT
                                                                                                                                                        2Q10


ECONOMY                                                                                         BEAT ON THE STREET
The National Capital Region added 2,600 jobs from April, with an overall increase of
                                                                                                “With the vacancy rate in the downtown core
26,300 jobs from last year, but with more workers entering the job market, the                  expected to rise, a contracting private sector,
unemployment rate for the Ottawa-Gatineau region remained at 6.0% in May. There are             and continued macro economic uncertainity,
                                                                                                tenants renewing leases or acquiring new
                                                                                                space in the downtown core can expect more
potential clouds on the horizon in the form of a freeze in governmental spending budgets,
                                                                                                flexible market conditions. One thing is for
which will likely lead to shrinkage in the public administration job sector. As of April,
                                                                                                sure, going forward tenants should focus on
total employment within this sector numbered 160,500. This contraction will likely create
a domino effect across numerous sectors, particularly the retail and wholesale sectors.         lease flexibility due to the uncertainity within
                                                                                                the market”.
OVERVIEW
                                                                                                –Ransome Drcar, Vice President Office
                                                                                                Leasing
The overall office market softened slightly this quarter with vacancy rising to 6.6%, a two-
tenths of a percentage point increase from the first quarter. Vacancy levels within the

                                                                                                ECONOMIC INDICATORS
Central market remained fairly consistent compared to the previous three quarters, rising

                                                                                                                                    2008                2009          2010F
three-tenths of a percentage point to 4.3%. With vacancy virtually unchanged in the

                                                                                                GDP Growth                          1.3%               -1.2%           2.8%
overall Suburban market, it was this slight uptick in Central area vacancy that led to the

                                                                                                CPI Growth                          2.2%               0.6%             2.5%
overall increase. Currently, there is 2.4 million square feet (msf) of available space across
the city, with 1.5 msf of that total located in the Suburban West market
                                                                                                Unemployment                        4.8%               5.7%             5.9%
                                                                                                Employment                          2.9%               -1.5%            1.0%
Absorption levels sharply decreased from last quarter with just over 2,000 square feet (sf)
                                                                                                Growth
of positive absorption, as negative absorption in the Central area was balanced out by
                                                                                                Source: Conference Board of Canada
positive absorption in the Suburban East market. Two entire buildings became fully
leased which, along with a construction completion, resulted in a total of 235,500 sf of

                                                                                                MARKET FORECAST
positive absorption, but it was barely enough to keep absorption in positive territory this
quarter. This low overall absorption figure is in all likelihood an indication of things to
come through the remainder of 2010 and into early 2011, as supply is increasingly               LEASING ACTIVITY surpassed all
                                                                                                expectations this quarter, largely due
                                                                                                to activity in the suburban markets.
expected to outpace demand.
Leasing activity continues to be very active with totals over 560,000 sf, bringing the year-    Activity from the federal government
                                                                                                will be a key determinant of whether
                                                                                                this pace of activity continues
to-date total to 1.1 msf. All three areas of the city had well over 100,000 sf of leasing
                                                                                                through the year.
activity this quarter, although close to 70% of the total was located in the Suburban West
submarkets. This high percentage was courtesy of the 145,000-sf transaction in Kanata
                                                                                                DIRECT ABSORPTION declined
                                                                                                significantly from last quarter totals
involving Research In Motion.
OUTLOOK                                                                                         and this downward trend is
                                                                                                anticipated to continue for the
                                                                                                remainder of 2010.
Although vacancy remained fairly stable from the first quarter and absorption levels
remained in positive territory (although barely), this was largely due to just two large
blocks of space, totalling 190,000 sf, coming off the market. It is still anticipated that      CONSTRUCTION was completed on
                                                                                                the new building for Accreditation
                                                                                                Canada, while construction
vacancy will head upwards and absorption will move into negative territory over the

                                                                                                continues on the new downtown core
second half of 2010 and into early 2011. In fact, vacancy projections have moved
                                                                                                office tower for EDC.
upwards from what was forecasted in the first quarter. Currently, an anticipated 725,000
sf of additional space is set to come on the overall Ottawa office market starting next
quarter and continuing through to January 1st 2011. Of that amount, 350,000 sf is located         OVERALL RENT VS. VACANCY
                                                                                                            Rent    Vacancy
within the downtown core. As it is extremely unlikely private sector demand will be               $ 20                                                                       10%
                                                                                                                                                                             8%
                                                                                                  $18
strong enough to counteract this additional space, landlords will be looking to activity
                                                                                                                                                                             6%
                                                                                                  $16
from the federal government. It is a safe assumption that this will occur to some extent in
                                                                                                                                                                             4%
the coming months as the government will be in the market for significant amounts of
                                                                                                  $14
                                                                                                                                                                             2%
swing space while existing buildings are retrofitted to meet current building standards.
                                                                                                  $12                                                                        0%

OTTAWA OFFICE REPORT 2Q10                                                                                 08        09        09        09        09        10        10 1
                                                                                                     4Q        1Q        2Q        3Q        4Q        1Q        2Q
OTTAWA OFFICE REPORT 2Q10


                                                                         Central Area
                         Overall Rental vs. Vacancy Rate                                 Overall Vacancy Rate Non-Core vs. Core

                                   Rental R ate           Vacancy Rate                                                     Core         Non-Core
                  $23.00                                             5.0%                               10.0%
                                                                     4.0%                               8.0%
                  $22.00
                                                                     3.0%                               6.0%
       p sf/yr


                  $21.00
                                                                     2.0%                               4.0%
                  $20.00
                                                                     1.0%                               2.0%
                  $19.00                                             0.0%                               0.0%
                            1Q09 2Q09 3Q09 4Q09 1Q10 2Q10                                                        1Q09 2Q09 3Q09 4Q09 1Q10 2Q10


 Asking rental rates remained virtually unchanged from last quarter,             Vacancy in the non-core declined for the second straight quarter to
  with the average rate sitting at $20.99 per square foot (psf) with               reach 4.6%, its lowest level in a year. This decline in vacancy can be
  rents in all three classes of space ticking upwards slightly.                    attributed to a significant decline in vacancy in the Byward Market,
  Downtown core class A rents were almost identical to last quarter                where vacancy fell by five-tenths of a percentage point to 5.8%. In
  at $25.67 psf. Looking ahead, class A asking rents may experience                this submarket, an entire building totaling 45,000 sf was leased by
  a slight softening due to a more competitive downtown core                       two tenants.
  market.                                                                         After remaining at 3.7% for two consecutive quarters, downtown
 Overall vacancy in the Central area edged up slightly in the second              core vacancy rose in the second quarter to 4.3%, with all classes of
  quarter to reach 4.3%, three-tenths of a percentage point higher                 space recording increases. Putting the possible federal government
  than last quarter. Vacancy is anticipated to continue to rise                    leasing requirements aside, vacancy in the downtown core could
  through the remainder of 2010.                                                   potentially rise to 6.1% by the first quarter of 2011.

                     Leasing Activity Non-Core vs. Core                                                  Absorption Non-Core vs. Core
                                         Core     Non-Core                                                                 Core     Non-Core
                                                                                                      200
                   300
                                                                                                      150
                   225                                                                                100
                                                                                         sf (' 000)
     sf (' 000)


                   150                                                                                 50
                                                                                                        0
                    75
                                                                                                      -50
                     0                                                                                -100
                           1Q09   2Q09    3Q09     4Q09     1Q10   2Q10                                      1Q09   2Q09     3Q09     4Q09     1Q10   2Q10

 Leasing activity in the non-core increased for the fourth                       Absorption in the non-core continued to improve this quarter, with
  consecutive quarter, reaching close to 67,000 sf. The vast majority              approximately 45,000 sf of positive absorption. In a reversal from
  of leasing activity was located within the Byward Market where an                the previous quarter, negative absorption in the Centretown market
  entire building totaling 45,000 sf was leased by Open Text and the               was offset by positive absorption in the Byward Market. This
  Federation of Canadian Municipalities.                                           positive absorption was courtesy of the previously mentioned
 Leasing activity in the downtown core slowed from last quarter’s                 45,000-sf transaction.
  levels to 118,000 sf. Leasing activity continues to be focused                  For the first time in a year, absorption within the downtown core
  within the class A segment, which contributed approximately 60%                  dipped into negative territory at close to 87,000 sf. Although all
  of the total for the downtown core. Once again, 180 Kent                         three classes within the downtown core registered negative
  continues to be the most active property in the class A segment,                 absorption, the majority was located in the class A and B segments.
  with approximately 33,000 sf leased this quarter. This 370,000-sf                While numerous buildings in the class B segments posted negative
  building is expected to be fully leased by the end of the year.                  absorption, there were only three class A properties where this
                                                                                   occurred. This space was located in pockets over 10,000 sf.


                                                                                                                                                             2
OTTAWA OFFICE REPORT 2Q10

                                                                          Suburban Area
                              Overall Rental vs. Vacancy Rate                                   Overall Vacancy Rate West vs. East

                                         Rental Rate          Vacanc y Rate                                                 West          East
              $16.00                                                      12.0%                  14.0%
                                                                                                 12.0%
                                                                          10.0%
              $14.00                                                                             10.0%
                                                                                                         8.0%
     psf/yr


                                                                          8.0%
                                                                                                         6.0%
              $12.00
                                                                          6.0%                           4.0%
                                                                                                         2.0%
              $10.00                                                      4.0%                           0.0%
                                   1Q09 2Q09 3Q09 4Q09 1Q10 2Q10                                                 1Q09 2Q09 3Q09 4Q09 1Q10 2Q10


 Vacancy in the overall Suburban market stabilized this quarter at                After three consecutive quarters of declining vacancy in the overall
  8.6%, just one-tenth of a percentage point increase from last                     Suburban West market vacancy was unchanged this quarter,
  quarter.                                                                          remaining at 10.7%. With increasing vacancy in the Nepean and
 The overall asking average rental rate for the Suburban market                    Ottawa West submarkets, it was declining vacancy in Kanata that
  contracted once again this quarter to $13.29 psf. Rental rates were               lead to the vacancy remaining unchanged. Vacancy in Kanata now
  on the decline in the Suburban West market and now sit at $13.11                  stands at 12.9%, down from 15% last quarter.
  psf, with lower rents reported in the class A and B segments. The                There was minimal change in vacancy in the overall Suburban East
  opposite was true in the Suburban East market, where overall                      market this quarter, increasing by three-tenths of a percentage point
  rental rates increased to $14.37 psf, with an increase in the class A             to 2.9%. There was an increase in vacancy in the Ottawa East
  segment.                                                                          submarket as the space vacated by Accreditation Canada officially
                                                                                    became available.

                               Leasing Activity West vs. East                                                   Absorption West vs. East

                                               W est   East                                                                W est   East
                             500                                                                         300

                                                                                                         200
                             350
                sf ('00 0)


                                                                                            sf ('00 0)


                                                                                                         100

                                                                                                           0
                             200
                                                                                                         -100
                             50                                                                          -200
                                    1Q09 2Q09 3Q09 4Q09 1Q10 2Q10
                                                                                                                 1Q09 2Q09 3Q09 4Q09 1Q10 2Q10

 Leasing activity in the western submarkets slowed this quarter, with             Absorption in the Suburban West market was almost nil this quarter
  a total of approximately 263,000 sf. Kanata by far was the most                   at just under 3,000 sf. Negative absorption in the Ottawa West and
  active, with close to 213,000 sf. Close to 70% of that total was                  Nepean submarkets was cancelled out by the positive absorption in
  located in one transaction alone; the leasing of Dell’s former                    Kanata of 106,000 sf, with the entire amount attributable to the
  145,000-sf call centre by Research In Motion.                                     previously mentioned Research In Motion transaction.
 Leasing activity dramatically increased in the overall Suburban East             Absorption in the eastern submarkets improved from last quarter’s
  market this quarter to close to 115,000 sf. The majority,                         amount and headed back into positive territory with close to 41,000
  approximately 90,000 sf, was located in the Ottawa East sub-                      sf. This absorption level was the result of the new 60,000-sf
  market where an 80,000 sf property was leased by JPMorgan                         building completion in the Gloucester submarket for Accreditation
  Chase.                                                                            Canada.


                                                                                                                                                     3
OTTAWA OFFICE REPORT 2Q10


MARKET/SUBMARKET STATISTICS
                                                                        Overall          Direct               YTD                                      YTD                     YTD            Direct Wtd. Avg.
                                                       No. of          Vacancy         Vacancy             Leasing             Under            Construction                Overall             Class A Gross
Market/Submarket                    Inventory          Bldgs.             Rate            Rate              Activity     Construction           Completions              Absorption               Rental Rate*
Downtown Core                     14,715,998              82              4.3%            3.1%             256,390          475,000                        0               (86,214)                    $48.36
Centretown                         1,769,448              34              3.7%            3.4%              36,640                  0                      0                  6,226                       N/A
Byward Market                        914,861              13              5.8%            4.9%              80,122                  0                      0                 46,623                    $36.22
Kanata                             4,990,246              62             12.9%            9.4%             393,122                  0                      0               239,022                     $22.63
Ottawa West                        3,777,207              58             12.5%           10.9%             119,773                  0                      0                (3,648)                    $33.12
Nepean                             5,455,838              83              7.4%            5.1%              76,811                  0                      0               (43,071)                    $27.23
Ottawa East                        3,790,796              53              3.4%            3.2%             120,443                  0                      0               (30,572)                    $27.26
Gloucester                         1,397,799              14              1.8%            1.8%              25,209                  0                60,000                  68,974                    $33.56
Total                             36,812,193             399              6.6%            5.1%           1,108,510          475,000                  60,000                197,340                     $38.74
* Rental rates reflect psf/year


MARKET HIGHLIGHTS
  SIGNIFICANT 2Q10 NEW LEASE TRANSACTIONS
  BUILDING                                      SUBMARKET                                TENANT                                                              SQ FT                                   BLDG CLASS

  1001 Farrar Road                              Kanata                                   Research In Motion                                              146,515                                                    A
  2220 Walkley Road                             Ottawa East                              JPMorgan Chase Bank                                              80,606                                                    B
  10 Rideau Street                              Byward Market                            Open Text                                                        32,500                                                    A

 SIGNIFICANT 2Q10 SALE TRANSACTIONS
  BUILDING                                      SUBMARKET                                BUYER                                                               SQ FT                             PURCHASE PRICE

  363 Coventry Road                             Ottawa East                              Osgoode Properties                                               33,500                                      $6,850,000
  283 Dalhousie Street                          Byward Market                            2232449 Ontario Inc.                                             11,000                                      $3,186,000

  SIGNIFICANT 2Q10 CONSTRUCTION COMPLETIONS
  BUILDING                                      SUBMARKET                                MAJOR TENANT                                                        SQ FT                           COMPLETION DATE

  1150 Cyrville Road                            Gloucester                               Accreditation Canada                                             60,000                                             04/10


  SIGNIFICANT PROJECTS UNDER CONSTRUCTION
  BUILDING                                      SUBMARKET                                MAJOR TENANT                                                        SQ FT                           COMPLETION DATE

  150 Slater Street                             Downtown Core                            EDC                                                             475,000                                             09/11


                                                For industry-leading intelligence to support your real estate and      This report contains information available to the public and has been relied upon by
                                                                                                                       Cushman & Wakefield Ottawa on the basis that it is accurate and complete. Cushman &
                                                business decisions, go to Cushman & Wakefield’s Knowledge              Wakefield Ottawa accepts no responsibility if this should prove not to be the case. No
                                                Center at www.cushmanwakefield.com/knowledge                           warranty or representation, express or implied, is made to the accuracy or completeness
                                                                                                                       of the information contained herein, and same is submitted subject to errors, omissions,
                                                Cushman & Wakefield Ottawa                                             change of price, rental or other conditions, withdrawal without notice, and to any special
                                                99 Bank Street Suite 700                                               listing conditions imposed by our principals.
                                                Ottawa, ON K1P 6B9                                                     ©2010 Cushman & Wakefield Ottawa. All rights reserved.
                                                (613) 236-7777

More Related Content

Viewers also liked

Earth moon system andie
Earth moon system andieEarth moon system andie
Earth moon system andiecharsh
 
Fertility Plus IATF
Fertility Plus IATFFertility Plus IATF
Fertility Plus IATFAgriPoint
 
Chapter 3 notes 1
Chapter 3 notes 1Chapter 3 notes 1
Chapter 3 notes 1charsh
 
Douglas Crockford Presentation Jsonsaga
Douglas Crockford Presentation JsonsagaDouglas Crockford Presentation Jsonsaga
Douglas Crockford Presentation JsonsagaAjax Experience 2009
 
Moon Phases[1]
Moon Phases[1]Moon Phases[1]
Moon Phases[1]charsh
 
Order of operations
Order of operationsOrder of operations
Order of operationsMegan Woods
 
Wed Ppt Review Cynthia
Wed Ppt Review CynthiaWed Ppt Review Cynthia
Wed Ppt Review Cynthiacharsh
 
20101029.wv.college uva peacebuilding
20101029.wv.college uva peacebuilding20101029.wv.college uva peacebuilding
20101029.wv.college uva peacebuildingWout Visser
 
200805.wv.sierra leone peacebuilding
200805.wv.sierra leone peacebuilding200805.wv.sierra leone peacebuilding
200805.wv.sierra leone peacebuildingWout Visser
 
Social, Sustainable Crowd Development v2
Social, Sustainable Crowd Development v2Social, Sustainable Crowd Development v2
Social, Sustainable Crowd Development v2TechNexxus, LLC
 
2011 Q2 Green Viewpoint
2011 Q2 Green Viewpoint2011 Q2 Green Viewpoint
2011 Q2 Green Viewpointscottbrooker
 

Viewers also liked (17)

Earth moon system andie
Earth moon system andieEarth moon system andie
Earth moon system andie
 
Fertility Plus IATF
Fertility Plus IATFFertility Plus IATF
Fertility Plus IATF
 
Chapter 3 notes 1
Chapter 3 notes 1Chapter 3 notes 1
Chapter 3 notes 1
 
Douglas Crockford Presentation Jsonsaga
Douglas Crockford Presentation JsonsagaDouglas Crockford Presentation Jsonsaga
Douglas Crockford Presentation Jsonsaga
 
Facts About Swine Flu
Facts About Swine FluFacts About Swine Flu
Facts About Swine Flu
 
1stconditional3 Eso
1stconditional3 Eso1stconditional3 Eso
1stconditional3 Eso
 
Moon Phases[1]
Moon Phases[1]Moon Phases[1]
Moon Phases[1]
 
Gaza project
Gaza projectGaza project
Gaza project
 
Order of operations
Order of operationsOrder of operations
Order of operations
 
Wed Ppt Review Cynthia
Wed Ppt Review CynthiaWed Ppt Review Cynthia
Wed Ppt Review Cynthia
 
20101029.wv.college uva peacebuilding
20101029.wv.college uva peacebuilding20101029.wv.college uva peacebuilding
20101029.wv.college uva peacebuilding
 
200805.wv.sierra leone peacebuilding
200805.wv.sierra leone peacebuilding200805.wv.sierra leone peacebuilding
200805.wv.sierra leone peacebuilding
 
Social, Sustainable Crowd Development v2
Social, Sustainable Crowd Development v2Social, Sustainable Crowd Development v2
Social, Sustainable Crowd Development v2
 
Fasting
FastingFasting
Fasting
 
Variability
VariabilityVariability
Variability
 
2011 Q2 Green Viewpoint
2011 Q2 Green Viewpoint2011 Q2 Green Viewpoint
2011 Q2 Green Viewpoint
 
Present simple-affirmative
Present simple-affirmativePresent simple-affirmative
Present simple-affirmative
 

More from scottbrooker

C&W Sustainability Services Brochure 2011
C&W Sustainability Services Brochure 2011C&W Sustainability Services Brochure 2011
C&W Sustainability Services Brochure 2011scottbrooker
 
2011 Green Building Index - US National Overview
2011 Green Building Index - US National Overview2011 Green Building Index - US National Overview
2011 Green Building Index - US National Overviewscottbrooker
 
Sustainability - Is It Really Influencing Investment Decisions
Sustainability - Is It Really Influencing Investment DecisionsSustainability - Is It Really Influencing Investment Decisions
Sustainability - Is It Really Influencing Investment Decisionsscottbrooker
 
Press Release 240111
Press Release 240111Press Release 240111
Press Release 240111scottbrooker
 
150 Slater Sublease Flyer
150 Slater Sublease Flyer150 Slater Sublease Flyer
150 Slater Sublease Flyerscottbrooker
 
Green Viewpoint Q3-2010
Green Viewpoint Q3-2010Green Viewpoint Q3-2010
Green Viewpoint Q3-2010scottbrooker
 
Mid Year Outlook 2010
Mid Year Outlook 2010Mid Year Outlook 2010
Mid Year Outlook 2010scottbrooker
 
Green Building Index Profile Report: Midtown NY
Green Building Index Profile Report: Midtown NYGreen Building Index Profile Report: Midtown NY
Green Building Index Profile Report: Midtown NYscottbrooker
 
The Economics of Sustainability in the Comemrcial Real Estate Sector
The Economics of Sustainability in the Comemrcial Real Estate SectorThe Economics of Sustainability in the Comemrcial Real Estate Sector
The Economics of Sustainability in the Comemrcial Real Estate Sectorscottbrooker
 
LEED Canada Buildings Review 2002-2009
LEED Canada Buildings Review 2002-2009LEED Canada Buildings Review 2002-2009
LEED Canada Buildings Review 2002-2009scottbrooker
 
UN Environmental Program SBCI Call To Action
UN Environmental Program SBCI Call To ActionUN Environmental Program SBCI Call To Action
UN Environmental Program SBCI Call To Actionscottbrooker
 
Green Lease Guide Final 05 Feb10
Green Lease Guide Final 05 Feb10Green Lease Guide Final 05 Feb10
Green Lease Guide Final 05 Feb10scottbrooker
 
Making a Sustainable Difference
Making a Sustainable DifferenceMaking a Sustainable Difference
Making a Sustainable Differencescottbrooker
 
Ottawa Green Real Estate
Ottawa Green Real EstateOttawa Green Real Estate
Ottawa Green Real Estatescottbrooker
 
Cushman & Wakefield Ottawa January Listing Report
Cushman & Wakefield Ottawa January Listing ReportCushman & Wakefield Ottawa January Listing Report
Cushman & Wakefield Ottawa January Listing Reportscottbrooker
 
Climate Change: Risks & Opportunities in the Canadian Commercial Real Est...
Climate Change: Risks & Opportunities in the Canadian Commercial Real Est...Climate Change: Risks & Opportunities in the Canadian Commercial Real Est...
Climate Change: Risks & Opportunities in the Canadian Commercial Real Est...scottbrooker
 
High Performance Green Building: What is it worth?
High Performance Green Building: What is it worth?High Performance Green Building: What is it worth?
High Performance Green Building: What is it worth?scottbrooker
 
C&W Ottawa October 2009 Listing Report
C&W Ottawa October 2009 Listing ReportC&W Ottawa October 2009 Listing Report
C&W Ottawa October 2009 Listing Reportscottbrooker
 

More from scottbrooker (18)

C&W Sustainability Services Brochure 2011
C&W Sustainability Services Brochure 2011C&W Sustainability Services Brochure 2011
C&W Sustainability Services Brochure 2011
 
2011 Green Building Index - US National Overview
2011 Green Building Index - US National Overview2011 Green Building Index - US National Overview
2011 Green Building Index - US National Overview
 
Sustainability - Is It Really Influencing Investment Decisions
Sustainability - Is It Really Influencing Investment DecisionsSustainability - Is It Really Influencing Investment Decisions
Sustainability - Is It Really Influencing Investment Decisions
 
Press Release 240111
Press Release 240111Press Release 240111
Press Release 240111
 
150 Slater Sublease Flyer
150 Slater Sublease Flyer150 Slater Sublease Flyer
150 Slater Sublease Flyer
 
Green Viewpoint Q3-2010
Green Viewpoint Q3-2010Green Viewpoint Q3-2010
Green Viewpoint Q3-2010
 
Mid Year Outlook 2010
Mid Year Outlook 2010Mid Year Outlook 2010
Mid Year Outlook 2010
 
Green Building Index Profile Report: Midtown NY
Green Building Index Profile Report: Midtown NYGreen Building Index Profile Report: Midtown NY
Green Building Index Profile Report: Midtown NY
 
The Economics of Sustainability in the Comemrcial Real Estate Sector
The Economics of Sustainability in the Comemrcial Real Estate SectorThe Economics of Sustainability in the Comemrcial Real Estate Sector
The Economics of Sustainability in the Comemrcial Real Estate Sector
 
LEED Canada Buildings Review 2002-2009
LEED Canada Buildings Review 2002-2009LEED Canada Buildings Review 2002-2009
LEED Canada Buildings Review 2002-2009
 
UN Environmental Program SBCI Call To Action
UN Environmental Program SBCI Call To ActionUN Environmental Program SBCI Call To Action
UN Environmental Program SBCI Call To Action
 
Green Lease Guide Final 05 Feb10
Green Lease Guide Final 05 Feb10Green Lease Guide Final 05 Feb10
Green Lease Guide Final 05 Feb10
 
Making a Sustainable Difference
Making a Sustainable DifferenceMaking a Sustainable Difference
Making a Sustainable Difference
 
Ottawa Green Real Estate
Ottawa Green Real EstateOttawa Green Real Estate
Ottawa Green Real Estate
 
Cushman & Wakefield Ottawa January Listing Report
Cushman & Wakefield Ottawa January Listing ReportCushman & Wakefield Ottawa January Listing Report
Cushman & Wakefield Ottawa January Listing Report
 
Climate Change: Risks & Opportunities in the Canadian Commercial Real Est...
Climate Change: Risks & Opportunities in the Canadian Commercial Real Est...Climate Change: Risks & Opportunities in the Canadian Commercial Real Est...
Climate Change: Risks & Opportunities in the Canadian Commercial Real Est...
 
High Performance Green Building: What is it worth?
High Performance Green Building: What is it worth?High Performance Green Building: What is it worth?
High Performance Green Building: What is it worth?
 
C&W Ottawa October 2009 Listing Report
C&W Ottawa October 2009 Listing ReportC&W Ottawa October 2009 Listing Report
C&W Ottawa October 2009 Listing Report
 

Q2 2010 Ottawa Office Marketbeat Report

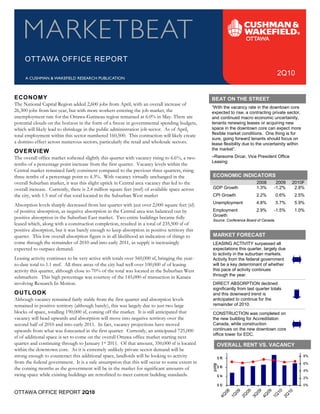
  • 1. OTTAWA OFFICE REPORT 2Q10 ECONOMY BEAT ON THE STREET The National Capital Region added 2,600 jobs from April, with an overall increase of “With the vacancy rate in the downtown core 26,300 jobs from last year, but with more workers entering the job market, the expected to rise, a contracting private sector, unemployment rate for the Ottawa-Gatineau region remained at 6.0% in May. There are and continued macro economic uncertainity, tenants renewing leases or acquiring new space in the downtown core can expect more potential clouds on the horizon in the form of a freeze in governmental spending budgets, flexible market conditions. One thing is for which will likely lead to shrinkage in the public administration job sector. As of April, sure, going forward tenants should focus on total employment within this sector numbered 160,500. This contraction will likely create a domino effect across numerous sectors, particularly the retail and wholesale sectors. lease flexibility due to the uncertainity within the market”. OVERVIEW –Ransome Drcar, Vice President Office Leasing The overall office market softened slightly this quarter with vacancy rising to 6.6%, a two- tenths of a percentage point increase from the first quarter. Vacancy levels within the ECONOMIC INDICATORS Central market remained fairly consistent compared to the previous three quarters, rising 2008 2009 2010F three-tenths of a percentage point to 4.3%. With vacancy virtually unchanged in the GDP Growth 1.3% -1.2% 2.8% overall Suburban market, it was this slight uptick in Central area vacancy that led to the CPI Growth 2.2% 0.6% 2.5% overall increase. Currently, there is 2.4 million square feet (msf) of available space across the city, with 1.5 msf of that total located in the Suburban West market Unemployment 4.8% 5.7% 5.9% Employment 2.9% -1.5% 1.0% Absorption levels sharply decreased from last quarter with just over 2,000 square feet (sf) Growth of positive absorption, as negative absorption in the Central area was balanced out by Source: Conference Board of Canada positive absorption in the Suburban East market. Two entire buildings became fully leased which, along with a construction completion, resulted in a total of 235,500 sf of MARKET FORECAST positive absorption, but it was barely enough to keep absorption in positive territory this quarter. This low overall absorption figure is in all likelihood an indication of things to come through the remainder of 2010 and into early 2011, as supply is increasingly LEASING ACTIVITY surpassed all expectations this quarter, largely due to activity in the suburban markets. expected to outpace demand. Leasing activity continues to be very active with totals over 560,000 sf, bringing the year- Activity from the federal government will be a key determinant of whether this pace of activity continues to-date total to 1.1 msf. All three areas of the city had well over 100,000 sf of leasing through the year. activity this quarter, although close to 70% of the total was located in the Suburban West submarkets. This high percentage was courtesy of the 145,000-sf transaction in Kanata DIRECT ABSORPTION declined significantly from last quarter totals involving Research In Motion. OUTLOOK and this downward trend is anticipated to continue for the remainder of 2010. Although vacancy remained fairly stable from the first quarter and absorption levels remained in positive territory (although barely), this was largely due to just two large blocks of space, totalling 190,000 sf, coming off the market. It is still anticipated that CONSTRUCTION was completed on the new building for Accreditation Canada, while construction vacancy will head upwards and absorption will move into negative territory over the continues on the new downtown core second half of 2010 and into early 2011. In fact, vacancy projections have moved office tower for EDC. upwards from what was forecasted in the first quarter. Currently, an anticipated 725,000 sf of additional space is set to come on the overall Ottawa office market starting next quarter and continuing through to January 1st 2011. Of that amount, 350,000 sf is located OVERALL RENT VS. VACANCY Rent Vacancy within the downtown core. As it is extremely unlikely private sector demand will be $ 20 10% 8% $18 strong enough to counteract this additional space, landlords will be looking to activity 6% $16 from the federal government. It is a safe assumption that this will occur to some extent in 4% the coming months as the government will be in the market for significant amounts of $14 2% swing space while existing buildings are retrofitted to meet current building standards. $12 0% OTTAWA OFFICE REPORT 2Q10 08 09 09 09 09 10 10 1 4Q 1Q 2Q 3Q 4Q 1Q 2Q
  • 2. OTTAWA OFFICE REPORT 2Q10 Central Area Overall Rental vs. Vacancy Rate Overall Vacancy Rate Non-Core vs. Core Rental R ate Vacancy Rate Core Non-Core $23.00 5.0% 10.0% 4.0% 8.0% $22.00 3.0% 6.0% p sf/yr $21.00 2.0% 4.0% $20.00 1.0% 2.0% $19.00 0.0% 0.0% 1Q09 2Q09 3Q09 4Q09 1Q10 2Q10 1Q09 2Q09 3Q09 4Q09 1Q10 2Q10  Asking rental rates remained virtually unchanged from last quarter,  Vacancy in the non-core declined for the second straight quarter to with the average rate sitting at $20.99 per square foot (psf) with reach 4.6%, its lowest level in a year. This decline in vacancy can be rents in all three classes of space ticking upwards slightly. attributed to a significant decline in vacancy in the Byward Market, Downtown core class A rents were almost identical to last quarter where vacancy fell by five-tenths of a percentage point to 5.8%. In at $25.67 psf. Looking ahead, class A asking rents may experience this submarket, an entire building totaling 45,000 sf was leased by a slight softening due to a more competitive downtown core two tenants. market.  After remaining at 3.7% for two consecutive quarters, downtown  Overall vacancy in the Central area edged up slightly in the second core vacancy rose in the second quarter to 4.3%, with all classes of quarter to reach 4.3%, three-tenths of a percentage point higher space recording increases. Putting the possible federal government than last quarter. Vacancy is anticipated to continue to rise leasing requirements aside, vacancy in the downtown core could through the remainder of 2010. potentially rise to 6.1% by the first quarter of 2011. Leasing Activity Non-Core vs. Core Absorption Non-Core vs. Core Core Non-Core Core Non-Core 200 300 150 225 100 sf (' 000) sf (' 000) 150 50 0 75 -50 0 -100 1Q09 2Q09 3Q09 4Q09 1Q10 2Q10 1Q09 2Q09 3Q09 4Q09 1Q10 2Q10  Leasing activity in the non-core increased for the fourth  Absorption in the non-core continued to improve this quarter, with consecutive quarter, reaching close to 67,000 sf. The vast majority approximately 45,000 sf of positive absorption. In a reversal from of leasing activity was located within the Byward Market where an the previous quarter, negative absorption in the Centretown market entire building totaling 45,000 sf was leased by Open Text and the was offset by positive absorption in the Byward Market. This Federation of Canadian Municipalities. positive absorption was courtesy of the previously mentioned  Leasing activity in the downtown core slowed from last quarter’s 45,000-sf transaction. levels to 118,000 sf. Leasing activity continues to be focused  For the first time in a year, absorption within the downtown core within the class A segment, which contributed approximately 60% dipped into negative territory at close to 87,000 sf. Although all of the total for the downtown core. Once again, 180 Kent three classes within the downtown core registered negative continues to be the most active property in the class A segment, absorption, the majority was located in the class A and B segments. with approximately 33,000 sf leased this quarter. This 370,000-sf While numerous buildings in the class B segments posted negative building is expected to be fully leased by the end of the year. absorption, there were only three class A properties where this occurred. This space was located in pockets over 10,000 sf. 2
  • 3. OTTAWA OFFICE REPORT 2Q10 Suburban Area Overall Rental vs. Vacancy Rate Overall Vacancy Rate West vs. East Rental Rate Vacanc y Rate West East $16.00 12.0% 14.0% 12.0% 10.0% $14.00 10.0% 8.0% psf/yr 8.0% 6.0% $12.00 6.0% 4.0% 2.0% $10.00 4.0% 0.0% 1Q09 2Q09 3Q09 4Q09 1Q10 2Q10 1Q09 2Q09 3Q09 4Q09 1Q10 2Q10  Vacancy in the overall Suburban market stabilized this quarter at  After three consecutive quarters of declining vacancy in the overall 8.6%, just one-tenth of a percentage point increase from last Suburban West market vacancy was unchanged this quarter, quarter. remaining at 10.7%. With increasing vacancy in the Nepean and  The overall asking average rental rate for the Suburban market Ottawa West submarkets, it was declining vacancy in Kanata that contracted once again this quarter to $13.29 psf. Rental rates were lead to the vacancy remaining unchanged. Vacancy in Kanata now on the decline in the Suburban West market and now sit at $13.11 stands at 12.9%, down from 15% last quarter. psf, with lower rents reported in the class A and B segments. The  There was minimal change in vacancy in the overall Suburban East opposite was true in the Suburban East market, where overall market this quarter, increasing by three-tenths of a percentage point rental rates increased to $14.37 psf, with an increase in the class A to 2.9%. There was an increase in vacancy in the Ottawa East segment. submarket as the space vacated by Accreditation Canada officially became available. Leasing Activity West vs. East Absorption West vs. East W est East W est East 500 300 200 350 sf ('00 0) sf ('00 0) 100 0 200 -100 50 -200 1Q09 2Q09 3Q09 4Q09 1Q10 2Q10 1Q09 2Q09 3Q09 4Q09 1Q10 2Q10  Leasing activity in the western submarkets slowed this quarter, with  Absorption in the Suburban West market was almost nil this quarter a total of approximately 263,000 sf. Kanata by far was the most at just under 3,000 sf. Negative absorption in the Ottawa West and active, with close to 213,000 sf. Close to 70% of that total was Nepean submarkets was cancelled out by the positive absorption in located in one transaction alone; the leasing of Dell’s former Kanata of 106,000 sf, with the entire amount attributable to the 145,000-sf call centre by Research In Motion. previously mentioned Research In Motion transaction.  Leasing activity dramatically increased in the overall Suburban East  Absorption in the eastern submarkets improved from last quarter’s market this quarter to close to 115,000 sf. The majority, amount and headed back into positive territory with close to 41,000 approximately 90,000 sf, was located in the Ottawa East sub- sf. This absorption level was the result of the new 60,000-sf market where an 80,000 sf property was leased by JPMorgan building completion in the Gloucester submarket for Accreditation Chase. Canada. 3
  • 4. OTTAWA OFFICE REPORT 2Q10 MARKET/SUBMARKET STATISTICS Overall Direct YTD YTD YTD Direct Wtd. Avg. No. of Vacancy Vacancy Leasing Under Construction Overall Class A Gross Market/Submarket Inventory Bldgs. Rate Rate Activity Construction Completions Absorption Rental Rate* Downtown Core 14,715,998 82 4.3% 3.1% 256,390 475,000 0 (86,214) $48.36 Centretown 1,769,448 34 3.7% 3.4% 36,640 0 0 6,226 N/A Byward Market 914,861 13 5.8% 4.9% 80,122 0 0 46,623 $36.22 Kanata 4,990,246 62 12.9% 9.4% 393,122 0 0 239,022 $22.63 Ottawa West 3,777,207 58 12.5% 10.9% 119,773 0 0 (3,648) $33.12 Nepean 5,455,838 83 7.4% 5.1% 76,811 0 0 (43,071) $27.23 Ottawa East 3,790,796 53 3.4% 3.2% 120,443 0 0 (30,572) $27.26 Gloucester 1,397,799 14 1.8% 1.8% 25,209 0 60,000 68,974 $33.56 Total 36,812,193 399 6.6% 5.1% 1,108,510 475,000 60,000 197,340 $38.74 * Rental rates reflect psf/year MARKET HIGHLIGHTS SIGNIFICANT 2Q10 NEW LEASE TRANSACTIONS BUILDING SUBMARKET TENANT SQ FT BLDG CLASS 1001 Farrar Road Kanata Research In Motion 146,515 A 2220 Walkley Road Ottawa East JPMorgan Chase Bank 80,606 B 10 Rideau Street Byward Market Open Text 32,500 A SIGNIFICANT 2Q10 SALE TRANSACTIONS BUILDING SUBMARKET BUYER SQ FT PURCHASE PRICE 363 Coventry Road Ottawa East Osgoode Properties 33,500 $6,850,000 283 Dalhousie Street Byward Market 2232449 Ontario Inc. 11,000 $3,186,000 SIGNIFICANT 2Q10 CONSTRUCTION COMPLETIONS BUILDING SUBMARKET MAJOR TENANT SQ FT COMPLETION DATE 1150 Cyrville Road Gloucester Accreditation Canada 60,000 04/10 SIGNIFICANT PROJECTS UNDER CONSTRUCTION BUILDING SUBMARKET MAJOR TENANT SQ FT COMPLETION DATE 150 Slater Street Downtown Core EDC 475,000 09/11 For industry-leading intelligence to support your real estate and This report contains information available to the public and has been relied upon by Cushman & Wakefield Ottawa on the basis that it is accurate and complete. Cushman & business decisions, go to Cushman & Wakefield’s Knowledge Wakefield Ottawa accepts no responsibility if this should prove not to be the case. No Center at www.cushmanwakefield.com/knowledge warranty or representation, express or implied, is made to the accuracy or completeness of the information contained herein, and same is submitted subject to errors, omissions, Cushman & Wakefield Ottawa change of price, rental or other conditions, withdrawal without notice, and to any special 99 Bank Street Suite 700 listing conditions imposed by our principals. Ottawa, ON K1P 6B9 ©2010 Cushman & Wakefield Ottawa. All rights reserved. (613) 236-7777