Project delivery methods and performance analysis
•
6 likes•5,800 views

This study analyzes 40 construction projects to compare the effectiveness of the traditional design-bid-build (D/B/B) project delivery method and the alternative design-build (D/B) method. The study finds that D/B provided timesaving benefits but the positive effects on cost changes were not conclusive. Statistical analysis showed that D/B/B projects experienced around 6.75% change in cost on average, while D/B projects saw around 11.66% change in cost on average. However, the impact of a contractor's project management expertise and experience may have a greater influence on project performance than the choice of delivery method alone.

Recommended
More Related Content
What's hot
What's hot (20)
Viewers also liked
Viewers also liked (16)
Similar to Project delivery methods and performance analysis
Similar to Project delivery methods and performance analysis (20)
Project delivery methods and performance analysis
- 1. PROJECT PERFORMANCE ANALYSIS AND DELIVERY METHODS - QUANTITATIVE ANALYSIS Jin-Lee Kim1 M. ASCE and Seta Ohanesian2 ABSTRACT Various project delivery methods have been utilized by owners over the years to maximize project performance. The design-build delivery method is being increasingly used due to the advantages it can offer to an engineering construction industry. Numerous studies have advocated the use of design/build over the traditional design/bid/build delivery approach. This study represents comprehensive analysis of 40 projects from the construction industry shows that design/build method may not provide all the benefits to project performance. This study found timesaving was a definitive advantage of design/build project delivery, but the positive effects of cost changes was not convincing. Based on the results of the study, the project management expertise and experience of the contractor may have a greater impact on project performance outcomes than focusing on project delivery strategy only. KEY WORDS Construction projects, performance measures, cost performance, schedule performance, contract type, project delivery methods, Design/Bid/Build, Design-Build, change orders, project cost and schedule. INTRODUCTION The construction industry is one of the largest industries in North America and worldwide (Robert McKim 2000). Measuring the performance of any project in terms of success or failure is a complex process. Notably, due to the increase of project complexity, modern construction projects are often failed to achieve a total success in terms of project performance (Hemanta Doloi and Ming Lim 2007). Delays in completion and over spending are common problems besetting the project delivery process. The construction industry has been searching for effective project delivery methods to maximize project performance over the past decades. There is the traditional project delivery strategy, design/ bid/build (D/B/B), and alternative delivery methods such as design/build (D/B). Currently, no single project delivery system is most appropriate for 1 Assistant Professor, Department of Civil Engineering and Construction Engineering Management, California State University, 1250 Bellflower Blvd., Long Beach, CA 90840, Phone: (562) 985-1679, Fax: (562) 985-2380, Email: jinlee.kim@csulb.edu 2 Graduate Assistant, Department of Civil Engineering and Construction Engineering Management, California State University, 1250 Bellflower Blvd., Long Beach, CA 90840, Phone: (562) 985-1679, Fax: (562) 985-2380, Email: seta.ohanesian@gmail.com
- 2. any kind of project. Instead, combinations of different strategies are used for different circumstances (Gordon 1994). The purpose of this study is to compare the effectiveness of an alternative project delivery method (D/B) with the traditional method (D/B/B). This paper quantitatively examines the relationship between impacts on project performance and change by applying different project delivery approaches. Performance data (cost and schedule) are used to compare the average amounts of change for two different project delivery strategies. Data are collected using a questionnaire survey followed by structured interviews with project participants to elicit success-related factors and to identify critical factors affecting project performance. Statistical tests are calculated to analyze the data to determine whether the delivery method decision significantly impacted the project performance as represented by cost and time. All projects in this study are located in the United States, with total installed cost varying from $160K to $16 M. LITERATURE REVIEW Literature reviews have shown that a successful project can be defined as a project that has been completed on schedule and within budget. Effective management has proven to be essential in controlling costs and adhering to schedules for most types of projects (PMBoK 2004). Although there are a significant number of studies in the construction industry in the past, construction project performance is yet to achieve its maturity in terms of management of core knowledge areas defined in PMBoK (2004). Several research studies are available that looked into the factors that influence performance of a project. Different scholars have defined several factors proven to make major impact on cost and schedule of the global project. Also, several studies show that project characteristics such as delivery method, contract language and project complexity are major factors that affect performance of a construction project. William Ibbs and Young Hoon (2003) compared the traditional D/B/B and the D/B project delivery methods. They examined the relationship between impacts on project change by applying those two project delivery approaches while using cost, schedule and productivity as performance data. It was found that D/B did not perform much better than D/B/B in terms of cost and productivity. Konchar and Sanvido (1998) analyzed the relationship between schedule-cost changes and the type of implemented project delivery system. It was found that D/B/B was 11.4% more likely to suffer changes in schedule than D/B during the design and construction process. The changes in schedule and cost for each of the two project delivery methods were separated into the design phase and construction phase to better understand where the delays and changes occurred. Thomas (2000) studied the changes in cost in relative terms (increase or decrease in time and cost), due to the fact that positive (increase) or negative (decrease) changes can both be good or bad for a project under different circumstances. Molenaar et al. (1999) studied the impact of D/B project delivery method on the performance of public projects. performance of several D/B projects was evaluated based on owner’s experience with D/B projects, selection of D/B contractor, contract type, award method, and form of D/B contract (one-step, two-steps, qualifications based). 2
- 3. Performance criteria were defined by budget performance, schedule performance, administrative burden, and owner satisfaction. Baccarini (1999) suggested a successful project can be defined in two distinct components namely the “two concepts”: project management success and product success. The first concept focuses upon the project success in particular the successful accomplishment of the project time, cost and quality, which can be measured in terms of meeting the project schedule, budget, and conformance to functional and technical specifications respectively. The later concept deals with the effects of the project final product that has three key components; to satisfy the project goal, project purpose and project stakeholders. Project characteristics and their impact on project success, however, were not analyzed. Issac and Navon (2008) have proposed a change control tool which creates requirement traceability through links between client requirements and the building design. They believe that number of changes or the impact of changes can be controlled by capturing client requirements accurately at the beginning of the project and through the requirement traceability that is build up afterwards. This study didn’t consider many factors that impact the project in terms of project characteristics. Also, they put a major emphasis on the planning phase of a project by well studying the client requirements and ignoring all other factors that could have a major impact on controlling a change. Hao, Q.; Shen, W.; Neelamkavil, J.; Thomas, R. (2008) showed that a change is a common denominator in all construction projects. This research identified changes as the major cause of project delay, cost overruns, defects and project failure. Change management can’t rely on software tools available on the market since they lack many solutions (e.g. change estimation, impact analysis, post-change analysis, statistics, and change traceability. This research proposed a generic change process model that has five stages in a sequence: identify, evaluate & propose, approve, implement and review. An integrated change management system requires technical supports from different technologies, including collaborative workflow, system integration and collaboration technologies, web-based collaborative project management tools, and online document management tools. This research didn’t take a project delivery method into consideration. The primary objective of this research is to enhance the current construction industry by achieving a better understanding on modern construction project management and minimize the risk of project failure by quantitatively investigating the correlation between the selection of project delivery method and the performance of the project. This paper examines the relationship between impacts on project performance and project changes by applying different project delivery approaches. The study considers the impact of the traditional delivery method, Design/Bid/Build (D/B/B), and alternative delivery method, Design/Build (D/B) on the project performance and potential change orders generated on these projects. Cost and schedule are used as the main project performance indicators. RESEARCH METHODOLOGY We collected performance data using a questionnaire survey from 40 construction projects. The survey data collection method was selected because it possesses numerous advantages. Several questions can be asked regarding the topic of the study 3
- 4. simultaneously, which adds flexibility to the analysis. The majority of the projects targeted in the research are located in different states. This condition favors the use of the survey collection method because it is relatively inexpensive and easier to administer. As part of the questionnaire, participants were asked to fill out basic information about the project. This includes project delivery methods and information about the amount of changes that occurred and how the schedule changed during the projects. The survey is followed by structured interviews with project participants to elicit success-related factors. Using the collected data, performance comparison is conducted between these construction projects along with their project delivery methods. Two performance measures are analyzed; cost and schedule in relation with change orders occurred in in each project. To analyze and compare between the performances of these construction projects, quantifiable measures of the cost and schedule performances are established. Several metrics were used to measure the project performance. T-test statistical analysis were used to determine the effect of the selected delivery method on the previously defined performance metrics. PROJECT DELIVERY METHODS AND CONTRACT TYPES DATA CLASSIFICATION The questionnaire survey identified two types of delivery methods: D/B/B and D/B. The same applied to the contract form, which included the lump sum format and a cost plus fixed fee. DESIGN / BID / BUILD The D/B/B approach is the most accepted traditional project delivery method today, especially for public projects in the United States. In D/B/B, the project is separated into a design phase and construction phase. With two well-defined phases, construction will start once the design is completed, while the drawings become the basis for the bidding documents. Because the owner is more certain about the finished product, usually a Fixed Firm Price contract is implemented in a D/B/B project DESIGN / BUILD Design/build is the oldest approach that is regarded as a new and alternative delivery method. During ancient times in Mesopotamia and Egypt, the master builder was responsible for the design and construction of the entire project. The owner contracts with a single venture that is responsible for both design and construction. One of the benefits of this approach is that the contractor’s experience and knowledge is applied from inception, thus enhancing efficiency.The contractor usually has the task of assembling a group of designers and constructors to perform the job for this type of delivery. CONTRACT FORMS FIRM FIXED PRICE Such a contract provides for a price that is not subject to any adjustment due to the cost experience of the contractor during the performance of the contract. Use of such a contract places maximum risk on the contractor and provides the maximum profit 4
- 5. incentive for effective cost control and contract performance. Since the contractor has assumed all the risk, there is a minimum of administrative burden placed on the owner. An FFP contract is suitable when reasonably definite specifications are available, and fair and reasonable prices can be established from the outset by means of adequate competition, prior purchasing history, or reasonably accurate identification of uncertainties and their probable costs. COST PLUS FEE CONTRACT Is a contract where a contractor is paid for all of its allowed expenses to a set limit plus additional payment to allow for a profit. This contract is desirable to shift some risk of successful contract performance from the contractor to the buyer. It is most commonly used when the item purchased cannot be explicitly defined or in cases where there is not enough data to accurately estimate the final cost. DATA COLLECTION AND ANALYSIS DATA COLLECTION AND ANALYSIS The data used for the analyses presented in this paper were collected from 40 projects (20 projects for each delivery method) located in the United States. All these projects were 100% construction complete. Data were collected using a questionnaire survey for followed by structured interviews with project participants. The respondents were asked to provide the following details: Project name and description Project client Date started and completed Project delivery and contract types Project location Original contract value Contract value on actual completion (after project completion) Original contract duration Actual contract duration (after project completion) Number of change orders Total value of the change orders Number of prime and sub contractors in the project Other data available that might be important for this research GROUPING PROJECTS WITH SIMILAR PROJECT DELIVERY METHOD After collecting all necessary data for each project, projects were grouped together according to their delivery methods. As a result, two groups were generated and each 5
- 6. project fell under one of the following groups/categories: Design/Bid/Build or Design- Build delivery method. METRICS DEFINITION This section describes how each metric was defined and what type of information was used to determine the value of the cost and schedule. Change order A change order is work that is added to or deleted from the original scope of work of a contract, which alters the original contract amount or completion date. Many times, change is necessary for the success of a project. “Change, defined as any event that results in a modification of the original scope, execution time, or cost of work, happens on most projects due to the uniqueness of each project and the limited resources of time and money available for planning” (Hanna, Camlic, Peterson, and Nordheim, 2002). While change orders are necessary to address unforeseen conditions and other unavoidable or unanticipated occurrences, they tend negatively affect construction. Cost overrun Also known as a cost increase or budget overrun is an unexpected cost incurred in excess of a budgeted amount stipulated in a contract due to an under-estimation of the actual cost during budgeting. Schedule Overrun Occurs when a project’s time restriction is violated. In other words project doesn’t meet its expected deadline as some of tasks from its critical path have been delayed by the project team. Schedule overrun makes the project customer not satisfied by performance of the team, as the project has run out of its predefined timeframes, but the desired products haven’t been delivered to the customer yet. Schedule overrun may mean not only non-meeting of the final due date of a project, but also missing to match predefined project milestones while this project is still in process, which may underlie further delay if not rectified as appropriate. Cost performance The change in cost was defined as the difference between the cost at the completion of the project and the original budget. According to survey data, cost performance is measured by analyzing the actual project’s cost overrun at construction completion. At the overall project level, the total value of change orders is used as a reasonable indicator of the cost overrun. A cost performance factor (CPF) is developed to be used as a measure of the cost performance in the surveyed projects and as a benchmark for comparing the cost performance of each project. The CPF is calculated for the surveyed projects as follows: CPF(%) = [(final cost - original contract value) / original contract value] x 100% Based on the CPF calculations, the mean and standard deviation of the CPF values are calculated for each delivery method group. 6
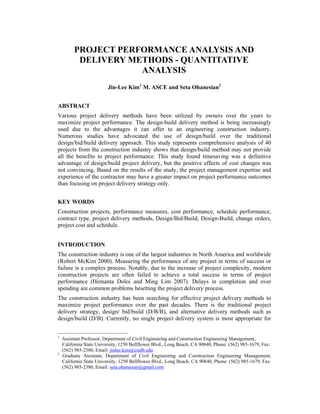
- 7. Schedule performance The change in schedule was defined as the difference between the time used to complete the whole project and the estimated time to complete the project. According to survey data, the schedule overrun and delay are used as a good indicator of a project’s schedule performance. A schedule performance factor (SPF) is created to measure the schedule performance and to establish a benchmark for comparison purposes. The SPF is calculated for the surveyed projects as follows: SPF(%) =[(total time used _ original contract duration) /original contract duration] x100% Based on the SPF calculations, the mean and standard deviation of the SPF values are calculated for each delivery methods group. DATA ANALYSIS Project delivery method The data used for the analyses presented in this study are collected from 40 projects; 50% of the total number of projects falls under Design/Bid/Build category and the remaining 50% falls under the Design/Build category. Also, 82% of these projects has a firm fixed price contract type and the remianing 18% has a cost plus fee contract type. Projects Sizes (Total Cost) Most projects were between $1 M and $10 M according to their total installed cost. Also, there is a couple of projects ranges between 10M to $15 M and a few others between $160 K to $1 M, as shown in Fig. 1. Figure 1: Frequency versus project size 7
- 8. Changes in cost versus project delivery The projects are classified into D/B and D/B/B. As shown in Fig. 2, the projects using D/B/B experienced about 6.75 % change in cost (cost reduction or increase), while only 11.66 % for projects using D/B experienced cost changes. Figure 2: Change In Cost versus Project Delivery (%) Figure 3: Change In Cost versus Project Delivery (US $) Since changes may be negative (if they increase the cost of the project) or positive (if they reduce the cost of the project), an analysis of how often this happened with each of the 8
- 11. D/B/B projects experienced about 15.64 % changes, while D/B projects only had 8.62% changes; this means that D/B projects performed better than D/B/B projects, as shown in Fig. 9. On the issue of saving time by applying the D/B approach, the data confirmed other studies and literatures (Molenaar et al. 1999). Figure 8: Change in Schedule versus Project Delivery (days) Figure 9: Change in Schedule versus Project Delivery (%) 11
- 12. Statistical analysis In order to further analyze the data, statistical analysis using t- test technique was performed to determine the t-score and p-value. The objective of using t-statistic was to further describe the nature of the relationship that may exist between delivery methods and project performance. This technique was used to make an inference on the mean of the population differences with the assumption that the distribution of differences is approximately normal. The point estimate of the mean is the mean of the sample difference. Fig. 10 shows the distribution of the data of equal samples as scattered diagram; which compares the average change order values ($ amount) between D/B/B and D/B approaches. Figure 10: Comparison of Average cost value per Change Order (D/B/B and D/B) Similarly, Fig. 11 shows the distribution of the average delay for change orders between D/B/B and D/B. In this case, three outliers were found (two for D/B/B and one for D/B). The definition of an “outlier” is an observation that "appears" to be inconsistent with other observations in the data set and is numerically distant from the rest of the data (Steven Walfish 2006). Grubbs (1969) defined an outlier as “An outlying observation, or outlier, is one that appears to deviate markedly from other members of the sample in which it occurs”. Outliers indicate that some data points are further away from the sample mean than what is deemed reasonable and that some observations are far from the center of the data. Outlier points can therefore indicate faulty data. Since including an erroneous value in the analyses will give invalid results, therefore outliers were removed. 12
- 13. Figure 11: Comparison of Average schedule delay per Change Order (D/B/B and D/B) After eliminating the outliers, descriptive statistics values for the project data; mainly for average cost value and schedule delay per change order, were calculated. These include the mean, median and standard deviation values. The hypotheses to test whether the average cost value per change order for D/B delivery method ( µDB) obtained from the data exceeds the average cost value per change order for D/B/B (µDBB) are Ho: µDB _ µDBB = 0 and Ha: µDB _ µDBB > 0. In order to identify which delivery method is performing better for each performance metric, normality for each of the performance metrics at a confidence level of 95% was checked (this means the significance level is 5% or 0.05). This value of confidence interval was chosen because it represents the interval where 95% of the sample estimates lie and is commonly used through statistical data testing (Ott 1992). Table 1 tabulates the statistical results for the average values between the two delivery approaches. Table 1: Statistical analysis for cost changes between D/B/B and D/B Cost D/B/B D/B Sample (n) 20 20 Mean $11,533.19 $35,872.11 Std Devtn $15,990.80 $50,516 t‐value 2.05 p‐value 0.02 The average cost values for change orders in D/B/B and D/B were found as $11,533.19 and $35,872.11. For the test analysis of the average cost value, we reject the null hypothesis because the observed significance level of p-value of 0.02 is less than the 13
- 14. significance level (0.05). Therefore, we have sufficient evidence to conclude that the mean difference is greater than > 0 or the mean values for average cost per change order for D/B exceeds the values for average cost per change order for D/B/B. In other words, and according to the data analysis, D/B/B resulted in higher cost saving than D/B method. Respectively, the hypotheses to test whether the average schedule delay per change order for D/B delivery method ( µDB) exceeds the average schedule delay per change order for D/B/B (µDBB) are Ho: µDB _ µDBB = 0 and Ha: µDB _ µDBB < 0. Normality for each of the performance metrics at a confidence level of 95% (significance level of 5% or 0.05) was checked in order to identify which delivery method is performing better in terms of schedule. Table 2, tabulates the statistical results for the average values of schedule delay between the two delivery approaches. Table 2: Statistical analysis for schedule changes between D/B/B and D/B Schedule D/B/B D/B Sample (n) 18 20 Mean 4.56 1.90 Std Devtn 5.76 3.17 t‐value ‐1.37 p‐value 0.048 The average schedule delay for change orders in D/B/B and D/B were found as 4.56 (days) and 1.90 (days). For the test analysis of the average schedule delay, we reject the null hypothesis because the observed significance level of p-value of 0.048 is less than the significance level (0.05). Therefore, we have sufficient evidence to conclude that the mean difference is less than < 0 or the mean values for average schedule delay per change order for D/B/B exceed the values for average schedule delay per change order for D/B. In other words, D/B experienced less schedule delay and performed better than D/B/B in terms of keeping the project within the original schedule limit. Practical applications and commonm reasons for cost and schedule overrun The D/B project delivery method has gained a lot of interest in recent years. Construction magazines and various reports presented D/B as the most appropriate choice to bring a project to completion on time and on schedule (Capps 1997). Another study showed that D/B may not provide all the benefits to project performance, the study found timesaving was a definitive advantage of D/B project delivery, but the positive effects of budget and the benefit of cost saving and productivity changes were not convincing (C. William Ibbs & Young Hoon Kwak 2003). Other papers have focused on developing guidelines for contractors and owners to avoid misuse of the D/B method (Tarricone 1996). Also another study showed that a combination of strategies could work more effectively than D/B or D/B/B alone (Pocock and Liu 1996). Also, another study pointed out, the design- build method may not provide the owner with a true advocate during either the design or construction phases. Additionally, it has been noted that the design-build approach does not necessarily reap the benefits of collaboration where the design-build entity utilizes a 14
- 15. more traditional command and control approach with the key trades (A viable project Delivery Method; Robert Tanner and Larry Leiby) In this study, and during the interview, the participants were asked about reasons for cost and schedule overrun; responses indicated that undefined scope was the major factor contributed to cost overrun for D/B projects. On the other hand, the respondents’ answers related to the reasons for cost and schedule overrun in D/B/B indicated that unforeseen site condition, procurement problem and scope changes by owner were the most cited factors contributing to cost and schedule overrun in D/B/B projects. Although, results in this study showed that most construction projects that used D/B/B had a higher number of change orders during construction, their real value ($$ amount) of change was lower than for D/B projects. CONCLUSION This paper presents a case in which D/B did not perform much better than D/B/B. While timesaving is a definitive benefit for using D/B as a project delivery strategy, the benefits in cost savings are debatable. Cost changes were more toward the (increase) side for D/B, while they tended to decrease for D/B/B projects. The data analysis revealed that no procurement method outperforms the other methods with regards to the performance metrics analyzed. Meanwhile, several trends that were identified indicated that different procurement methods are recommended to meet different performance requirements. Both project delivery methods may work well because the outcomes depend on the expertise and experience of those administrating the project in design and construction. Also, the owner needs to be educated and informed about conveying ideas to the contractor in preparing the design specifications to ensure success when adopting the D/B approach. There are many issues that a client or contractor may want to address before selecting one or various appropriate delivery methods according to the projects’ needs. Owners can first identify their critical project requirements, consider the resulting trends for the performance metrics, and select the delivery approach accordingly. This paper and its analyses may be used as a source of information with which stakeholders may observe the sensitivity of the budget and schedule of a project to changes under a D/B or D/B/B project delivery method. ACKNOWLEDGMENTS We would like to thank in advance all participants who have responded to our request, met with us and shared their experiences. REFERENCES Baccarini, D. (1999). “The logical framework method for defining project Success.” Project Management Journal, vol. 30, no. 4, pp. 25-32. 15
- 16. Capps, R. (1997). “Managing mega projects.” Construction Business Revision, 6 (6), 56– 59. Gordon, C. M. (1994) ‘‘Choosing appropriate construction contracting method.’’ J. Constr. Eng. Manage., 120 (1), 196–210. Grubbs, F. E.: 1969, “Procedures for detecting outlying observations in samples. Technometrics.” 11, 1–21. Hanna, A. S., Camlic, R., Peterson, P. A., & Nordheim, E. V. (2002). “Quantitative definition of projects impacted by change orders.” Journal of Construction Engineering & Management, 128(1), 57. Hao, Q.; Shen, W.; Neelamkavil, J.; Thomas, R. (2008). “Change management in construction projects”. NRC-CNRC Institute for Research in Construction; National Research Council Canada. Published in Une version de ce document se trouve dans: Proceedings of the CIB W78 25th International Conference on Information Technology: Improving the Management of Construction Projects Through IT Adopation, Santiago, Chile, pp. 387-396. Hemanta Doloi and Ming Y Lim (2007). “Measuring Performance in Construction.” RICS, Georgia Tech and the contributors, The construction and building research conference of the Royal Institution of Chartered Surveyors Georgia Tech, Atlanta. Isaac, S., Navon, R. (2008). “Feasibility study of an automated tool for identifying the implications of changes in construction projects.” Journal of Construction Engineering and Management, 134(2)139-145. Konchar, M., and Sanvido, V. (1998). ‘‘Comparison of U.S. projects delivery systems.” J. Constr. Eng. Manage., 124(6), 435–444. Larry R. Leiby and Robert S. Tanner. ” Integrated project delivery: a viable project delivery method?” Source Document, the author: was the first chairman of the Florida Bar Construction Law Committee in 1976. He is the author of the Florida Construction Law Manual. He is Board Certified in Construction Law and was on the Construction Law Certification Committee that creates and grades the tests for construction law board certification. He was awarded the lifetime achievement award by the Florida Bar Construction Law Committee and teaches construction law at the Florida International University College of Law. He can be reached at leiby@mkpalaw.com. www.mkpalaw.com. Molenaar, K. R., Songer, A. D., and Barash, M. (1999). “Public-sector design-build evolution and performance.” J. Manage. Eng., 15(2), 54–62. Ott, R. L. (1992). “An introduction to statistical methods and data analysis.“ Wadsworth Publishing Company, California. PMBOK (2004), “A guide to the project management body of knowledge (3rd ed.)”, Project Management Institute, Pennsylvania. Pocock, J., and Liu, L. (1996). ‘‘Alternative approaches to projects: Better or worse?’’ Mil. Eng., 88 (578), 57–59. Robert McKim, Tarek Hegazy and Mohamed Attalla (2000). “Project performance control in reconstruction projects.” Journal of Construction Engineering & Management. Steven Walfish (2006). “A Review of Statistical Outlier Methods” PharmTech; Author is the president of Statistical Outsourcing Services, www.statisticaloutsourcingservices.com 16
- 17. Tarricon, P. (1996). “Design-build it, and they will come.” Facil. Des. Manage., 15 (9), 60–63. Thomas, R. (2000). “Schedule acceleration, work flow, and labor productivity.” J. Constr. Eng. Manage., 126(4), 261–267. William Ibbs; Young Hoon Kwak; Tzeyu Ng; and Murat Odabas (2003). “Project delivery systems and project change: Quantitative analysis” Journal of Construction Engineering & Management © ASCE. 17