SlideShare a Scribd company logo
1 of 272
Download to read offline
EU Regional Social Progress Index 69.90 128/272
GDP PPP per capita (2011) €21,700 153/272
Basic Human Needs 85.93 37 Foundations of Wellbeing 63.38 147 Opportunity 61.64 144
Nutrition and Basic Medical Care 87.16 53
Mortality rate before age 65 0.12 102
Infant mortality 3.00 76
Unmet medical needs 0.42 11
Insufficient food 7.77 137
Water and Sanitation 98.19 29
Satisfaction with water quality* 8
Lack of toilet in dwelling 1.11 179
Uncollected sewage 0.00 1
Sewage treatment 97.09 65
Shelter 77.94 31
Burdensome cost of housing 15.26 27
Satisfaction with housing 50.22 85
Overcrowding 13.63 171
Lack of adequate heating 2.87 31
Personal Safety 81.11 122
Homicide rate 0.82 85
Safety at night* 22
Traffic deaths 79.36 211
Access to Basic Knowledge 69.47 164
Secondary enrolment rate 0.91 195
Lower secondary completion only 19.00 99
Early school leaving n/a n/a
Access to Information
and Communications
68.65 119
Internet at home 79.00 137
Broadband at home 78.00 112
Online interaction with public authorities 48.00 99
Health and Wellness 75.83 58
Life expectancy 80.90 140
General health status 69.16 112
Premature deaths from cancer 79.60 125
Premature deaths from heart disease 38.40 114
Unmet dental needs 1.47 20
Environmental Quality 42.47 164
Satisfaction with air quality* 33
Air pollution-pm10 24.56 198
Air pollution-pm2.5 18.35 210
Air pollution-ozone 124.29 206
Pollution, grime or other environmental
problems
10.76 103
Protected land (Natura 2000) 27.97 64
Personal Rights 58.26 31
Trust in the political system 58.90 34
Trust in the legal system 33.30 97
Trust in the police 77.26 32
Quality and accountability of government services 0.81 34
Personal Freedom and Choice 81.85 50
Freedom over life choices* 112
Teenage pregnancy 0.66 67
Young people not in education, employment
or training
n/a n/a
Corruption 0.98 47
Tolerance and Inclusion 66.71 177
Impartiality of government services 1.16 23
Tolerance for immigrants* 179
Tolerance for minorities* 194
Attitudes toward people with disabilities 6.90 221
Tolerance for homosexuals* 201
Gender gap -10.87 176
Community safety net* 154
Access to Advanced Education 42.98 234
Tertiary education attainment 14.83 249
Tertiary enrolment 0.01 268
Lifelong learning 10.13 108
Burgenland (AT)
Strengths and weaknesses are relative to 15 regions of similar GDP per capita: Franche-Comté; Malta; Namur; Derbyshire and Nottinghamshire; Border, Midland and Western; Brandenburg; East Yorkshire
and Northern Lincolnshire; Abruzzo; Lower Normandy; Kent; Poitou-Charentes; Languedoc-Roussillon; Canary Islands; Dorset and Somerset; Dresden
*Raw data cannot be shown for Gallup indicators
Score/value
Score/value Score/value Score/value
Rank
Rank Rank Rank
Underperforming OverperformingLess than one point under neutral Less than one point over neutralNeutral
Austria
EU Regional Social Progress Index 71.01 114/272
GDP PPP per capita (2011) €26,600 99/272
Basic Human Needs 85.47 47 Foundations of Wellbeing 64.90 111 Opportunity 63.66 129
Nutrition and Basic Medical Care 86.24 78
Mortality rate before age 65 0.12 102
Infant mortality 3.50 135
Unmet medical needs 0.42 11
Insufficient food 7.77 137
Water and Sanitation 96.90 68
Satisfaction with water quality* 119
Lack of toilet in dwelling 1.11 179
Uncollected sewage 0.00 1
Sewage treatment 99.09 33
Shelter 77.94 31
Burdensome cost of housing 15.26 27
Satisfaction with housing 50.22 85
Overcrowding 13.63 171
Lack of adequate heating 2.87 31
Personal Safety 81.40 118
Homicide rate 0.40 7
Safety at night* 35
Traffic deaths 85.93 224
Access to Basic Knowledge 74.69 123
Secondary enrolment rate 0.90 210
Lower secondary completion only 16.47 78
Early school leaving 6.70 34
Access to Information
and Communications
67.31 132
Internet at home 76.00 159
Broadband at home 74.00 145
Online interaction with public authorities 51.00 74
Health and Wellness 75.15 80
Life expectancy 80.70 153
General health status 69.16 112
Premature deaths from cancer 80.00 127
Premature deaths from heart disease 35.00 84
Unmet dental needs 1.47 20
Environmental Quality 45.00 139
Satisfaction with air quality* 95
Air pollution-pm10 22.62 172
Air pollution-pm2.5 17.09 188
Air pollution-ozone 122.87 206
Pollution, grime or other environmental
problems
10.76 103
Protected land (Natura 2000) 29.08 55
Personal Rights 58.26 31
Trust in the political system 58.90 34
Trust in the legal system 33.30 97
Trust in the police 77.26 32
Quality and accountability of government services 0.81 34
Personal Freedom and Choice 81.26 62
Freedom over life choices* 21
Teenage pregnancy 0.72 83
Young people not in education, employment
or training
7.07 44
Corruption 0.65 111
Tolerance and Inclusion 66.23 179
Impartiality of government services 1.20 18
Tolerance for immigrants* 192
Tolerance for minorities* 219
Attitudes toward people with disabilities 6.90 221
Tolerance for homosexuals* 194
Gender gap -9.60 111
Community safety net* 166
Access to Advanced Education 50.83 201
Tertiary education attainment 17.33 226
Tertiary enrolment 0.01 263
Lifelong learning 12.20 83
Niederösterreich
Strengths and weaknesses are relative to 15 regions of similar GDP per capita: Balearic Islands; North Middle Sweden; East Middle Sweden; Koblenz; Friesland; Western Finland; Marche; WeserEms;
Provence-Alpes-Côte d’Azur; Madeira; South Sweden; Eastern Scotland; Mazovia; Hampshire and Isle of Wight; Småland with Islands
*Raw data cannot be shown for Gallup indicators
Score/value
Score/value Score/value Score/value
Rank
Rank Rank Rank
Underperforming OverperformingLess than one point under neutral Less than one point over neutralNeutral
Austria
EU Regional Social Progress Index 73.11 64/272
GDP PPP per capita (2011) €41,300 11/272
Basic Human Needs 85.87 38 Foundations of Wellbeing 59.90 178 Opportunity 74.74 31
Nutrition and Basic Medical Care 82.03 177
Mortality rate before age 65 0.15 202
Infant mortality 4.80 224
Unmet medical needs 0.42 11
Insufficient food 7.77 137
Water and Sanitation 98.72 15
Satisfaction with water quality* 16
Lack of toilet in dwelling 1.11 179
Uncollected sewage 0.00 1
Sewage treatment 100.00 1
Shelter 77.94 31
Burdensome cost of housing 15.26 27
Satisfaction with housing 50.22 85
Overcrowding 13.63 171
Lack of adequate heating 2.87 31
Personal Safety 85.47 29
Homicide rate 1.01 126
Safety at night* 118
Traffic deaths 12.22 3
Access to Basic Knowledge 70.62 156
Secondary enrolment rate 0.90 210
Lower secondary completion only 18.00 91
Early school leaving 11.43 132
Access to Information
and Communications
75.98 42
Internet at home 83.00 101
Broadband at home 83.00 81
Online interaction with public authorities 61.00 35
Health and Wellness 70.95 170
Life expectancy 80.10 186
General health status 69.16 112
Premature deaths from cancer 89.20 185
Premature deaths from heart disease 45.40 156
Unmet dental needs 1.47 20
Environmental Quality 29.32 260
Satisfaction with air quality* 184
Air pollution-pm10 28.07 238
Air pollution-pm2.5 23.45 251
Air pollution-ozone 120.76 206
Pollution, grime or other environmental
problems
10.76 103
Protected land (Natura 2000) 13.35 172
Personal Rights 58.26 31
Trust in the political system 58.90 34
Trust in the legal system 33.30 97
Trust in the police 77.26 32
Quality and accountability of government services 0.81 34
Personal Freedom and Choice 74.45 106
Freedom over life choices* 39
Teenage pregnancy 1.47 191
Young people not in education, employment
or training
10.50 103
Corruption 0.10 153
Tolerance and Inclusion 72.10 143
Impartiality of government services 0.58 120
Tolerance for immigrants* 153
Tolerance for minorities* 152
Attitudes toward people with disabilities 6.90 221
Tolerance for homosexuals* 98
Gender gap -6.73 43
Community safety net* 193
Access to Advanced Education 96.61 10
Tertiary education attainment 28.23 119
Tertiary enrolment 0.11 1
Lifelong learning 18.03 1
Wien
Strengths and weaknesses are relative to 15 regions of similar GDP per capita: Upper Bavaria; North Eastern Scotland; Darmstadt; Stockholm; Prague; Utrecht; Helsinki; Bremen; Capital Region of Denmark;
Groningen; Île de France; North Holland; Bolzano; Bratislava Region; Salzburg
*Raw data cannot be shown for Gallup indicators
Score/value
Score/value Score/value Score/value
Rank
Rank Rank Rank
Underperforming OverperformingLess than one point under neutral Less than one point over neutralNeutral
Austria
EU Regional Social Progress Index 71.24 106/272
GDP PPP per capita (2011) €27,600 77/272
Basic Human Needs 86.31 33 Foundations of Wellbeing 63.58 144 Opportunity 64.91 116
Nutrition and Basic Medical Care 85.93 87
Mortality rate before age 65 0.13 139
Infant mortality 3.35 115
Unmet medical needs 0.42 11
Insufficient food 7.77 137
Water and Sanitation 99.09 3
Satisfaction with water quality* 4
Lack of toilet in dwelling 1.11 179
Uncollected sewage 0.00 1
Sewage treatment 99.86 22
Shelter 77.94 31
Burdensome cost of housing 15.26 27
Satisfaction with housing 50.22 85
Overcrowding 13.63 171
Lack of adequate heating 2.87 31
Personal Safety 82.99 88
Homicide rate 0.48 16
Safety at night* 36
Traffic deaths 71.34 195
Access to Basic Knowledge 77.38 107
Secondary enrolment rate 0.91 195
Lower secondary completion only 12.47 42
Early school leaving 7.35 46
Access to Information
and Communications
66.31 139
Internet at home 77.00 154
Broadband at home 75.00 142
Online interaction with public authorities 46.00 119
Health and Wellness 76.31 52
Life expectancy 81.30 102
General health status 69.16 112
Premature deaths from cancer 75.30 88
Premature deaths from heart disease 37.10 108
Unmet dental needs 1.47 20
Environmental Quality 38.69 207
Satisfaction with air quality* 85
Air pollution-pm10 18.60 98
Air pollution-pm2.5 14.54 134
Air pollution-ozone 124.22 206
Pollution, grime or other environmental
problems
10.76 103
Protected land (Natura 2000) 8.37 211
Personal Rights 58.26 31
Trust in the political system 58.90 34
Trust in the legal system 33.30 97
Trust in the police 77.26 32
Quality and accountability of government services 0.81 34
Personal Freedom and Choice 81.70 55
Freedom over life choices* 37
Teenage pregnancy 0.85 113
Young people not in education, employment
or training
7.33 53
Corruption 0.92 53
Tolerance and Inclusion 62.17 190
Impartiality of government services 0.88 69
Tolerance for immigrants* 237
Tolerance for minorities* 233
Attitudes toward people with disabilities 6.90 221
Tolerance for homosexuals* 202
Gender gap -10.17 134
Community safety net* 116
Access to Advanced Education 58.84 157
Tertiary education attainment 16.93 229
Tertiary enrolment 0.02 223
Lifelong learning 12.17 85
Kärnten
Strengths and weaknesses are relative to 15 regions of similar GDP per capita: Münster; Småland with Islands; Liguria; Giessen; Hampshire and Isle of Wight; East Flanders; Arnsberg; South Sweden; Rhône-
Alpes; WeserEms; Central Hungary; Friesland; East Middle Sweden; Gelderland; Northern Jutland
*Raw data cannot be shown for Gallup indicators
Score/value
Score/value Score/value Score/value
Rank
Rank Rank Rank
Underperforming OverperformingLess than one point under neutral Less than one point over neutralNeutral
Austria
EU Regional Social Progress Index 73.82 49/272
GDP PPP per capita (2011) €28,100 73/272
Basic Human Needs 87.01 27 Foundations of Wellbeing 64.87 112 Opportunity 70.45 65
Nutrition and Basic Medical Care 87.85 45
Mortality rate before age 65 0.12 102
Infant mortality 2.60 42
Unmet medical needs 0.42 11
Insufficient food 7.77 137
Water and Sanitation 98.32 26
Satisfaction with water quality* 45
Lack of toilet in dwelling 1.11 179
Uncollected sewage 0.00 1
Sewage treatment 99.35 31
Shelter 77.94 31
Burdensome cost of housing 15.26 27
Satisfaction with housing 50.22 85
Overcrowding 13.63 171
Lack of adequate heating 2.87 31
Personal Safety 84.54 54
Homicide rate 0.33 3
Safety at night* 37
Traffic deaths 62.32 144
Access to Basic Knowledge 76.43 116
Secondary enrolment rate 0.90 210
Lower secondary completion only 15.20 70
Early school leaving 5.13 15
Access to Information
and Communications
71.98 97
Internet at home 82.00 112
Broadband at home 81.00 97
Online interaction with public authorities 52.00 68
Health and Wellness 75.19 77
Life expectancy 81.45 92
General health status 69.16 112
Premature deaths from cancer 74.20 81
Premature deaths from heart disease 37.90 113
Unmet dental needs 1.47 20
Environmental Quality 39.94 193
Satisfaction with air quality* 164
Air pollution-pm10 21.79 156
Air pollution-pm2.5 16.15 174
Air pollution-ozone 124.65 206
Pollution, grime or other environmental
problems
10.76 103
Protected land (Natura 2000) 16.61 136
Personal Rights 58.26 31
Trust in the political system 58.90 34
Trust in the legal system 33.30 97
Trust in the police 77.26 32
Quality and accountability of government services 0.81 34
Personal Freedom and Choice 82.64 39
Freedom over life choices* 28
Teenage pregnancy 0.86 116
Young people not in education, employment
or training
5.90 26
Corruption 0.88 66
Tolerance and Inclusion 66.02 180
Impartiality of government services 1.26 12
Tolerance for immigrants* 200
Tolerance for minorities* 223
Attitudes toward people with disabilities 6.90 221
Tolerance for homosexuals* 190
Gender gap -10.30 140
Community safety net* 102
Access to Advanced Education 76.15 85
Tertiary education attainment 17.40 225
Tertiary enrolment 0.05 53
Lifelong learning 13.97 67
Steiermark
Strengths and weaknesses are relative to 15 regions of similar GDP per capita: Aragon; Piedmont; Northern Jutland; La Rioja; Gelderland; Lisbon; Central Hungary; Tuscany; Upper Franconia; Rhône-Alpes;
Surrey, East and West Sussex; Southern Denmark; Arnsberg; Berlin; East Flanders
*Raw data cannot be shown for Gallup indicators
Score/value
Score/value Score/value Score/value
Rank
Rank Rank Rank
Underperforming OverperformingLess than one point under neutral Less than one point over neutralNeutral
Austria
EU Regional Social Progress Index 72.12 86/272
GDP PPP per capita (2011) €32,500 35/272
Basic Human Needs 86.33 32 Foundations of Wellbeing 64.53 126 Opportunity 66.45 97
Nutrition and Basic Medical Care 87.76 47
Mortality rate before age 65 0.11 52
Infant mortality 2.95 71
Unmet medical needs 0.42 11
Insufficient food 7.77 137
Water and Sanitation 97.20 64
Satisfaction with water quality* 87
Lack of toilet in dwelling 1.11 179
Uncollected sewage 0.00 1
Sewage treatment 97.20 62
Shelter 77.94 31
Burdensome cost of housing 15.26 27
Satisfaction with housing 50.22 85
Overcrowding 13.63 171
Lack of adequate heating 2.87 31
Personal Safety 83.00 87
Homicide rate 0.59 34
Safety at night* 28
Traffic deaths 69.54 186
Access to Basic Knowledge 75.15 119
Secondary enrolment rate 0.92 177
Lower secondary completion only 19.17 102
Early school leaving 7.47 50
Access to Information
and Communications
72.98 80
Internet at home 83.00 101
Broadband at home 81.00 97
Online interaction with public authorities 54.00 60
Health and Wellness 77.11 37
Life expectancy 81.50 89
General health status 69.16 112
Premature deaths from cancer 72.50 70
Premature deaths from heart disease 36.40 102
Unmet dental needs 1.47 20
Environmental Quality 37.70 220
Satisfaction with air quality* 59
Air pollution-pm10 19.27 111
Air pollution-pm2.5 14.71 143
Air pollution-ozone 118.69 195
Pollution, grime or other environmental
problems
10.76 103
Protected land (Natura 2000) 6.27 226
Personal Rights 58.26 31
Trust in the political system 58.90 34
Trust in the legal system 33.30 97
Trust in the police 77.26 32
Quality and accountability of government services 0.81 34
Personal Freedom and Choice 81.48 59
Freedom over life choices* 36
Teenage pregnancy 0.74 89
Young people not in education, employment
or training
5.73 24
Corruption 0.54 128
Tolerance and Inclusion 67.27 174
Impartiality of government services 1.17 22
Tolerance for immigrants* 183
Tolerance for minorities* 197
Attitudes toward people with disabilities 6.90 221
Tolerance for homosexuals* 193
Gender gap -10.23 136
Community safety net* 115
Access to Advanced Education 60.02 151
Tertiary education attainment 17.10 227
Tertiary enrolment 0.02 223
Lifelong learning 12.77 76
Oberösterreich
Strengths and weaknesses are relative to 15 regions of similar GDP per capita: Flemish Brabant; Navarra; Cologne; Tübingen; Emilia–Romagna; Middle Franconia; South Holland; Madrid; Upper Palatinate;
Walloon Brabant; Trento; Zeeland; Cheshire; North Brabant; Basque Country
*Raw data cannot be shown for Gallup indicators
Score/value
Score/value Score/value Score/value
Rank
Rank Rank Rank
Underperforming OverperformingLess than one point under neutral Less than one point over neutralNeutral
Austria
EU Regional Social Progress Index 75.82 31/272
GDP PPP per capita (2011) €37,500 19/272
Basic Human Needs 86.56 29 Foundations of Wellbeing 70.93 21 Opportunity 70.51 64
Nutrition and Basic Medical Care 89.28 24
Mortality rate before age 65 0.11 52
Infant mortality 2.20 19
Unmet medical needs 0.42 11
Insufficient food 7.77 137
Water and Sanitation 97.65 47
Satisfaction with water quality* 14
Lack of toilet in dwelling 1.11 179
Uncollected sewage 0.00 1
Sewage treatment 95.35 79
Shelter 77.94 31
Burdensome cost of housing 15.26 27
Satisfaction with housing 50.22 85
Overcrowding 13.63 171
Lack of adequate heating 2.87 31
Personal Safety 82.00 107
Homicide rate 0.76 62
Safety at night* 15
Traffic deaths 79.92 213
Access to Basic Knowledge 91.38 12
Secondary enrolment rate 1.00 1
Lower secondary completion only 14.50 62
Early school leaving n/a n/a
Access to Information
and Communications
71.65 98
Internet at home 79.00 137
Broadband at home 78.00 112
Online interaction with public authorities 57.00 49
Health and Wellness 78.91 9
Life expectancy 82.00 58
General health status 69.16 112
Premature deaths from cancer 62.90 20
Premature deaths from heart disease 34.40 80
Unmet dental needs 1.47 20
Environmental Quality 45.98 129
Satisfaction with air quality* 45
Air pollution-pm10 16.39 47
Air pollution-pm2.5 13.11 96
Air pollution-ozone 116.03 167
Pollution, grime or other environmental
problems
10.76 103
Protected land (Natura 2000) 15.27 151
Personal Rights 58.26 31
Trust in the political system 58.90 34
Trust in the legal system 33.30 97
Trust in the police 77.26 32
Quality and accountability of government services 0.81 34
Personal Freedom and Choice 82.08 49
Freedom over life choices* 47
Teenage pregnancy 0.66 67
Young people not in education, employment
or training
5.90 26
Corruption 0.70 109
Tolerance and Inclusion 66.87 176
Impartiality of government services 1.21 17
Tolerance for immigrants* 195
Tolerance for minorities* 213
Attitudes toward people with disabilities 6.90 221
Tolerance for homosexuals* 189
Gender gap -10.03 124
Community safety net* 89
Access to Advanced Education 76.00 86
Tertiary education attainment 20.70 195
Tertiary enrolment 0.05 58
Lifelong learning 13.07 74
Salzburg
Strengths and weaknesses are relative to 15 regions of similar GDP per capita: Bolzano; North Holland; Berkshire, Buckinghamshire and Oxfordshire; Southern and Eastern; Stuttgart; Åland; Capital Region of
Denmark; Bremen; Helsinki; Utrecht; Antwerp; Vorarlberg; Darmstadt; Düsseldorf; Lombardy
*Raw data cannot be shown for Gallup indicators
Score/value
Score/value Score/value Score/value
Rank
Rank Rank Rank
Underperforming OverperformingLess than one point under neutral Less than one point over neutralNeutral
Austria
EU Regional Social Progress Index 75.13 33/272
GDP PPP per capita (2011) €33,400 29/272
Basic Human Needs 87.58 23 Foundations of Wellbeing 67.14 63 Opportunity 71.41 54
Nutrition and Basic Medical Care 89.08 27
Mortality rate before age 65 0.10 17
Infant mortality 2.65 44
Unmet medical needs 0.42 11
Insufficient food 7.77 137
Water and Sanitation 98.66 17
Satisfaction with water quality* 7
Lack of toilet in dwelling 1.11 179
Uncollected sewage 0.00 1
Sewage treatment 98.91 38
Shelter 77.94 31
Burdensome cost of housing 15.26 27
Satisfaction with housing 50.22 85
Overcrowding 13.63 171
Lack of adequate heating 2.87 31
Personal Safety 85.27 39
Homicide rate 0.33 3
Safety at night* 18
Traffic deaths 61.82 142
Access to Basic Knowledge 72.43 140
Secondary enrolment rate 0.91 195
Lower secondary completion only 19.77 110
Early school leaving 8.97 77
Access to Information
and Communications
72.31 87
Internet at home 84.00 97
Broadband at home 83.00 81
Online interaction with public authorities 49.00 95
Health and Wellness 77.00 40
Life expectancy 82.25 48
General health status 69.16 112
Premature deaths from cancer 67.40 36
Premature deaths from heart disease 30.90 42
Unmet dental needs 1.47 20
Environmental Quality 48.81 100
Satisfaction with air quality* 175
Air pollution-pm10 12.48 21
Air pollution-pm2.5 10.10 34
Air pollution-ozone 119.06 198
Pollution, grime or other environmental
problems
10.76 103
Protected land (Natura 2000) 14.62 158
Personal Rights 58.26 31
Trust in the political system 58.90 34
Trust in the legal system 33.30 97
Trust in the police 77.26 32
Quality and accountability of government services 0.81 34
Personal Freedom and Choice 81.76 53
Freedom over life choices* 58
Teenage pregnancy 0.68 74
Young people not in education, employment
or training
5.90 26
Corruption 0.70 109
Tolerance and Inclusion 68.10 170
Impartiality of government services 1.73 2
Tolerance for immigrants* 193
Tolerance for minorities* 192
Attitudes toward people with disabilities 6.90 221
Tolerance for homosexuals* 192
Gender gap -10.97 178
Community safety net* 28
Access to Advanced Education 78.78 70
Tertiary education attainment 19.13 205
Tertiary enrolment 0.05 33
Lifelong learning 12.67 77
Tirol
Strengths and weaknesses are relative to 15 regions of similar GDP per capita: Karlsruhe; Aosta Valley; Basque Country; North Brabant; Lombardy; Madrid; Düsseldorf; South Holland; Vorarlberg; Middle
Franconia; Cologne; Flemish Brabant; Upper Austria; Antwerp; Navarra
*Raw data cannot be shown for Gallup indicators
Score/value
Score/value Score/value Score/value
Rank
Rank Rank Rank
Underperforming OverperformingLess than one point under neutral Less than one point over neutralNeutral
Austria
EU Regional Social Progress Index 71.75 95/272
GDP PPP per capita (2011) €34,400 26/272
Basic Human Needs 87.05 25 Foundations of Wellbeing 65.01 110 Opportunity 64.28 126
Nutrition and Basic Medical Care 88.20 42
Mortality rate before age 65 0.10 17
Infant mortality 3.40 124
Unmet medical needs 0.42 11
Insufficient food 7.77 137
Water and Sanitation 98.47 20
Satisfaction with water quality* 22
Lack of toilet in dwelling 1.11 179
Uncollected sewage 0.00 1
Sewage treatment 99.39 30
Shelter 77.94 31
Burdensome cost of housing 15.26 27
Satisfaction with housing 50.22 85
Overcrowding 13.63 171
Lack of adequate heating 2.87 31
Personal Safety 84.24 59
Homicide rate 0.36 6
Safety at night* 49
Traffic deaths 56.66 129
Access to Basic Knowledge 67.30 178
Secondary enrolment rate 0.89 222
Lower secondary completion only 21.13 122
Early school leaving 11.40 129
Access to Information
and Communications
73.65 77
Internet at home 84.00 97
Broadband at home 83.00 81
Online interaction with public authorities 53.00 64
Health and Wellness 78.01 22
Life expectancy 82.35 38
General health status 69.16 112
Premature deaths from cancer 73.00 71
Premature deaths from heart disease 28.80 31
Unmet dental needs 1.47 20
Environmental Quality 44.01 152
Satisfaction with air quality* 114
Air pollution-pm10 14.05 24
Air pollution-pm2.5 10.63 39
Air pollution-ozone 121.83 206
Pollution, grime or other environmental
problems
10.76 103
Protected land (Natura 2000) 8.19 213
Personal Rights 58.26 31
Trust in the political system 58.90 34
Trust in the legal system 33.30 97
Trust in the police 77.26 32
Quality and accountability of government services 0.81 34
Personal Freedom and Choice 79.05 71
Freedom over life choices* 14
Teenage pregnancy 0.81 104
Young people not in education, employment
or training
7.37 55
Corruption 0.20 149
Tolerance and Inclusion 68.86 166
Impartiality of government services 1.08 32
Tolerance for immigrants* 111
Tolerance for minorities* 125
Attitudes toward people with disabilities 6.90 221
Tolerance for homosexuals* 195
Gender gap -13.23 209
Community safety net* 153
Access to Advanced Education 52.54 191
Tertiary education attainment 18.07 212
Tertiary enrolment 0.01 269
Lifelong learning 14.00 66
Vorarlberg
Strengths and weaknesses are relative to 15 regions of similar GDP per capita: Düsseldorf; Lombardy; Aosta Valley; Karlsruhe; Antwerp; Tyrol; Basque Country; North Brabant; Madrid; South Holland; Åland;
Middle Franconia; Cologne; Flemish Brabant; Upper Austria
*Raw data cannot be shown for Gallup indicators
Score/value
Score/value Score/value Score/value
Rank
Rank Rank Rank
Underperforming OverperformingLess than one point under neutral Less than one point over neutralNeutral
Austria
EU Regional Social Progress Index 66.85 153/272
GDP PPP per capita (2011) €55,600 3/272
Basic Human Needs 74.73 182 Foundations of Wellbeing 56.48 212 Opportunity 70.04 68
Nutrition and Basic Medical Care 80.47 197
Mortality rate before age 65 0.13 139
Infant mortality 3.10 91
Unmet medical needs 3.42 207
Insufficient food 12.54 209
Water and Sanitation 86.02 143
Satisfaction with water quality* 227
Lack of toilet in dwelling 3.03 221
Uncollected sewage 0.00 1
Sewage treatment 78.00 125
Shelter 65.05 169
Burdensome cost of housing 54.28 230
Satisfaction with housing 43.34 97
Overcrowding 8.37 155
Lack of adequate heating 16.39 230
Personal Safety 68.38 239
Homicide rate 3.35 259
Safety at night* 226
Traffic deaths 24.78 24
Access to Basic Knowledge 60.52 221
Secondary enrolment rate 0.92 177
Lower secondary completion only 32.27 202
Early school leaving 18.90 225
Access to Information
and Communications
68.76 118
Internet at home 78.00 150
Broadband at home 76.00 135
Online interaction with public authorities 52.00 68
Health and Wellness 66.63 204
Life expectancy 80.45 167
General health status 72.84 91
Premature deaths from cancer 86.10 167
Premature deaths from heart disease 39.40 119
Unmet dental needs 4.60 149
Environmental Quality 33.94 245
Satisfaction with air quality* 258
Air pollution-pm10 25.96 214
Air pollution-pm2.5 18.63 214
Air pollution-ozone 104.17 78
Pollution, grime or other environmental
problems
28.36 269
Protected land (Natura 2000) 14.10 167
Personal Rights 53.27 80
Trust in the political system 45.94 129
Trust in the legal system 37.36 78
Trust in the police 67.45 91
Quality and accountability of government services 0.74 43
Personal Freedom and Choice 70.90 144
Freedom over life choices* 102
Teenage pregnancy 1.19 162
Young people not in education, employment
or training
18.90 227
Corruption 0.75 102
Tolerance and Inclusion 70.42 154
Impartiality of government services -0.36 188
Tolerance for immigrants* 110
Tolerance for minorities* 154
Attitudes toward people with disabilities 7.60 128
Tolerance for homosexuals* 96
Gender gap -9.87 118
Community safety net* 199
Access to Advanced Education 87.70 35
Tertiary education attainment 42.20 1
Tertiary enrolment 0.09 1
Lifelong learning 9.60 119
Région de BruxellesCapitale / Brussels
Hoofdstedelijk Gewest
Strengths and weaknesses are relative to 15 regions of similar GDP per capita: Hamburg; Luxembourg; Bratislava Region; Île de France; Groningen; Prague; Stockholm; Vienna; Upper Bavaria; North Eastern
Scotland; Darmstadt; Utrecht; Helsinki; Bremen; Capital Region of Denmark
*Raw data cannot be shown for Gallup indicators
Score/value
Score/value Score/value Score/value
Rank
Rank Rank Rank
Underperforming OverperformingLess than one point under neutral Less than one point over neutralNeutral
Belgium
EU Regional Social Progress Index 72.06 88/272
GDP PPP per capita (2011) €34,800 24/272
Basic Human Needs 84.86 61 Foundations of Wellbeing 64.63 124 Opportunity 67.50 87
Nutrition and Basic Medical Care 87.00 60
Mortality rate before age 65 0.11 52
Infant mortality 4.25 200
Unmet medical needs 1.01 45
Insufficient food 2.55 30
Water and Sanitation 95.94 79
Satisfaction with water quality* 139
Lack of toilet in dwelling 0.86 163
Uncollected sewage 0.00 1
Sewage treatment 99.44 29
Shelter 80.20 23
Burdensome cost of housing 16.52 36
Satisfaction with housing 43.34 97
Overcrowding 1.48 4
Lack of adequate heating 3.82 44
Personal Safety 76.89 165
Homicide rate 2.00 239
Safety at night* 106
Traffic deaths 53.72 113
Access to Basic Knowledge 72.19 142
Secondary enrolment rate 0.94 140
Lower secondary completion only 26.20 170
Early school leaving 10.23 107
Access to Information
and Communications
74.43 58
Internet at home 86.00 85
Broadband at home 84.00 73
Online interaction with public authorities 53.00 64
Health and Wellness 75.25 73
Life expectancy 81.35 98
General health status 76.54 23
Premature deaths from cancer 74.60 85
Premature deaths from heart disease 33.50 67
Unmet dental needs 2.70 116
Environmental Quality 40.43 187
Satisfaction with air quality* 191
Air pollution-pm10 26.53 219
Air pollution-pm2.5 18.57 213
Air pollution-ozone 106.12 86
Pollution, grime or other environmental
problems
12.66 159
Protected land (Natura 2000) 16.31 138
Personal Rights 53.27 80
Trust in the political system 45.94 129
Trust in the legal system 37.36 78
Trust in the police 67.45 91
Quality and accountability of government services 0.74 43
Personal Freedom and Choice 78.23 74
Freedom over life choices* 103
Teenage pregnancy 0.70 78
Young people not in education, employment
or training
10.93 111
Corruption 0.91 57
Tolerance and Inclusion 75.07 94
Impartiality of government services 0.98 50
Tolerance for immigrants* 134
Tolerance for minorities* 172
Attitudes toward people with disabilities 7.60 128
Tolerance for homosexuals* 30
Gender gap -9.40 102
Community safety net* 63
Access to Advanced Education 64.90 120
Tertiary education attainment 34.73 49
Tertiary enrolment 0.03 123
Lifelong learning 6.17 196
Prov. Antwerpen
Strengths and weaknesses are relative to 15 regions of similar GDP per capita: Vorarlberg; Åland; Düsseldorf; Lombardy; Aosta Valley; Karlsruhe; Tyrol; Stuttgart; Basque Country; North Brabant; Southern
and Eastern; Berkshire, Buckinghamshire and Oxfordshire; Madrid; South Holland; Middle Franconia
*Raw data cannot be shown for Gallup indicators
Score/value
Score/value Score/value Score/value
Rank
Rank Rank Rank
Underperforming OverperformingLess than one point under neutral Less than one point over neutralNeutral
Belgium
EU Regional Social Progress Index 72.44 78/272
GDP PPP per capita (2011) €24,900 112/272
Basic Human Needs 84.78 64 Foundations of Wellbeing 68.05 43 Opportunity 65.23 109
Nutrition and Basic Medical Care 88.28 41
Mortality rate before age 65 0.11 52
Infant mortality 3.70 157
Unmet medical needs 1.01 45
Insufficient food 2.55 30
Water and Sanitation 96.08 77
Satisfaction with water quality* 139
Lack of toilet in dwelling 0.86 163
Uncollected sewage 0.00 1
Sewage treatment 100.00 1
Shelter 80.20 23
Burdensome cost of housing 16.52 36
Satisfaction with housing 43.34 97
Overcrowding 1.48 4
Lack of adequate heating 3.82 44
Personal Safety 75.28 179
Homicide rate 1.56 214
Safety at night* 106
Traffic deaths 78.30 207
Access to Basic Knowledge 78.19 101
Secondary enrolment rate 0.98 37
Lower secondary completion only 28.73 190
Early school leaving 9.73 97
Access to Information
and Communications
70.43 103
Internet at home 83.00 101
Broadband at home 81.00 97
Online interaction with public authorities 47.00 109
Health and Wellness 75.73 62
Life expectancy 81.65 82
General health status 76.54 23
Premature deaths from cancer 74.10 78
Premature deaths from heart disease 32.50 58
Unmet dental needs 2.70 116
Environmental Quality 49.83 92
Satisfaction with air quality* 191
Air pollution-pm10 23.85 185
Air pollution-pm2.5 16.66 182
Air pollution-ozone 107.26 95
Pollution, grime or other environmental
problems
12.66 159
Protected land (Natura 2000) 30.28 51
Personal Rights 53.27 80
Trust in the political system 45.94 129
Trust in the legal system 37.36 78
Trust in the police 67.45 91
Quality and accountability of government services 0.74 43
Personal Freedom and Choice 78.12 75
Freedom over life choices* 103
Teenage pregnancy 0.51 33
Young people not in education, employment
or training
11.80 126
Corruption 0.91 57
Tolerance and Inclusion 75.07 94
Impartiality of government services 0.98 50
Tolerance for immigrants* 134
Tolerance for minorities* 172
Attitudes toward people with disabilities 7.60 128
Tolerance for homosexuals* 30
Gender gap -9.40 102
Community safety net* 63
Access to Advanced Education 56.30 167
Tertiary education attainment 29.40 105
Tertiary enrolment 0.03 217
Lifelong learning 6.60 189
Prov. Limburg (BE)
Strengths and weaknesses are relative to 15 regions of similar GDP per capita: Trier; Cyprus; South Aegean; East Anglia; Drenthe; Castile and León; Cantabria; Pays de la Loire; Leicestershire, Rutland and
Northamptonshire; West Yorkshire; Midi-Pyrénées; Aquitaine; Southern Finland; Greater Manchester; Upper Normandy
*Raw data cannot be shown for Gallup indicators
Score/value
Score/value Score/value Score/value
Rank
Rank Rank Rank
Underperforming OverperformingLess than one point under neutral Less than one point over neutralNeutral
Belgium
EU Regional Social Progress Index 73.82 49/272
GDP PPP per capita (2011) €27,400 84/272
Basic Human Needs 85.18 54 Foundations of Wellbeing 65.14 109 Opportunity 71.84 49
Nutrition and Basic Medical Care 86.65 67
Mortality rate before age 65 0.12 102
Infant mortality 3.80 166
Unmet medical needs 1.01 45
Insufficient food 2.55 30
Water and Sanitation 95.72 81
Satisfaction with water quality* 139
Lack of toilet in dwelling 0.86 163
Uncollected sewage 0.00 1
Sewage treatment 98.56 41
Shelter 80.20 23
Burdensome cost of housing 16.52 36
Satisfaction with housing 43.34 97
Overcrowding 1.48 4
Lack of adequate heating 3.82 44
Personal Safety 78.66 152
Homicide rate 1.10 139
Safety at night* 106
Traffic deaths 64.52 162
Access to Basic Knowledge 81.75 71
Secondary enrolment rate 1.00 1
Lower secondary completion only 26.47 172
Early school leaving 8.47 68
Access to Information
and Communications
73.09 79
Internet at home 83.00 101
Broadband at home 82.00 92
Online interaction with public authorities 54.00 60
Health and Wellness 73.89 108
Life expectancy 80.95 135
General health status 76.54 23
Premature deaths from cancer 81.70 144
Premature deaths from heart disease 36.00 95
Unmet dental needs 2.70 116
Environmental Quality 37.17 225
Satisfaction with air quality* 191
Air pollution-pm10 27.34 230
Air pollution-pm2.5 19.06 219
Air pollution-ozone 102.27 70
Pollution, grime or other environmental
problems
12.66 159
Protected land (Natura 2000) 8.30 212
Personal Rights 53.27 80
Trust in the political system 45.94 129
Trust in the legal system 37.36 78
Trust in the police 67.45 91
Quality and accountability of government services 0.74 43
Personal Freedom and Choice 79.87 69
Freedom over life choices* 103
Teenage pregnancy 0.73 84
Young people not in education, employment
or training
8.47 72
Corruption 0.91 57
Tolerance and Inclusion 75.07 94
Impartiality of government services 0.98 50
Tolerance for immigrants* 134
Tolerance for minorities* 172
Attitudes toward people with disabilities 7.60 128
Tolerance for homosexuals* 30
Gender gap -9.40 102
Community safety net* 63
Access to Advanced Education 81.05 64
Tertiary education attainment 35.77 44
Tertiary enrolment 0.05 1
Lifelong learning 7.50 162
Prov. OostVlaanderen
Strengths and weaknesses are relative to 15 regions of similar GDP per capita: Arnsberg; Giessen; Liguria; Rhône-Alpes; Carinthia; Münster; Central Hungary; Småland with Islands; Hampshire and Isle of
Wight; Gelderland; Northern Jutland; Styria; Aragon; Piedmont; South Sweden
*Raw data cannot be shown for Gallup indicators
Score/value
Score/value Score/value Score/value
Rank
Rank Rank Rank
Underperforming OverperformingLess than one point under neutral Less than one point over neutralNeutral
Belgium
EU Regional Social Progress Index 74.31 42/272
GDP PPP per capita (2011) €31,800 40/272
Basic Human Needs 86.47 31 Foundations of Wellbeing 64.81 114 Opportunity 72.43 43
Nutrition and Basic Medical Care 88.68 36
Mortality rate before age 65 0.11 52
Infant mortality 3.35 115
Unmet medical needs 1.01 45
Insufficient food 2.55 30
Water and Sanitation 95.03 86
Satisfaction with water quality* 139
Lack of toilet in dwelling 0.86 163
Uncollected sewage 0.00 1
Sewage treatment 95.80 76
Shelter 80.20 23
Burdensome cost of housing 16.52 36
Satisfaction with housing 43.34 97
Overcrowding 1.48 4
Lack of adequate heating 3.82 44
Personal Safety 82.34 100
Homicide rate 0.65 43
Safety at night* 106
Traffic deaths 48.28 101
Access to Basic Knowledge 75.06 121
Secondary enrolment rate 0.92 177
Lower secondary completion only 19.53 108
Early school leaving 6.03 24
Access to Information
and Communications
73.76 70
Internet at home 83.00 101
Broadband at home 81.00 97
Online interaction with public authorities 57.00 49
Health and Wellness 76.29 53
Life expectancy 82.00 58
General health status 76.54 23
Premature deaths from cancer 73.40 72
Premature deaths from heart disease 31.40 48
Unmet dental needs 2.70 116
Environmental Quality 38.64 208
Satisfaction with air quality* 191
Air pollution-pm10 25.34 205
Air pollution-pm2.5 17.61 196
Air pollution-ozone 105.88 85
Pollution, grime or other environmental
problems
12.66 159
Protected land (Natura 2000) 9.81 199
Personal Rights 53.27 80
Trust in the political system 45.94 129
Trust in the legal system 37.36 78
Trust in the police 67.45 91
Quality and accountability of government services 0.74 43
Personal Freedom and Choice 81.69 57
Freedom over life choices* 103
Teenage pregnancy 0.36 7
Young people not in education, employment
or training
7.23 48
Corruption 0.91 57
Tolerance and Inclusion 75.07 94
Impartiality of government services 0.98 50
Tolerance for immigrants* 134
Tolerance for minorities* 172
Attitudes toward people with disabilities 7.60 128
Tolerance for homosexuals* 30
Gender gap -9.40 102
Community safety net* 63
Access to Advanced Education 81.75 59
Tertiary education attainment 43.33 1
Tertiary enrolment 0.05 53
Lifelong learning 9.07 133
Prov. VlaamsBrabant
Strengths and weaknesses are relative to 15 regions of similar GDP per capita: Upper Austria; Cologne; Navarra; Tübingen; Emilia–Romagna; Middle Franconia; South Holland; Madrid; Upper Palatinate;
Walloon Brabant; Trento; Zeeland; Cheshire; North Brabant; Basque Country
*Raw data cannot be shown for Gallup indicators
Score/value
Score/value Score/value Score/value
Rank
Rank Rank Rank
Underperforming OverperformingLess than one point under neutral Less than one point over neutralNeutral
Belgium
EU Regional Social Progress Index 70.75 118/272
GDP PPP per capita (2011) €28,500 67/272
Basic Human Needs 85.10 56 Foundations of Wellbeing 62.74 155 Opportunity 65.42 105
Nutrition and Basic Medical Care 87.01 58
Mortality rate before age 65 0.12 102
Infant mortality 3.60 146
Unmet medical needs 1.01 45
Insufficient food 2.55 30
Water and Sanitation 95.98 78
Satisfaction with water quality* 139
Lack of toilet in dwelling 0.86 163
Uncollected sewage 0.00 1
Sewage treatment 99.61 26
Shelter 80.20 23
Burdensome cost of housing 16.52 36
Satisfaction with housing 43.34 97
Overcrowding 1.48 4
Lack of adequate heating 3.82 44
Personal Safety 77.79 159
Homicide rate 0.89 104
Safety at night* 106
Traffic deaths 77.01 205
Access to Basic Knowledge 75.29 118
Secondary enrolment rate 0.95 115
Lower secondary completion only 27.00 178
Early school leaving 7.60 52
Access to Information
and Communications
66.43 136
Internet at home 78.00 150
Broadband at home 77.00 123
Online interaction with public authorities 44.00 124
Health and Wellness 74.65 91
Life expectancy 81.60 83
General health status 76.54 23
Premature deaths from cancer 80.50 136
Premature deaths from heart disease 37.60 110
Unmet dental needs 2.70 116
Environmental Quality 38.63 209
Satisfaction with air quality* 191
Air pollution-pm10 26.96 227
Air pollution-pm2.5 19.00 216
Air pollution-ozone 99.89 61
Pollution, grime or other environmental
problems
12.66 159
Protected land (Natura 2000) 8.85 208
Personal Rights 53.27 80
Trust in the political system 45.94 129
Trust in the legal system 37.36 78
Trust in the police 67.45 91
Quality and accountability of government services 0.74 43
Personal Freedom and Choice 80.14 68
Freedom over life choices* 103
Teenage pregnancy 0.63 63
Young people not in education, employment
or training
8.47 72
Corruption 0.91 57
Tolerance and Inclusion 75.07 94
Impartiality of government services 0.98 50
Tolerance for immigrants* 134
Tolerance for minorities* 172
Attitudes toward people with disabilities 7.60 128
Tolerance for homosexuals* 30
Gender gap -9.40 102
Community safety net* 63
Access to Advanced Education 55.31 174
Tertiary education attainment 32.17 77
Tertiary enrolment 0.02 248
Lifelong learning 6.73 184
Prov. WestVlaanderen
Strengths and weaknesses are relative to 15 regions of similar GDP per capita: Bedfordshire and Hertfordshire; Berlin; Southern Denmark; RheinhessenPfalz; Surrey, East and West Sussex; Upper Franconia;
Tuscany; Kassel; Lisbon; La Rioja; Gloucestershire, Wiltshire and Bristol/Bath area; Piedmont; Aragon; Saarland; Overijssel
*Raw data cannot be shown for Gallup indicators
Score/value
Score/value Score/value Score/value
Rank
Rank Rank Rank
Underperforming OverperformingLess than one point under neutral Less than one point over neutralNeutral
Belgium
EU Regional Social Progress Index 68.89 139/272
GDP PPP per capita (2011) €29,800 56/272
Basic Human Needs 73.70 191 Foundations of Wellbeing 63.04 152 Opportunity 70.15 67
Nutrition and Basic Medical Care 83.26 152
Mortality rate before age 65 0.12 102
Infant mortality 4.45 215
Unmet medical needs 1.91 141
Insufficient food 6.46 66
Water and Sanitation 69.27 237
Satisfaction with water quality* 162
Lack of toilet in dwelling 1.70 201
Uncollected sewage 2.13 232
Sewage treatment 0.91 234
Shelter 71.01 151
Burdensome cost of housing 46.97 212
Satisfaction with housing 43.34 97
Overcrowding 1.59 13
Lack of adequate heating 9.97 185
Personal Safety 71.67 214
Homicide rate 1.59 219
Safety at night* 196
Traffic deaths 71.64 197
Access to Basic Knowledge 74.25 126
Secondary enrolment rate 0.92 177
Lower secondary completion only 17.07 83
Early school leaving 8.53 70
Access to Information
and Communications
74.43 58
Internet at home 84.00 97
Broadband at home 82.00 92
Online interaction with public authorities 57.00 49
Health and Wellness 72.43 147
Life expectancy 81.15 112
General health status 68.36 126
Premature deaths from cancer 77.80 110
Premature deaths from heart disease 30.90 42
Unmet dental needs 3.70 134
Environmental Quality 36.06 238
Satisfaction with air quality* 204
Air pollution-pm10 24.06 187
Air pollution-pm2.5 16.29 176
Air pollution-ozone 107.05 93
Pollution, grime or other environmental
problems
19.57 212
Protected land (Natura 2000) 7.84 217
Personal Rights 53.27 80
Trust in the political system 45.94 129
Trust in the legal system 37.36 78
Trust in the police 67.45 91
Quality and accountability of government services 0.74 43
Personal Freedom and Choice 74.73 102
Freedom over life choices* 123
Teenage pregnancy 0.57 47
Young people not in education, employment
or training
12.80 146
Corruption 0.37 134
Tolerance and Inclusion 69.52 161
Impartiality of government services -0.35 183
Tolerance for immigrants* 140
Tolerance for minorities* 155
Attitudes toward people with disabilities 7.60 128
Tolerance for homosexuals* 102
Gender gap -10.60 150
Community safety net* 181
Access to Advanced Education 85.02 43
Tertiary education attainment 52.70 1
Tertiary enrolment 0.08 1
Lifelong learning 8.20 150
Prov. Brabant Wallon
Strengths and weaknesses are relative to 15 regions of similar GDP per capita: Upper Palatinate; Trento; Zeeland; Cheshire; Emilia–Romagna; Tübingen; Navarra; Upper Norrland; Lower Franconia; Upper
Austria; Swabia; Flemish Brabant; Cologne; Lazio; Veneto
*Raw data cannot be shown for Gallup indicators
Score/value
Score/value Score/value Score/value
Rank
Rank Rank Rank
Underperforming OverperformingLess than one point under neutral Less than one point over neutralNeutral
Belgium
EU Regional Social Progress Index 62.44 183/272
GDP PPP per capita (2011) €19,900 183/272
Basic Human Needs 71.63 200 Foundations of Wellbeing 56.49 211 Opportunity 59.69 154
Nutrition and Basic Medical Care 79.86 199
Mortality rate before age 65 0.18 223
Infant mortality 3.35 115
Unmet medical needs 1.91 141
Insufficient food 6.46 66
Water and Sanitation 69.23 238
Satisfaction with water quality* 162
Lack of toilet in dwelling 1.70 201
Uncollected sewage 1.62 224
Sewage treatment 0.00 236
Shelter 71.01 151
Burdensome cost of housing 46.97 212
Satisfaction with housing 43.34 97
Overcrowding 1.59 13
Lack of adequate heating 9.97 185
Personal Safety 66.76 248
Homicide rate 2.12 243
Safety at night* 196
Traffic deaths 95.32 241
Access to Basic Knowledge 65.93 190
Secondary enrolment rate 0.96 76
Lower secondary completion only 35.30 211
Early school leaving 17.27 217
Access to Information
and Communications
62.09 157
Internet at home 72.00 183
Broadband at home 71.00 161
Online interaction with public authorities 43.00 131
Health and Wellness 64.49 213
Life expectancy 78.20 217
General health status 68.36 126
Premature deaths from cancer 103.20 220
Premature deaths from heart disease 57.10 203
Unmet dental needs 3.70 134
Environmental Quality 36.40 233
Satisfaction with air quality* 204
Air pollution-pm10 24.33 192
Air pollution-pm2.5 16.78 186
Air pollution-ozone 106.47 88
Pollution, grime or other environmental
problems
19.57 212
Protected land (Natura 2000) 9.12 206
Personal Rights 53.27 80
Trust in the political system 45.94 129
Trust in the legal system 37.36 78
Trust in the police 67.45 91
Quality and accountability of government services 0.74 43
Personal Freedom and Choice 68.65 163
Freedom over life choices* 123
Teenage pregnancy 1.66 204
Young people not in education, employment
or training
17.53 217
Corruption 0.37 134
Tolerance and Inclusion 69.52 161
Impartiality of government services -0.35 183
Tolerance for immigrants* 140
Tolerance for minorities* 155
Attitudes toward people with disabilities 7.60 128
Tolerance for homosexuals* 102
Gender gap -10.60 150
Community safety net* 181
Access to Advanced Education 48.74 214
Tertiary education attainment 27.10 131
Tertiary enrolment 0.03 217
Lifelong learning 3.47 225
Prov. Hainaut
Strengths and weaknesses are relative to 15 regions of similar GDP per capita: Sardinia; South Yorkshire; Shropshire and Staffordshire; Central Greece (NUTS2); Castile-La Mancha; South West Bulgaria;
Melilla; Martinique; Luxembourg (Belgium); Molise; Crete; Andalusia; Thuringia; Lancashire; Algarve
*Raw data cannot be shown for Gallup indicators
Score/value
Score/value Score/value Score/value
Rank
Rank Rank Rank
Underperforming OverperformingLess than one point under neutral Less than one point over neutralNeutral
Belgium
EU Regional Social Progress Index 64.80 168/272
GDP PPP per capita (2011) €22,600 136/272
Basic Human Needs 72.12 198 Foundations of Wellbeing 57.05 208 Opportunity 65.68 103
Nutrition and Basic Medical Care 82.13 174
Mortality rate before age 65 0.16 213
Infant mortality 3.40 124
Unmet medical needs 1.91 141
Insufficient food 6.46 66
Water and Sanitation 69.15 241
Satisfaction with water quality* 162
Lack of toilet in dwelling 1.70 201
Uncollected sewage 1.83 229
Sewage treatment 0.00 236
Shelter 71.01 151
Burdensome cost of housing 46.97 212
Satisfaction with housing 43.34 97
Overcrowding 1.59 13
Lack of adequate heating 9.97 185
Personal Safety 66.66 249
Homicide rate 2.70 255
Safety at night* 196
Traffic deaths 80.21 215
Access to Basic Knowledge 55.23 241
Secondary enrolment rate 0.87 243
Lower secondary completion only 33.03 206
Early school leaving 15.47 199
Access to Information
and Communications
65.43 144
Internet at home 77.00 154
Broadband at home 76.00 135
Online interaction with public authorities 43.00 131
Health and Wellness 68.16 195
Life expectancy 79.10 212
General health status 68.36 126
Premature deaths from cancer 84.60 159
Premature deaths from heart disease 46.70 163
Unmet dental needs 3.70 134
Environmental Quality 41.41 178
Satisfaction with air quality* 204
Air pollution-pm10 21.47 151
Air pollution-pm2.5 15.00 149
Air pollution-ozone 106.97 92
Pollution, grime or other environmental
problems
19.57 212
Protected land (Natura 2000) 13.83 169
Personal Rights 53.27 80
Trust in the political system 45.94 129
Trust in the legal system 37.36 78
Trust in the police 67.45 91
Quality and accountability of government services 0.74 43
Personal Freedom and Choice 72.14 130
Freedom over life choices* 123
Teenage pregnancy 1.22 165
Young people not in education, employment
or training
14.13 165
Corruption 0.37 134
Tolerance and Inclusion 69.52 161
Impartiality of government services -0.35 183
Tolerance for immigrants* 140
Tolerance for minorities* 155
Attitudes toward people with disabilities 7.60 128
Tolerance for homosexuals* 102
Gender gap -10.60 150
Community safety net* 181
Access to Advanced Education 68.68 105
Tertiary education attainment 31.93 80
Tertiary enrolment 0.04 66
Lifelong learning 6.43 190
Prov. Liège
Strengths and weaknesses are relative to 15 regions of similar GDP per capita: Galicia; Brittany; West Midlands; Zealand; Essex; Nord-Pas-de-Calais; Ceuta; Corsica; Valencia; Herefordshire, Worcestershire
and Warwickshire; Burgundy; Cumbria; Auvergne; Dresden; Dorset and Somerset
*Raw data cannot be shown for Gallup indicators
Score/value
Score/value Score/value Score/value
Rank
Rank Rank Rank
Underperforming OverperformingLess than one point under neutral Less than one point over neutralNeutral
Belgium
EU Regional Social Progress Index 65.84 160/272
GDP PPP per capita (2011) €20,300 177/272
Basic Human Needs 70.51 208 Foundations of Wellbeing 66.16 81 Opportunity 61.03 147
Nutrition and Basic Medical Care 81.95 182
Mortality rate before age 65 0.16 213
Infant mortality 3.25 103
Unmet medical needs 1.91 141
Insufficient food 6.46 66
Water and Sanitation 70.00 235
Satisfaction with water quality* 162
Lack of toilet in dwelling 1.70 201
Uncollected sewage 1.11 219
Sewage treatment 2.36 231
Shelter 71.01 151
Burdensome cost of housing 46.97 212
Satisfaction with housing 43.34 97
Overcrowding 1.59 13
Lack of adequate heating 9.97 185
Personal Safety 59.92 267
Homicide rate 1.62 222
Safety at night* 196
Traffic deaths 161.99 271
Access to Basic Knowledge 78.59 98
Secondary enrolment rate 1.02 1
Lower secondary completion only 29.90 194
Early school leaving 11.70 139
Access to Information
and Communications
66.43 136
Internet at home 76.00 159
Broadband at home 76.00 135
Online interaction with public authorities 47.00 109
Health and Wellness 68.07 196
Life expectancy 79.40 208
General health status 68.36 126
Premature deaths from cancer 89.90 189
Premature deaths from heart disease 45.70 159
Unmet dental needs 3.70 134
Environmental Quality 52.86 67
Satisfaction with air quality* 204
Air pollution-pm10 15.71 36
Air pollution-pm2.5 11.86 62
Air pollution-ozone 113.63 136
Pollution, grime or other environmental
problems
19.57 212
Protected land (Natura 2000) 31.25 47
Personal Rights 53.27 80
Trust in the political system 45.94 129
Trust in the legal system 37.36 78
Trust in the police 67.45 91
Quality and accountability of government services 0.74 43
Personal Freedom and Choice 73.44 115
Freedom over life choices* 123
Teenage pregnancy 0.94 134
Young people not in education, employment
or training
13.30 154
Corruption 0.37 134
Tolerance and Inclusion 69.52 161
Impartiality of government services -0.35 183
Tolerance for immigrants* 140
Tolerance for minorities* 155
Attitudes toward people with disabilities 7.60 128
Tolerance for homosexuals* 102
Gender gap -10.60 150
Community safety net* 181
Access to Advanced Education 49.58 209
Tertiary education attainment 32.07 78
Tertiary enrolment 0.01 260
Lifelong learning 5.53 208
Prov. Luxembourg (BE)
Strengths and weaknesses are relative to 15 regions of similar GDP per capita: Melilla; Molise; Thuringia; Lancashire; Castile-La Mancha; Algarve; Western Macedonia; Murcia; Northern Ireland; Shropshire
and Staffordshire; Mecklenburg-Vorpommern; Highlands and Islands; Sardinia; Hainaut; Picardy
*Raw data cannot be shown for Gallup indicators
Score/value
Score/value Score/value Score/value
Rank
Rank Rank Rank
Underperforming OverperformingLess than one point under neutral Less than one point over neutralNeutral
Belgium
EU Regional Social Progress Index 66.54 156/272
GDP PPP per capita (2011) €21,500 155/272
Basic Human Needs 70.87 204 Foundations of Wellbeing 64.19 133 Opportunity 64.67 120
Nutrition and Basic Medical Care 81.95 182
Mortality rate before age 65 0.17 218
Infant mortality 2.80 57
Unmet medical needs 1.91 141
Insufficient food 6.46 66
Water and Sanitation 69.22 239
Satisfaction with water quality* 162
Lack of toilet in dwelling 1.70 201
Uncollected sewage 1.63 225
Sewage treatment 0.00 236
Shelter 71.01 151
Burdensome cost of housing 46.97 212
Satisfaction with housing 43.34 97
Overcrowding 1.59 13
Lack of adequate heating 9.97 185
Personal Safety 61.99 258
Homicide rate 1.63 225
Safety at night* 196
Traffic deaths 145.61 265
Access to Basic Knowledge 76.86 113
Secondary enrolment rate 0.99 18
Lower secondary completion only 28.10 186
Early school leaving 13.27 164
Access to Information
and Communications
69.43 112
Internet at home 79.00 137
Broadband at home 78.00 112
Online interaction with public authorities 51.00 74
Health and Wellness 67.25 200
Life expectancy 78.95 213
General health status 68.36 126
Premature deaths from cancer 90.60 191
Premature deaths from heart disease 48.60 172
Unmet dental needs 3.70 134
Environmental Quality 45.52 133
Satisfaction with air quality* 204
Air pollution-pm10 21.05 143
Air pollution-pm2.5 13.94 126
Air pollution-ozone 108.56 102
Pollution, grime or other environmental
problems
19.57 212
Protected land (Natura 2000) 21.19 105
Personal Rights 53.27 80
Trust in the political system 45.94 129
Trust in the legal system 37.36 78
Trust in the police 67.45 91
Quality and accountability of government services 0.74 43
Personal Freedom and Choice 73.46 113
Freedom over life choices* 123
Teenage pregnancy 0.94 134
Young people not in education, employment
or training
13.27 153
Corruption 0.37 134
Tolerance and Inclusion 69.52 161
Impartiality of government services -0.35 183
Tolerance for immigrants* 140
Tolerance for minorities* 155
Attitudes toward people with disabilities 7.60 128
Tolerance for homosexuals* 102
Gender gap -10.60 150
Community safety net* 181
Access to Advanced Education 63.35 129
Tertiary education attainment 33.67 60
Tertiary enrolment 0.04 91
Lifelong learning 4.67 214
Prov. Namur
Strengths and weaknesses are relative to 15 regions of similar GDP per capita: Derbyshire and Nottinghamshire; Malta; Brandenburg; East Yorkshire and Northern Lincolnshire; Lower Normandy; Burgenland;
Languedoc-Roussillon; Canary Islands; Ionian Islands; Franche-Comté; Devon; Lorraine; Northumberland and Tyne and Wear; Border, Midland and Western; Saxony-Anhalt
*Raw data cannot be shown for Gallup indicators
Score/value
Score/value Score/value Score/value
Rank
Rank Rank Rank
Underperforming OverperformingLess than one point under neutral Less than one point over neutralNeutral
Belgium
EU Regional Social Progress Index 40.62 271/272
GDP PPP per capita (2011) €7,200 271/272
Basic Human Needs 44.71 268 Foundations of Wellbeing 46.97 266 Opportunity 31.12 272
Nutrition and Basic Medical Care 41.46 267
Mortality rate before age 65 0.27 268
Infant mortality 9.45 266
Unmet medical needs 8.35 246
Insufficient food 45.62 268
Water and Sanitation 39.07 267
Satisfaction with water quality* 251
Lack of toilet in dwelling 34.52 249
Uncollected sewage 34.53 264
Sewage treatment 0.00 236
Shelter 36.62 268
Burdensome cost of housing 40.90 190
Satisfaction with housing 5.08 267
Overcrowding 42.52 234
Lack of adequate heating 54.24 272
Personal Safety 64.08 256
Homicide rate 2.54 254
Safety at night* 192
Traffic deaths 106.03 255
Access to Basic Knowledge 64.65 196
Secondary enrolment rate 0.90 210
Lower secondary completion only 18.17 94
Early school leaving 18.53 224
Access to Information
and Communications
33.40 272
Internet at home 43.00 267
Broadband at home 42.00 259
Online interaction with public authorities 14.00 260
Health and Wellness 43.18 268
Life expectancy 72.95 270
General health status 64.16 220
Premature deaths from cancer 100.10 212
Premature deaths from heart disease 206.10 262
Unmet dental needs 9.97 247
Environmental Quality 49.33 95
Satisfaction with air quality* 174
Air pollution-pm10 27.31 229
Air pollution-pm2.5 18.02 209
Air pollution-ozone 112.73 125
Pollution, grime or other environmental
problems
16.60 195
Protected land (Natura 2000) 40.51 1
Personal Rights 15.62 270
Trust in the political system 15.33 256
Trust in the legal system 11.48 225
Trust in the police 19.86 269
Quality and accountability of government services -2.13 263
Personal Freedom and Choice 34.86 271
Freedom over life choices* 199
Teenage pregnancy 4.92 270
Young people not in education, employment
or training
34.77 264
Corruption -2.07 267
Tolerance and Inclusion 53.49 236
Impartiality of government services -2.55 269
Tolerance for immigrants* 262
Tolerance for minorities* 191
Attitudes toward people with disabilities 6.40 231
Tolerance for homosexuals* 244
Gender gap -3.73 14
Community safety net* 213
Access to Advanced Education 26.47 270
Tertiary education attainment 18.77 209
Tertiary enrolment 0.00 272
Lifelong learning n/a n/a
Severozapaden
Strengths and weaknesses are relative to 15 regions of similar GDP per capita: Northeast Romania; North Central Bulgaria; South Central Bulgaria; North East Bulgaria; Southwest Oltenia; South East
Bulgaria; Southeast Romania; Northern Hungary; South Muntenia; Northern Great Plain; Lublin Province; Podkarpacia; Northwest Romania; Southern Great Plain; Southern Transdanubia
*Raw data cannot be shown for Gallup indicators
Score/value
Score/value Score/value Score/value
Rank
Rank Rank Rank
Underperforming OverperformingLess than one point under neutral Less than one point over neutralNeutral
Bulgaria
EU Regional Social Progress Index 46.22 265/272
GDP PPP per capita (2011) €7,800 270/272
Basic Human Needs 47.33 266 Foundations of Wellbeing 49.30 260 Opportunity 42.18 259
Nutrition and Basic Medical Care 39.34 269
Mortality rate before age 65 0.25 256
Infant mortality 8.65 261
Unmet medical needs 9.92 255
Insufficient food 55.18 270
Water and Sanitation 47.37 261
Satisfaction with water quality* 230
Lack of toilet in dwelling 29.11 248
Uncollected sewage 23.01 261
Sewage treatment 0.00 236
Shelter 39.33 265
Burdensome cost of housing 45.18 207
Satisfaction with housing 7.80 258
Overcrowding 38.12 229
Lack of adequate heating 48.39 270
Personal Safety 65.51 253
Homicide rate 2.03 241
Safety at night* 219
Traffic deaths 94.11 238
Access to Basic Knowledge 67.46 176
Secondary enrolment rate 0.92 177
Lower secondary completion only 22.60 130
Early school leaving 15.97 208
Access to Information
and Communications
39.73 260
Internet at home 50.00 262
Broadband at home 49.00 253
Online interaction with public authorities 19.00 247
Health and Wellness 47.10 261
Life expectancy 73.75 267
General health status 63.82 221
Premature deaths from cancer 106.50 229
Premature deaths from heart disease 170.00 258
Unmet dental needs 8.83 243
Environmental Quality 44.97 140
Satisfaction with air quality* 168
Air pollution-pm10 27.82 235
Air pollution-pm2.5 19.82 227
Air pollution-ozone 111.42 114
Pollution, grime or other environmental
problems
9.80 89
Protected land (Natura 2000) 28.07 63
Personal Rights 20.09 266
Trust in the political system 15.90 253
Trust in the legal system 10.33 242
Trust in the police 29.11 264
Quality and accountability of government services -1.58 253
Personal Freedom and Choice 46.47 259
Freedom over life choices* 213
Teenage pregnancy 3.49 259
Young people not in education, employment
or training
24.40 251
Corruption -1.41 250
Tolerance and Inclusion 58.94 204
Impartiality of government services -2.06 266
Tolerance for immigrants* 228
Tolerance for minorities* 137
Attitudes toward people with disabilities 6.40 231
Tolerance for homosexuals* 207
Gender gap -5.57 34
Community safety net* 225
Access to Advanced Education 49.01 212
Tertiary education attainment 20.97 192
Tertiary enrolment 0.05 47
Lifelong learning 0.87 266
Severen tsentralen
Strengths and weaknesses are relative to 15 regions of similar GDP per capita: Northeast Romania; South Central Bulgaria; North West Bulgaria; North East Bulgaria; Southwest Oltenia; South East Bulgaria;
Southeast Romania; Northern Hungary; South Muntenia; Northern Great Plain; Lublin Province; Podkarpacia; Northwest Romania; Southern Great Plain; Southern Transdanubia
*Raw data cannot be shown for Gallup indicators
Score/value
Score/value Score/value Score/value
Rank
Rank Rank Rank
Underperforming OverperformingLess than one point under neutral Less than one point over neutralNeutral
Bulgaria
EU Regional Social Progress Index 45.67 266/272
GDP PPP per capita (2011) €9,400 267/272
Basic Human Needs 46.28 267 Foundations of Wellbeing 46.67 267 Opportunity 44.06 252
Nutrition and Basic Medical Care 35.78 271
Mortality rate before age 65 0.25 256
Infant mortality 8.60 260
Unmet medical needs 14.15 269
Insufficient food 51.28 269
Water and Sanitation 47.65 260
Satisfaction with water quality* 260
Lack of toilet in dwelling 26.55 245
Uncollected sewage 14.81 253
Sewage treatment 0.00 236
Shelter 36.41 269
Burdensome cost of housing 45.35 209
Satisfaction with housing 6.29 263
Overcrowding 46.50 251
Lack of adequate heating 45.88 268
Personal Safety 68.80 236
Homicide rate 1.60 221
Safety at night* 211
Traffic deaths 83.17 219
Access to Basic Knowledge 64.45 197
Secondary enrolment rate 0.89 222
Lower secondary completion only 24.97 154
Early school leaving 14.07 182
Access to Information
and Communications
40.40 259
Internet at home 52.00 254
Broadband at home 52.00 245
Online interaction with public authorities 16.00 258
Health and Wellness 40.51 271
Life expectancy 73.95 265
General health status 64.25 218
Premature deaths from cancer 118.30 247
Premature deaths from heart disease 166.00 257
Unmet dental needs 16.23 269
Environmental Quality 43.26 159
Satisfaction with air quality* 201
Air pollution-pm10 28.07 238
Air pollution-pm2.5 20.49 231
Air pollution-ozone 113.35 132
Pollution, grime or other environmental
problems
17.36 203
Protected land (Natura 2000) 33.69 37
Personal Rights 22.77 265
Trust in the political system 17.80 250
Trust in the legal system 12.89 215
Trust in the police 21.09 267
Quality and accountability of government services -0.72 216
Personal Freedom and Choice 47.79 257
Freedom over life choices* 222
Teenage pregnancy 4.03 265
Young people not in education, employment
or training
23.97 249
Corruption -0.57 195
Tolerance and Inclusion 60.08 201
Impartiality of government services -0.31 181
Tolerance for immigrants* 208
Tolerance for minorities* 127
Attitudes toward people with disabilities 6.40 231
Tolerance for homosexuals* 234
Gender gap -8.10 71
Community safety net* 256
Access to Advanced Education 50.65 205
Tertiary education attainment 23.33 173
Tertiary enrolment 0.05 56
Lifelong learning 1.40 255
Severoiztochen
Strengths and weaknesses are relative to 15 regions of similar GDP per capita: Southwest Oltenia; South East Bulgaria; Southeast Romania; Northern Hungary; South Muntenia; South Central Bulgaria;
Northern Great Plain; Lublin Province; Podkarpacia; Northwest Romania; North Central Bulgaria; Southern Great Plain; Northeast Romania; Southern Transdanubia; North West Bulgaria
*Raw data cannot be shown for Gallup indicators
Score/value
Score/value Score/value Score/value
Rank
Rank Rank Rank
Underperforming OverperformingLess than one point under neutral Less than one point over neutralNeutral
Bulgaria
EU Regional Social Progress Index 39.72 272/272
GDP PPP per capita (2011) €9,500 266/272
Basic Human Needs 42.46 272 Foundations of Wellbeing 45.80 269 Opportunity 31.61 271
Nutrition and Basic Medical Care 31.32 272
Mortality rate before age 65 0.26 261
Infant mortality 10.65 271
Unmet medical needs 13.09 267
Insufficient food 55.81 271
Water and Sanitation 44.75 266
Satisfaction with water quality* 242
Lack of toilet in dwelling 28.84 247
Uncollected sewage 26.39 263
Sewage treatment 0.00 236
Shelter 34.13 272
Burdensome cost of housing 48.76 222
Satisfaction with housing 6.08 264
Overcrowding 47.30 257
Lack of adequate heating 50.21 271
Personal Safety 63.00 257
Homicide rate 2.47 253
Safety at night* 212
Traffic deaths 104.29 254
Access to Basic Knowledge 54.79 243
Secondary enrolment rate 0.85 266
Lower secondary completion only 24.03 142
Early school leaving 20.07 231
Access to Information
and Communications
38.06 263
Internet at home 47.00 266
Broadband at home 47.00 254
Online interaction with public authorities 19.00 247
Health and Wellness 42.16 270
Life expectancy 73.65 268
General health status 66.90 167
Premature deaths from cancer 103.20 220
Premature deaths from heart disease 190.80 261
Unmet dental needs 11.57 254
Environmental Quality 49.08 98
Satisfaction with air quality* 234
Air pollution-pm10 25.79 209
Air pollution-pm2.5 17.50 193
Air pollution-ozone 112.29 119
Pollution, grime or other environmental
problems
20.52 222
Protected land (Natura 2000) 43.17 1
Personal Rights 14.42 271
Trust in the political system 11.05 271
Trust in the legal system 11.34 230
Trust in the police 20.16 268
Quality and accountability of government services -2.17 265
Personal Freedom and Choice 35.49 270
Freedom over life choices* 224
Teenage pregnancy 6.60 271
Young people not in education, employment
or training
27.90 259
Corruption -1.28 241
Tolerance and Inclusion 53.87 232
Impartiality of government services -2.12 267
Tolerance for immigrants* 244
Tolerance for minorities* 199
Attitudes toward people with disabilities 6.40 231
Tolerance for homosexuals* 247
Gender gap -7.03 44
Community safety net* 214
Access to Advanced Education 29.10 267
Tertiary education attainment 19.73 200
Tertiary enrolment 0.02 254
Lifelong learning 1.03 263
Yugoiztochen
Strengths and weaknesses are relative to 15 regions of similar GDP per capita: Southwest Oltenia; North East Bulgaria; Southeast Romania; Northern Hungary; South Muntenia; South Central Bulgaria;
Northern Great Plain; Lublin Province; Podkarpacia; Northwest Romania; North Central Bulgaria; Southern Great Plain; Northeast Romania; Southern Transdanubia; Central Romania
*Raw data cannot be shown for Gallup indicators
Score/value
Score/value Score/value Score/value
Rank
Rank Rank Rank
Underperforming OverperformingLess than one point under neutral Less than one point over neutralNeutral
Bulgaria
EU Regional Social Progress Index 50.70 258/272
GDP PPP per capita (2011) €19,600 188/272
Basic Human Needs 52.75 259 Foundations of Wellbeing 54.84 228 Opportunity 44.79 251
Nutrition and Basic Medical Care 55.31 259
Mortality rate before age 65 0.23 248
Infant mortality 4.95 228
Unmet medical needs 6.57 227
Insufficient food 41.54 267
Water and Sanitation 54.76 259
Satisfaction with water quality* 259
Lack of toilet in dwelling 9.18 238
Uncollected sewage 15.89 255
Sewage treatment 0.00 236
Shelter 36.15 271
Burdensome cost of housing 46.03 211
Satisfaction with housing 6.31 262
Overcrowding 48.81 265
Lack of adequate heating 42.85 267
Personal Safety 67.27 245
Homicide rate 2.08 242
Safety at night* 229
Traffic deaths 62.56 147
Access to Basic Knowledge 86.80 26
Secondary enrolment rate 0.95 115
Lower secondary completion only 8.90 22
Early school leaving 4.07 7
Access to Information
and Communications
54.40 211
Internet at home 64.00 234
Broadband at home 64.00 214
Online interaction with public authorities 34.00 171
Health and Wellness 44.20 266
Life expectancy 75.25 250
General health status 66.93 166
Premature deaths from cancer 105.40 225
Premature deaths from heart disease 171.40 259
Unmet dental needs 8.97 244
Environmental Quality 39.45 202
Satisfaction with air quality* 260
Air pollution-pm10 34.93 259
Air pollution-pm2.5 23.94 255
Air pollution-ozone 115.29 150
Pollution, grime or other environmental
problems
17.36 203
Protected land (Natura 2000) 46.20 1
Personal Rights 18.17 269
Trust in the political system 19.47 243
Trust in the legal system 14.37 184
Trust in the police 28.68 265
Quality and accountability of government services -2.47 268
Personal Freedom and Choice 50.97 252
Freedom over life choices* 247
Teenage pregnancy 2.25 238
Young people not in education, employment
or training
10.97 113
Corruption -2.66 270
Tolerance and Inclusion 51.69 249
Impartiality of government services -3.17 270
Tolerance for immigrants* 249
Tolerance for minorities* 234
Attitudes toward people with disabilities 6.40 231
Tolerance for homosexuals* 222
Gender gap -4.70 22
Community safety net* 230
Access to Advanced Education 66.85 110
Tertiary education attainment 33.63 62
Tertiary enrolment 0.06 1
Lifelong learning 2.63 238
Yugozapaden
Strengths and weaknesses are relative to 15 regions of similar GDP per capita: Martinique; Crete; Andalusia; Central Greece (NUTS2); South Yorkshire; Tees Valley and Durham; Azores; Lincolnshire; Hainaut;
Sardinia; Guadeloupe; Shropshire and Staffordshire; Southeast; Castile-La Mancha; Central Bohemian Region
*Raw data cannot be shown for Gallup indicators
Score/value
Score/value Score/value Score/value
Rank
Rank Rank Rank
Underperforming OverperformingLess than one point under neutral Less than one point over neutralNeutral
Bulgaria
EU Regional Social Progress Index 44.22 267/272
GDP PPP per capita (2011) €8,100 269/272
Basic Human Needs 47.86 265 Foundations of Wellbeing 49.74 256 Opportunity 35.74 270
Nutrition and Basic Medical Care 40.70 268
Mortality rate before age 65 0.23 248
Infant mortality 9.50 267
Unmet medical needs 6.34 226
Insufficient food 62.85 272
Water and Sanitation 45.72 263
Satisfaction with water quality* 255
Lack of toilet in dwelling 25.37 244
Uncollected sewage 24.34 262
Sewage treatment 0.00 236
Shelter 37.98 266
Burdensome cost of housing 43.90 201
Satisfaction with housing 2.71 271
Overcrowding 44.24 240
Lack of adequate heating 40.86 266
Personal Safety 70.02 229
Homicide rate 1.73 230
Safety at night* 181
Traffic deaths 85.20 223
Access to Basic Knowledge 62.39 210
Secondary enrolment rate 0.89 222
Lower secondary completion only 24.80 152
Early school leaving 15.30 195
Access to Information
and Communications
42.40 256
Internet at home 53.00 251
Broadband at home 53.00 243
Online interaction with public authorities 20.00 243
Health and Wellness 48.05 257
Life expectancy 74.75 257
General health status 71.36 104
Premature deaths from cancer 105.90 228
Premature deaths from heart disease 165.80 256
Unmet dental needs 6.93 231
Environmental Quality 47.17 114
Satisfaction with air quality* 247
Air pollution-pm10 32.77 255
Air pollution-pm2.5 20.48 230
Air pollution-ozone 114.18 140
Pollution, grime or other environmental
problems
8.94 44
Protected land (Natura 2000) 56.52 1
Personal Rights 14.02 272
Trust in the political system 10.99 272
Trust in the legal system 7.95 254
Trust in the police 15.32 270
Quality and accountability of government services -1.77 256
Personal Freedom and Choice 42.63 269
Freedom over life choices* 250
Teenage pregnancy 4.59 269
Young people not in education, employment
or training
24.90 252
Corruption -0.83 215
Tolerance and Inclusion 55.99 221
Impartiality of government services -1.22 242
Tolerance for immigrants* 256
Tolerance for minorities* 212
Attitudes toward people with disabilities 6.40 231
Tolerance for homosexuals* 235
Gender gap -4.10 16
Community safety net* 238
Access to Advanced Education 37.90 250
Tertiary education attainment 19.63 203
Tertiary enrolment 0.03 161
Lifelong learning 1.13 261
Yuzhen tsentralen
Strengths and weaknesses are relative to 15 regions of similar GDP per capita: North Central Bulgaria; Northeast Romania; North West Bulgaria; North East Bulgaria; Southwest Oltenia; South East Bulgaria;
Southeast Romania; Northern Hungary; South Muntenia; Northern Great Plain; Lublin Province; Podkarpacia; Northwest Romania; Southern Great Plain; Southern Transdanubia
*Raw data cannot be shown for Gallup indicators
Score/value
Score/value Score/value Score/value
Rank
Rank Rank Rank
Underperforming OverperformingLess than one point under neutral Less than one point over neutralNeutral
Bulgaria
EU Regional Social Progress Index 58.98 206/272
GDP PPP per capita (2011) €23,600 123/272
Basic Human Needs 69.41 213 Foundations of Wellbeing 52.50 240 Opportunity 55.70 181
Nutrition and Basic Medical Care 85.37 100
Mortality rate before age 65 0.09 4
Infant mortality 3.30 108
Unmet medical needs 4.10 213
Insufficient food 6.17 65
Water and Sanitation 63.11 255
Satisfaction with water quality* 229
Lack of toilet in dwelling 1.05 177
Uncollected sewage 38.33 266
Sewage treatment 39.35 181
Shelter 55.18 202
Burdensome cost of housing 73.87 271
Satisfaction with housing 27.82 171
Overcrowding 2.67 27
Lack of adequate heating 29.26 257
Personal Safety 75.93 174
Homicide rate 1.34 189
Safety at night* n/a
Traffic deaths 64.84 166
Access to Basic Knowledge 58.15 234
Secondary enrolment rate n/a 271
Lower secondary completion only 22.97 136
Early school leaving 10.60 112
Access to Information
and Communications
53.00 224
Internet at home 65.00 228
Broadband at home 64.00 214
Online interaction with public authorities 30.00 198
Health and Wellness 71.86 156
Life expectancy 81.15 112
General health status 76.47 29
Premature deaths from cancer 53.20 2
Premature deaths from heart disease 45.20 155
Unmet dental needs 7.63 234
Environmental Quality 31.36 255
Satisfaction with air quality* 226
Air pollution-pm10 33.77 256
Air pollution-pm2.5 21.62 241
Air pollution-ozone 115.58 154
Pollution, grime or other environmental
problems
16.79 197
Protected land (Natura 2000) 21.26 103
Personal Rights 31.62 229
Trust in the political system 23.29 230
Trust in the legal system 13.06 212
Trust in the police 39.20 254
Quality and accountability of government services 0.06 168
Personal Freedom and Choice 67.31 181
Freedom over life choices* 203
Teenage pregnancy 0.59 53
Young people not in education, employment
or training
16.43 207
Corruption 0.24 146
Tolerance and Inclusion 59.61 202
Impartiality of government services -0.23 172
Tolerance for immigrants* 211
Tolerance for minorities* 182
Attitudes toward people with disabilities 7.20 190
Tolerance for homosexuals* 218
Gender gap -10.90 177
Community safety net* 258
Access to Advanced Education 68.97 104
Tertiary education attainment 38.77 28
Tertiary enrolment 0.04 83
Lifelong learning 7.27 166
Kýpros
Strengths and weaknesses are relative to 15 regions of similar GDP per capita: East Anglia; Castile and León; Cantabria; Pays de la Loire; Limburg (BE); Leicestershire, Rutland and Northamptonshire; West
Yorkshire; Midi-Pyrénées; Aquitaine; Trier; South Aegean; Greater Manchester; Drenthe; Upper Normandy; Flevoland
*Raw data cannot be shown for Gallup indicators
Score/value
Score/value Score/value Score/value
Rank
Rank Rank Rank
Underperforming OverperformingLess than one point under neutral Less than one point over neutralNeutral
Cyprus
EU Regional Social Progress Index 65.85 159/272
GDP PPP per capita (2011) €42,900 9/272
Basic Human Needs 73.86 188 Foundations of Wellbeing 60.29 172 Opportunity 63.77 127
Nutrition and Basic Medical Care 86.41 74
Mortality rate before age 65 0.14 180
Infant mortality 1.75 5
Unmet medical needs 1.53 97
Insufficient food 8.28 147
Water and Sanitation 72.38 222
Satisfaction with water quality* 122
Lack of toilet in dwelling 0.95 169
Uncollected sewage 0.00 1
Sewage treatment 1.01 233
Shelter 63.09 176
Burdensome cost of housing 24.97 84
Satisfaction with housing 21.39 181
Overcrowding 26.43 216
Lack of adequate heating 4.57 52
Personal Safety 74.50 186
Homicide rate 1.46 208
Safety at night* 224
Traffic deaths 30.10 39
Access to Basic Knowledge 94.39 2
Secondary enrolment rate 0.98 37
Lower secondary completion only 3.47 2
Early school leaving 2.63 1
Access to Information
and Communications
66.32 138
Internet at home 80.00 134
Broadband at home 79.00 104
Online interaction with public authorities 40.00 150
Health and Wellness 65.65 209
Life expectancy 79.70 202
General health status 65.26 177
Premature deaths from cancer 91.20 192
Premature deaths from heart disease 54.10 196
Unmet dental needs 2.10 75
Environmental Quality 25.98 264
Satisfaction with air quality* 248
Air pollution-pm10 25.29 204
Air pollution-pm2.5 19.00 216
Air pollution-ozone 113.74 137
Pollution, grime or other environmental
problems
22.41 228
Protected land (Natura 2000) 1.87 256
Personal Rights 34.33 208
Trust in the political system 23.49 229
Trust in the legal system 26.33 151
Trust in the police 45.24 240
Quality and accountability of government services -0.44 192
Personal Freedom and Choice 72.57 126
Freedom over life choices* 166
Teenage pregnancy 0.64 66
Young people not in education, employment
or training
3.47 1
Corruption -1.22 238
Tolerance and Inclusion 62.12 191
Impartiality of government services -0.13 164
Tolerance for immigrants* 169
Tolerance for minorities* 217
Attitudes toward people with disabilities 5.40 263
Tolerance for homosexuals* 101
Gender gap -16.47 237
Community safety net* 176
Access to Advanced Education 93.77 18
Tertiary education attainment 37.80 30
Tertiary enrolment 0.13 1
Lifelong learning 12.17 85
Praha
Strengths and weaknesses are relative to 15 regions of similar GDP per capita: Stockholm; Groningen; Île de France; Bratislava Region; Vienna; Upper Bavaria; North Eastern Scotland; Darmstadt; Utrecht;
Helsinki; Bremen; Capital Region of Denmark; North Holland; Bolzano; Salzburg
*Raw data cannot be shown for Gallup indicators
Score/value
Score/value Score/value Score/value
Rank
Rank Rank Rank
Underperforming OverperformingLess than one point under neutral Less than one point over neutralNeutral
Czech Republic
EU Regional Social Progress Index 59.09 204/272
GDP PPP per capita (2011) €18,200 202/272
Basic Human Needs 73.65 193 Foundations of Wellbeing 60.04 175 Opportunity 45.29 246
Nutrition and Basic Medical Care 83.73 142
Mortality rate before age 65 0.16 213
Infant mortality 2.15 17
Unmet medical needs 0.74 39
Insufficient food 11.57 206
Water and Sanitation 71.79 226
Satisfaction with water quality* 218
Lack of toilet in dwelling 0.66 157
Uncollected sewage 0.00 1
Sewage treatment 14.38 212
Shelter 66.56 163
Burdensome cost of housing 26.59 86
Satisfaction with housing 21.74 179
Overcrowding 15.13 180
Lack of adequate heating 6.27 103
Personal Safety 73.03 196
Homicide rate 1.12 144
Safety at night* 182
Traffic deaths 79.26 209
Access to Basic Knowledge 92.17 8
Secondary enrolment rate 0.98 37
Lower secondary completion only 6.70 10
Early school leaving 3.87 6
Access to Information
and Communications
62.32 156
Internet at home 79.00 137
Broadband at home 76.00 135
Online interaction with public authorities 32.00 186
Health and Wellness 62.73 218
Life expectancy 77.95 222
General health status 61.71 228
Premature deaths from cancer 103.50 222
Premature deaths from heart disease 69.10 211
Unmet dental needs 1.50 30
Environmental Quality 31.11 256
Satisfaction with air quality* 230
Air pollution-pm10 22.10 165
Air pollution-pm2.5 17.06 187
Air pollution-ozone 115.42 152
Pollution, grime or other environmental
problems
21.68 226
Protected land (Natura 2000) 6.58 222
Personal Rights 26.46 258
Trust in the political system 18.15 248
Trust in the legal system 18.42 178
Trust in the police 27.22 266
Quality and accountability of government services -0.45 195
Personal Freedom and Choice 66.86 184
Freedom over life choices* 206
Teenage pregnancy 0.99 141
Young people not in education, employment
or training
7.23 48
Corruption -0.95 223
Tolerance and Inclusion 48.98 263
Impartiality of government services -0.25 174
Tolerance for immigrants* 255
Tolerance for minorities* 264
Attitudes toward people with disabilities 5.40 263
Tolerance for homosexuals* 211
Gender gap -16.60 239
Community safety net* 243
Access to Advanced Education 43.56 232
Tertiary education attainment 18.47 211
Tertiary enrolment 0.00 271
Lifelong learning 10.40 105
Strední Cechy
Strengths and weaknesses are relative to 15 regions of similar GDP per capita: Alentejo; Basilicata; Southeast; Guadeloupe; Lincolnshire; Azores; Tees Valley and Durham; Eastern Slovenia; Southwest; Lower
Silesia; Peloponnese; West Slovakia; Andalusia; North Aegean; Crete
*Raw data cannot be shown for Gallup indicators
Score/value
Score/value Score/value Score/value
Rank
Rank Rank Rank
Underperforming OverperformingLess than one point under neutral Less than one point over neutralNeutral
Czech Republic
EU Regional Social Progress Index 63.20 178/272
GDP PPP per capita (2011) €17,600 212/272
Basic Human Needs 73.90 187 Foundations of Wellbeing 63.62 143 Opportunity 52.94 196
Nutrition and Basic Medical Care 82.62 166
Mortality rate before age 65 0.15 202
Infant mortality 2.50 32
Unmet medical needs 2.17 151
Insufficient food 9.65 190
Water and Sanitation 76.85 195
Satisfaction with water quality* 125
Lack of toilet in dwelling 0.33 76
Uncollected sewage 0.00 1
Sewage treatment 18.49 204
Shelter 63.79 173
Burdensome cost of housing 24.49 83
Satisfaction with housing 17.14 202
Overcrowding 20.18 195
Lack of adequate heating 7.31 136
Personal Safety 72.99 197
Homicide rate 0.69 47
Safety at night* 165
Traffic deaths 101.55 248
Access to Basic Knowledge 88.98 20
Secondary enrolment rate 0.97 58
Lower secondary completion only 6.73 11
Early school leaving 5.53 20
Access to Information
and Communications
54.99 207
Internet at home 71.00 198
Broadband at home 68.00 187
Online interaction with public authorities 26.00 215
Health and Wellness 65.67 208
Life expectancy 78.20 217
General health status 63.21 225
Premature deaths from cancer 100.00 210
Premature deaths from heart disease 71.30 212
Unmet dental needs 1.33 18
Environmental Quality 48.35 106
Satisfaction with air quality* 153
Air pollution-pm10 17.85 78
Air pollution-pm2.5 14.14 130
Air pollution-ozone 113.46 134
Pollution, grime or other environmental
problems
13.19 169
Protected land (Natura 2000) 23.63 90
Personal Rights 31.84 228
Trust in the political system 25.14 223
Trust in the legal system 25.14 156
Trust in the police 32.92 259
Quality and accountability of government services -0.33 187
Personal Freedom and Choice 68.17 167
Freedom over life choices* 194
Teenage pregnancy 1.22 165
Young people not in education, employment
or training
7.87 61
Corruption -0.79 209
Tolerance and Inclusion 53.98 231
Impartiality of government services -0.13 164
Tolerance for immigrants* 233
Tolerance for minorities* 241
Attitudes toward people with disabilities 5.40 263
Tolerance for homosexuals* 196
Gender gap -17.17 242
Community safety net* 217
Access to Advanced Education 61.75 139
Tertiary education attainment 16.70 231
Tertiary enrolment 0.03 123
Lifelong learning 11.37 91
Jihozápad
Strengths and weaknesses are relative to 15 regions of similar GDP per capita: Eastern Slovenia; Lower Silesia; Peloponnese; West Slovakia; North Aegean; Cornwall and Isles of Scilly; Extremadura; Moravia-
Silesia; Réunion; Basilicata; Alentejo; Central Macedonia; Central Bohemian Region; Silesia; Apulia
*Raw data cannot be shown for Gallup indicators
Score/value
Score/value Score/value Score/value
Rank
Rank Rank Rank
Underperforming OverperformingLess than one point under neutral Less than one point over neutralNeutral
Czech Republic
EU Regional Social Progress Index 56.52 232/272
GDP PPP per capita (2011) €15,700 230/272
Basic Human Needs 69.60 212 Foundations of Wellbeing 56.04 216 Opportunity 45.22 248
Nutrition and Basic Medical Care 73.07 222
Mortality rate before age 65 0.20 229
Infant mortality 4.40 211
Unmet medical needs 1.67 99
Insufficient food 18.15 240
Water and Sanitation 73.10 218
Satisfaction with water quality* 129
Lack of toilet in dwelling 0.23 54
Uncollected sewage 0.00 1
Sewage treatment 5.20 230
Shelter 61.70 180
Burdensome cost of housing 32.03 158
Satisfaction with housing 18.34 197
Overcrowding 19.84 192
Lack of adequate heating 9.85 184
Personal Safety 70.86 221
Homicide rate 1.27 173
Safety at night* 223
Traffic deaths 63.67 158
Access to Basic Knowledge 76.90 112
Secondary enrolment rate 0.93 156
Lower secondary completion only 13.67 53
Early school leaving 10.87 123
Access to Information
and Communications
52.32 231
Internet at home 67.00 213
Broadband at home 62.00 229
Online interaction with public authorities 28.00 207
Health and Wellness 54.19 243
Life expectancy 76.40 242
General health status 59.42 235
Premature deaths from cancer 117.30 243
Premature deaths from heart disease 99.60 227
Unmet dental needs 2.73 121
Environmental Quality 43.29 157
Satisfaction with air quality* 251
Air pollution-pm10 21.40 146
Air pollution-pm2.5 16.05 171
Air pollution-ozone 116.09 169
Pollution, grime or other environmental
problems
17.65 206
Protected land (Natura 2000) 25.86 79
Personal Rights 29.22 250
Trust in the political system 21.62 236
Trust in the legal system 23.46 157
Trust in the police 38.51 256
Quality and accountability of government services -0.98 233
Personal Freedom and Choice 59.18 221
Freedom over life choices* 168
Teenage pregnancy 2.14 234
Young people not in education, employment
or training
15.73 201
Corruption -1.44 252
Tolerance and Inclusion 53.34 237
Impartiality of government services -0.67 212
Tolerance for immigrants* 216
Tolerance for minorities* 235
Attitudes toward people with disabilities 5.40 263
Tolerance for homosexuals* 199
Gender gap -18.23 246
Community safety net* 171
Access to Advanced Education 42.21 238
Tertiary education attainment 11.43 267
Tertiary enrolment 0.02 256
Lifelong learning 9.03 135
Severozápad
Strengths and weaknesses are relative to 15 regions of similar GDP per capita: Campania; Western Greece; Northern Portugal; Western Transdanubia; Eastern Macedonia and Thrace; Central Moravia;
Central Portugal; Estonia; Thessaly; West Wales and The Valleys; Calabria; Lithuania; Greater Poland; Northeast; Sicily
*Raw data cannot be shown for Gallup indicators
Score/value
Score/value Score/value Score/value
Rank
Rank Rank Rank
Underperforming OverperformingLess than one point under neutral Less than one point over neutralNeutral
Czech Republic
EU Regional Social Progress Index 61.54 186/272
GDP PPP per capita (2011) €16,700 219/272
Basic Human Needs 73.76 189 Foundations of Wellbeing 59.91 177 Opportunity 51.92 206
Nutrition and Basic Medical Care 83.00 157
Mortality rate before age 65 0.16 213
Infant mortality 3.00 76
Unmet medical needs 0.54 30
Insufficient food 10.94 199
Water and Sanitation 73.57 217
Satisfaction with water quality* 123
Lack of toilet in dwelling 1.15 188
Uncollected sewage 0.00 1
Sewage treatment 6.55 228
Shelter 64.25 172
Burdensome cost of housing 30.49 119
Satisfaction with housing 19.31 196
Overcrowding 17.66 188
Lack of adequate heating 5.43 97
Personal Safety 74.82 183
Homicide rate 0.71 51
Safety at night* 176
Traffic deaths 80.43 216
Access to Basic Knowledge 84.69 37
Secondary enrolment rate 0.95 115
Lower secondary completion only 7.90 17
Early school leaving 6.30 26
Access to Information
and Communications
56.99 184
Internet at home 73.00 168
Broadband at home 67.00 190
Online interaction with public authorities 31.00 195
Health and Wellness 65.92 206
Life expectancy 78.25 216
General health status 58.83 239
Premature deaths from cancer 96.30 207
Premature deaths from heart disease 71.70 213
Unmet dental needs 1.30 17
Environmental Quality 37.09 227
Satisfaction with air quality* 126
Air pollution-pm10 22.15 166
Air pollution-pm2.5 17.27 189
Air pollution-ozone 120.32 206
Pollution, grime or other environmental
problems
11.75 149
Protected land (Natura 2000) 14.46 162
Personal Rights 32.94 214
Trust in the political system 25.18 222
Trust in the legal system 22.32 165
Trust in the police 41.90 249
Quality and accountability of government services -0.44 192
Personal Freedom and Choice 69.81 153
Freedom over life choices* 164
Teenage pregnancy 1.07 151
Young people not in education, employment
or training
8.63 75
Corruption -0.80 211
Tolerance and Inclusion 50.86 253
Impartiality of government services -0.15 166
Tolerance for immigrants* 260
Tolerance for minorities* 257
Attitudes toward people with disabilities 5.40 263
Tolerance for homosexuals* 219
Gender gap -15.87 233
Community safety net* 161
Access to Advanced Education 57.70 163
Tertiary education attainment 15.53 246
Tertiary enrolment 0.02 223
Lifelong learning 12.57 78
Severovýchod
Strengths and weaknesses are relative to 15 regions of similar GDP per capita: Sicily; Greater Poland; Calabria; West Wales and The Valleys; Apulia; Estonia; Central Portugal; Central Moravia; Western
Transdanubia; Silesia; Central Macedonia; Western Greece; Campania; Réunion; Northwest
*Raw data cannot be shown for Gallup indicators
Score/value
Score/value Score/value Score/value
Rank
Rank Rank Rank
Underperforming OverperformingLess than one point under neutral Less than one point over neutralNeutral
Czech Republic
EU Regional Social Progress Index 63.55 176/272
GDP PPP per capita (2011) €18,400 200/272
Basic Human Needs 74.43 185 Foundations of Wellbeing 59.96 176 Opportunity 56.92 173
Nutrition and Basic Medical Care 83.17 154
Mortality rate before age 65 0.15 202
Infant mortality 2.80 57
Unmet medical needs 0.60 33
Insufficient food 11.63 207
Water and Sanitation 72.62 220
Satisfaction with water quality* 161
Lack of toilet in dwelling 1.10 178
Uncollected sewage 0.00 1
Sewage treatment 9.44 224
Shelter 64.47 171
Burdensome cost of housing 25.09 85
Satisfaction with housing 20.37 192
Overcrowding 21.09 196
Lack of adequate heating 5.88 100
Personal Safety 78.13 157
Homicide rate 1.00 123
Safety at night* 137
Traffic deaths 64.96 167
Access to Basic Knowledge 92.48 5
Secondary enrolment rate 0.98 37
Lower secondary completion only 5.93 7
Early school leaving 3.67 4
Access to Information
and Communications
56.99 184
Internet at home 73.00 168
Broadband at home 71.00 161
Online interaction with public authorities 27.00 212
Health and Wellness 66.13 205
Life expectancy 78.80 214
General health status 58.23 240
Premature deaths from cancer 92.10 198
Premature deaths from heart disease 66.70 210
Unmet dental needs 1.27 16
Environmental Quality 32.22 250
Satisfaction with air quality* 177
Air pollution-pm10 22.84 175
Air pollution-pm2.5 17.89 204
Air pollution-ozone 120.92 206
Pollution, grime or other environmental
problems
13.50 173
Protected land (Natura 2000) 7.85 216
Personal Rights 35.50 196
Trust in the political system 26.36 214
Trust in the legal system 27.01 148
Trust in the police 44.88 241
Quality and accountability of government services -0.35 188
Personal Freedom and Choice 69.24 158
Freedom over life choices* 192
Teenage pregnancy 0.77 100
Young people not in education, employment
or training
8.07 64
Corruption -0.80 211
Tolerance and Inclusion 53.23 240
Impartiality of government services 0.09 153
Tolerance for immigrants* 242
Tolerance for minorities* 248
Attitudes toward people with disabilities 5.40 263
Tolerance for homosexuals* 203
Gender gap -16.87 241
Community safety net* 198
Access to Advanced Education 73.98 91
Tertiary education attainment 20.87 194
Tertiary enrolment 0.06 1
Lifelong learning 9.20 128
Jihovýchod
Strengths and weaknesses are relative to 15 regions of similar GDP per capita: Guadeloupe; Lincolnshire; Azores; Tees Valley and Durham; Central Bohemian Region; Alentejo; Basilicata; Andalusia; Crete;
Martinique; South West Bulgaria; Eastern Slovenia; Southwest; Lower Silesia; Peloponnese
*Raw data cannot be shown for Gallup indicators
Score/value
Score/value Score/value Score/value
Rank
Rank Rank Rank
Underperforming OverperformingLess than one point under neutral Less than one point over neutralNeutral
Czech Republic
EU Regional Social Progress Index 61.41 187/272
GDP PPP per capita (2011) €16,500 222/272
Basic Human Needs 74.29 186 Foundations of Wellbeing 60.32 171 Opportunity 50.74 216
Nutrition and Basic Medical Care 81.71 185
Mortality rate before age 65 0.17 218
Infant mortality 2.70 50
Unmet medical needs 0.72 38
Insufficient food 11.40 205
Water and Sanitation 76.45 201
Satisfaction with water quality* 120
Lack of toilet in dwelling 1.33 192
Uncollected sewage 0.00 1
Sewage treatment 17.84 206
Shelter 63.07 177
Burdensome cost of housing 32.91 159
Satisfaction with housing 19.81 194
Overcrowding 19.17 190
Lack of adequate heating 5.98 101
Personal Safety 76.59 168
Homicide rate 1.14 155
Safety at night* 157
Traffic deaths 66.26 174
Access to Basic Knowledge 93.23 4
Secondary enrolment rate 1.00 1
Lower secondary completion only 7.77 15
Early school leaving 4.30 8
Access to Information
and Communications
52.99 225
Internet at home 68.00 209
Broadband at home 66.00 202
Online interaction with public authorities 25.00 217
Health and Wellness 63.95 215
Life expectancy 78.05 220
General health status 55.25 256
Premature deaths from cancer 95.10 204
Premature deaths from heart disease 79.20 215
Unmet dental needs 1.37 19
Environmental Quality 37.62 222
Satisfaction with air quality* 158
Air pollution-pm10 27.38 231
Air pollution-pm2.5 21.82 245
Air pollution-ozone 120.42 206
Pollution, grime or other environmental
problems
12.73 164
Protected land (Natura 2000) 28.84 56
Personal Rights 30.94 239
Trust in the political system 21.21 237
Trust in the legal system 19.94 173
Trust in the police 40.42 253
Quality and accountability of government services -0.44 192
Personal Freedom and Choice 68.49 164
Freedom over life choices* 189
Teenage pregnancy 0.82 107
Young people not in education, employment
or training
8.73 76
Corruption -0.89 217
Tolerance and Inclusion 52.75 244
Impartiality of government services -0.23 172
Tolerance for immigrants* 248
Tolerance for minorities* 254
Attitudes toward people with disabilities 5.40 263
Tolerance for homosexuals* 204
Gender gap -15.73 232
Community safety net* 138
Access to Advanced Education 54.63 183
Tertiary education attainment 15.93 242
Tertiary enrolment 0.03 176
Lifelong learning 9.00 136
Strední Morava
Strengths and weaknesses are relative to 15 regions of similar GDP per capita: Central Portugal; Estonia; West Wales and The Valleys; Western Transdanubia; Calabria; Greater Poland; Western Greece;
Campania; Northeast; Northwest; Sicily; Apulia; Northern Portugal; Eastern Macedonia and Thrace; Silesia
*Raw data cannot be shown for Gallup indicators
Score/value
Score/value Score/value Score/value
Rank
Rank Rank Rank
Underperforming OverperformingLess than one point under neutral Less than one point over neutralNeutral
Czech Republic
EU Regional Social Progress Index 58.33 210/272
GDP PPP per capita (2011) €17,800 208/272
Basic Human Needs 68.83 217 Foundations of Wellbeing 53.70 235 Opportunity 53.12 195
Nutrition and Basic Medical Care 78.27 207
Mortality rate before age 65 0.20 229
Infant mortality 2.35 24
Unmet medical needs 0.80 42
Insufficient food 15.98 233
Water and Sanitation 70.06 234
Satisfaction with water quality* 189
Lack of toilet in dwelling 0.74 160
Uncollected sewage 0.00 1
Sewage treatment 0.49 235
Shelter 57.77 196
Burdensome cost of housing 33.97 162
Satisfaction with housing 16.04 220
Overcrowding 29.60 224
Lack of adequate heating 6.78 132
Personal Safety 70.03 228
Homicide rate 1.15 158
Safety at night* 231
Traffic deaths 63.38 156
Access to Basic Knowledge 90.23 16
Secondary enrolment rate 0.99 18
Lower secondary completion only 8.67 19
Early school leaving 5.60 21
Access to Information
and Communications
52.32 231
Internet at home 68.00 209
Broadband at home 64.00 214
Online interaction with public authorities 25.00 217
Health and Wellness 54.00 245
Life expectancy 76.75 234
General health status 56.90 255
Premature deaths from cancer 105.20 224
Premature deaths from heart disease 94.30 223
Unmet dental needs 1.77 33
Environmental Quality 27.35 262
Satisfaction with air quality* 263
Air pollution-pm10 34.90 258
Air pollution-pm2.5 28.16 258
Air pollution-ozone 117.74 190
Pollution, grime or other environmental
problems
19.52 211
Protected land (Natura 2000) 24.66 83
Personal Rights 35.85 195
Trust in the political system 27.58 210
Trust in the legal system 26.73 149
Trust in the police 44.87 242
Quality and accountability of government services -0.32 186
Personal Freedom and Choice 61.93 208
Freedom over life choices* 207
Teenage pregnancy 1.42 187
Young people not in education, employment
or training
10.27 96
Corruption -1.36 245
Tolerance and Inclusion 52.99 243
Impartiality of government services -0.47 194
Tolerance for immigrants* 240
Tolerance for minorities* 245
Attitudes toward people with disabilities 5.40 263
Tolerance for homosexuals* 200
Gender gap -14.70 222
Community safety net* 236
Access to Advanced Education 64.28 123
Tertiary education attainment 16.40 236
Tertiary enrolment 0.04 80
Lifelong learning 11.23 93
Moravskoslezsko
Strengths and weaknesses are relative to 15 regions of similar GDP per capita: Extremadura; Cornwall and Isles of Scilly; Réunion; North Aegean; Central Macedonia; Silesia; West Slovakia; Peloponnese;
Lower Silesia; Apulia; Southwest; Eastern Slovenia; Sicily; Northeast; Greater Poland
*Raw data cannot be shown for Gallup indicators
Score/value
Score/value Score/value Score/value
Rank
Rank Rank Rank
Underperforming OverperformingLess than one point under neutral Less than one point over neutralNeutral
Czech Republic
EU Regional Social Progress Index 73.60 53/272
GDP PPP per capita (2011) €38,000 18/272
Basic Human Needs 85.85 39 Foundations of Wellbeing 66.84 72 Opportunity 68.83 80
Nutrition and Basic Medical Care 86.34 76
Mortality rate before age 65 0.10 17
Infant mortality 3.35 115
Unmet medical needs 1.77 102
Insufficient food 8.44 148
Water and Sanitation 97.61 50
Satisfaction with water quality* 76
Lack of toilet in dwelling 0.64 118
Uncollected sewage 0.00 1
Sewage treatment 97.42 60
Shelter 74.86 107
Burdensome cost of housing 19.06 41
Satisfaction with housing 33.54 124
Overcrowding 6.69 45
Lack of adequate heating 5.06 57
Personal Safety 85.37 35
Homicide rate 1.10 139
Safety at night* 24
Traffic deaths 37.65 61
Access to Basic Knowledge 83.91 47
Secondary enrolment rate 0.97 58
Lower secondary completion only 14.53 63
Early school leaving 9.10 80
Access to Information
and Communications
72.50 83
Internet at home 87.00 74
Broadband at home 83.00 81
Online interaction with public authorities 47.00 109
Health and Wellness 76.89 41
Life expectancy 82.30 44
General health status 65.05 178
Premature deaths from cancer 67.20 34
Premature deaths from heart disease 35.50 87
Unmet dental needs 2.00 37
Environmental Quality 39.17 204
Satisfaction with air quality* 107
Air pollution-pm10 17.85 78
Air pollution-pm2.5 13.10 95
Air pollution-ozone 118.96 197
Pollution, grime or other environmental
problems
22.65 229
Protected land (Natura 2000) 14.87 154
Personal Rights 55.03 41
Trust in the political system 49.52 86
Trust in the legal system 43.62 38
Trust in the police 65.22 106
Quality and accountability of government services 0.70 55
Personal Freedom and Choice 84.43 26
Freedom over life choices* 53
Teenage pregnancy 0.42 15
Young people not in education, employment
or training
5.37 20
Corruption 1.04 36
Tolerance and Inclusion 74.80 103
Impartiality of government services 0.84 82
Tolerance for immigrants* 29
Tolerance for minorities* 65
Attitudes toward people with disabilities 7.60 128
Tolerance for homosexuals* 152
Gender gap -10.33 141
Community safety net* 91
Access to Advanced Education 62.90 132
Tertiary education attainment 31.70 84
Tertiary enrolment 0.03 142
Lifelong learning 8.97 137
Stuttgart
Strengths and weaknesses are relative to 15 regions of similar GDP per capita: Southern and Eastern; Berkshire, Buckinghamshire and Oxfordshire; Åland; Salzburg; Bolzano; North Holland; Antwerp;
Vorarlberg; Düsseldorf; Capital Region of Denmark; Lombardy; Aosta Valley; Bremen; Karlsruhe; Tyrol
*Raw data cannot be shown for Gallup indicators
Score/value
Score/value Score/value Score/value
Rank
Rank Rank Rank
Underperforming OverperformingLess than one point under neutral Less than one point over neutralNeutral
Germany
European Union Regional Social Progress Index Scorecards

More Related Content

More from socprog

Do you embrace the SDGs? Michael Green at Luxembourg SE
Do you embrace the SDGs? Michael Green at Luxembourg SEDo you embrace the SDGs? Michael Green at Luxembourg SE
Do you embrace the SDGs? Michael Green at Luxembourg SEsocprog
 
Localizing the SDGs at the municipality level in Iceland
Localizing the SDGs at the municipality level in IcelandLocalizing the SDGs at the municipality level in Iceland
Localizing the SDGs at the municipality level in Icelandsocprog
 
Localization and implementation of the SDGs using the Social Progress Index
Localization and implementation of the SDGs using the Social Progress IndexLocalization and implementation of the SDGs using the Social Progress Index
Localization and implementation of the SDGs using the Social Progress Indexsocprog
 
How to build a framework to track SDG progress at a national level
How to build a framework to track SDG progress at a national levelHow to build a framework to track SDG progress at a national level
How to build a framework to track SDG progress at a national levelsocprog
 
Advancing the SDGs at atate and district level in India
Advancing the SDGs at atate and district level in IndiaAdvancing the SDGs at atate and district level in India
Advancing the SDGs at atate and district level in Indiasocprog
 
Advancing the SDGs for youth
Advancing the SDGs for youthAdvancing the SDGs for youth
Advancing the SDGs for youthsocprog
 
What does the Social Progress Index tell us?
What does the Social Progress Index tell us? What does the Social Progress Index tell us?
What does the Social Progress Index tell us? socprog
 
Youth Progress Index Presentation to the European Parliament
Youth Progress Index Presentation to the European ParliamentYouth Progress Index Presentation to the European Parliament
Youth Progress Index Presentation to the European Parliamentsocprog
 
Institute and Faculty of Actuaries Spring Lecture on Social Progress Index
Institute and Faculty of Actuaries Spring Lecture on Social Progress IndexInstitute and Faculty of Actuaries Spring Lecture on Social Progress Index
Institute and Faculty of Actuaries Spring Lecture on Social Progress Indexsocprog
 
Findings from the Social Progress Index: US States
Findings from the Social Progress Index: US StatesFindings from the Social Progress Index: US States
Findings from the Social Progress Index: US Statessocprog
 
Symposium Laudato Si Presentation
Symposium Laudato Si PresentationSymposium Laudato Si Presentation
Symposium Laudato Si Presentationsocprog
 
UNGA Week Skoll Foundation | TED We The Future Event
UNGA Week Skoll Foundation | TED We The Future EventUNGA Week Skoll Foundation | TED We The Future Event
UNGA Week Skoll Foundation | TED We The Future Eventsocprog
 
Michael Green's Presentation at Ireland's National Economic Dialogue on June ...
Michael Green's Presentation at Ireland's National Economic Dialogue on June ...Michael Green's Presentation at Ireland's National Economic Dialogue on June ...
Michael Green's Presentation at Ireland's National Economic Dialogue on June ...socprog
 
2017 Indice de Progreso Social Informe Metodologico
2017 Indice de Progreso Social Informe Metodologico2017 Indice de Progreso Social Informe Metodologico
2017 Indice de Progreso Social Informe Metodologicosocprog
 
2017 Indice de Progreso Social
2017 Indice de Progreso Social2017 Indice de Progreso Social
2017 Indice de Progreso Socialsocprog
 
2017 Social Progress Index Findings Presentation
2017 Social Progress Index Findings Presentation2017 Social Progress Index Findings Presentation
2017 Social Progress Index Findings Presentationsocprog
 
Discussion paper: Social Progress Index for States of India
Discussion paper: Social Progress Index for States of IndiaDiscussion paper: Social Progress Index for States of India
Discussion paper: Social Progress Index for States of Indiasocprog
 
Professor Michael E Porter on Competitiveness of Nations and Regions: The New...
Professor Michael E Porter on Competitiveness of Nations and Regions: The New...Professor Michael E Porter on Competitiveness of Nations and Regions: The New...
Professor Michael E Porter on Competitiveness of Nations and Regions: The New...socprog
 
Michael Green on the Social Progress Index at Business in the Community Ireland
Michael Green on the Social Progress Index at Business in the Community IrelandMichael Green on the Social Progress Index at Business in the Community Ireland
Michael Green on the Social Progress Index at Business in the Community Irelandsocprog
 
Can We Achieve the SDGs?
Can We Achieve the SDGs? Can We Achieve the SDGs?
Can We Achieve the SDGs? socprog
 

More from socprog (20)

Do you embrace the SDGs? Michael Green at Luxembourg SE
Do you embrace the SDGs? Michael Green at Luxembourg SEDo you embrace the SDGs? Michael Green at Luxembourg SE
Do you embrace the SDGs? Michael Green at Luxembourg SE
 
Localizing the SDGs at the municipality level in Iceland
Localizing the SDGs at the municipality level in IcelandLocalizing the SDGs at the municipality level in Iceland
Localizing the SDGs at the municipality level in Iceland
 
Localization and implementation of the SDGs using the Social Progress Index
Localization and implementation of the SDGs using the Social Progress IndexLocalization and implementation of the SDGs using the Social Progress Index
Localization and implementation of the SDGs using the Social Progress Index
 
How to build a framework to track SDG progress at a national level
How to build a framework to track SDG progress at a national levelHow to build a framework to track SDG progress at a national level
How to build a framework to track SDG progress at a national level
 
Advancing the SDGs at atate and district level in India
Advancing the SDGs at atate and district level in IndiaAdvancing the SDGs at atate and district level in India
Advancing the SDGs at atate and district level in India
 
Advancing the SDGs for youth
Advancing the SDGs for youthAdvancing the SDGs for youth
Advancing the SDGs for youth
 
What does the Social Progress Index tell us?
What does the Social Progress Index tell us? What does the Social Progress Index tell us?
What does the Social Progress Index tell us?
 
Youth Progress Index Presentation to the European Parliament
Youth Progress Index Presentation to the European ParliamentYouth Progress Index Presentation to the European Parliament
Youth Progress Index Presentation to the European Parliament
 
Institute and Faculty of Actuaries Spring Lecture on Social Progress Index
Institute and Faculty of Actuaries Spring Lecture on Social Progress IndexInstitute and Faculty of Actuaries Spring Lecture on Social Progress Index
Institute and Faculty of Actuaries Spring Lecture on Social Progress Index
 
Findings from the Social Progress Index: US States
Findings from the Social Progress Index: US StatesFindings from the Social Progress Index: US States
Findings from the Social Progress Index: US States
 
Symposium Laudato Si Presentation
Symposium Laudato Si PresentationSymposium Laudato Si Presentation
Symposium Laudato Si Presentation
 
UNGA Week Skoll Foundation | TED We The Future Event
UNGA Week Skoll Foundation | TED We The Future EventUNGA Week Skoll Foundation | TED We The Future Event
UNGA Week Skoll Foundation | TED We The Future Event
 
Michael Green's Presentation at Ireland's National Economic Dialogue on June ...
Michael Green's Presentation at Ireland's National Economic Dialogue on June ...Michael Green's Presentation at Ireland's National Economic Dialogue on June ...
Michael Green's Presentation at Ireland's National Economic Dialogue on June ...
 
2017 Indice de Progreso Social Informe Metodologico
2017 Indice de Progreso Social Informe Metodologico2017 Indice de Progreso Social Informe Metodologico
2017 Indice de Progreso Social Informe Metodologico
 
2017 Indice de Progreso Social
2017 Indice de Progreso Social2017 Indice de Progreso Social
2017 Indice de Progreso Social
 
2017 Social Progress Index Findings Presentation
2017 Social Progress Index Findings Presentation2017 Social Progress Index Findings Presentation
2017 Social Progress Index Findings Presentation
 
Discussion paper: Social Progress Index for States of India
Discussion paper: Social Progress Index for States of IndiaDiscussion paper: Social Progress Index for States of India
Discussion paper: Social Progress Index for States of India
 
Professor Michael E Porter on Competitiveness of Nations and Regions: The New...
Professor Michael E Porter on Competitiveness of Nations and Regions: The New...Professor Michael E Porter on Competitiveness of Nations and Regions: The New...
Professor Michael E Porter on Competitiveness of Nations and Regions: The New...
 
Michael Green on the Social Progress Index at Business in the Community Ireland
Michael Green on the Social Progress Index at Business in the Community IrelandMichael Green on the Social Progress Index at Business in the Community Ireland
Michael Green on the Social Progress Index at Business in the Community Ireland
 
Can We Achieve the SDGs?
Can We Achieve the SDGs? Can We Achieve the SDGs?
Can We Achieve the SDGs?
 

Recently uploaded

Referendum Party 2024 Election Manifesto
Referendum Party 2024 Election ManifestoReferendum Party 2024 Election Manifesto
Referendum Party 2024 Election ManifestoSABC News
 
Manipur-Book-Final-2-compressed.pdfsal'rpk
Manipur-Book-Final-2-compressed.pdfsal'rpkManipur-Book-Final-2-compressed.pdfsal'rpk
Manipur-Book-Final-2-compressed.pdfsal'rpkbhavenpr
 
Top 10 Wealthiest People In The World.pdf
Top 10 Wealthiest People In The World.pdfTop 10 Wealthiest People In The World.pdf
Top 10 Wealthiest People In The World.pdfauroraaudrey4826
 
Rohan Jaitley: Central Gov't Standing Counsel for Justice
Rohan Jaitley: Central Gov't Standing Counsel for JusticeRohan Jaitley: Central Gov't Standing Counsel for Justice
Rohan Jaitley: Central Gov't Standing Counsel for JusticeAbdulGhani778830
 
VIP Girls Available Call or WhatsApp 9711199012
VIP Girls Available Call or WhatsApp 9711199012VIP Girls Available Call or WhatsApp 9711199012
VIP Girls Available Call or WhatsApp 9711199012ankitnayak356677
 
AP Election Survey 2024: TDP-Janasena-BJP Alliance Set To Sweep Victory
AP Election Survey 2024: TDP-Janasena-BJP Alliance Set To Sweep VictoryAP Election Survey 2024: TDP-Janasena-BJP Alliance Set To Sweep Victory
AP Election Survey 2024: TDP-Janasena-BJP Alliance Set To Sweep Victoryanjanibaddipudi1
 
57 Bidens Annihilation Nation Policy.pdf
57 Bidens Annihilation Nation Policy.pdf57 Bidens Annihilation Nation Policy.pdf
57 Bidens Annihilation Nation Policy.pdfGerald Furnkranz
 
IndiaWest: Your Trusted Source for Today's Global News
IndiaWest: Your Trusted Source for Today's Global NewsIndiaWest: Your Trusted Source for Today's Global News
IndiaWest: Your Trusted Source for Today's Global NewsIndiaWest2
 
Brief biography of Julius Robert Oppenheimer
Brief biography of Julius Robert OppenheimerBrief biography of Julius Robert Oppenheimer
Brief biography of Julius Robert OppenheimerOmarCabrera39
 
Global Terrorism and its types and prevention ppt.
Global Terrorism and its types and prevention ppt.Global Terrorism and its types and prevention ppt.
Global Terrorism and its types and prevention ppt.NaveedKhaskheli1
 
Opportunities, challenges, and power of media and information
Opportunities, challenges, and power of media and informationOpportunities, challenges, and power of media and information
Opportunities, challenges, and power of media and informationReyMonsales
 
complaint-ECI-PM-media-1-Chandru.pdfra;;prfk
complaint-ECI-PM-media-1-Chandru.pdfra;;prfkcomplaint-ECI-PM-media-1-Chandru.pdfra;;prfk
complaint-ECI-PM-media-1-Chandru.pdfra;;prfkbhavenpr
 
Quiz for Heritage Indian including all the rounds
Quiz for Heritage Indian including all the roundsQuiz for Heritage Indian including all the rounds
Quiz for Heritage Indian including all the roundsnaxymaxyy
 

Recently uploaded (13)

Referendum Party 2024 Election Manifesto
Referendum Party 2024 Election ManifestoReferendum Party 2024 Election Manifesto
Referendum Party 2024 Election Manifesto
 
Manipur-Book-Final-2-compressed.pdfsal'rpk
Manipur-Book-Final-2-compressed.pdfsal'rpkManipur-Book-Final-2-compressed.pdfsal'rpk
Manipur-Book-Final-2-compressed.pdfsal'rpk
 
Top 10 Wealthiest People In The World.pdf
Top 10 Wealthiest People In The World.pdfTop 10 Wealthiest People In The World.pdf
Top 10 Wealthiest People In The World.pdf
 
Rohan Jaitley: Central Gov't Standing Counsel for Justice
Rohan Jaitley: Central Gov't Standing Counsel for JusticeRohan Jaitley: Central Gov't Standing Counsel for Justice
Rohan Jaitley: Central Gov't Standing Counsel for Justice
 
VIP Girls Available Call or WhatsApp 9711199012
VIP Girls Available Call or WhatsApp 9711199012VIP Girls Available Call or WhatsApp 9711199012
VIP Girls Available Call or WhatsApp 9711199012
 
AP Election Survey 2024: TDP-Janasena-BJP Alliance Set To Sweep Victory
AP Election Survey 2024: TDP-Janasena-BJP Alliance Set To Sweep VictoryAP Election Survey 2024: TDP-Janasena-BJP Alliance Set To Sweep Victory
AP Election Survey 2024: TDP-Janasena-BJP Alliance Set To Sweep Victory
 
57 Bidens Annihilation Nation Policy.pdf
57 Bidens Annihilation Nation Policy.pdf57 Bidens Annihilation Nation Policy.pdf
57 Bidens Annihilation Nation Policy.pdf
 
IndiaWest: Your Trusted Source for Today's Global News
IndiaWest: Your Trusted Source for Today's Global NewsIndiaWest: Your Trusted Source for Today's Global News
IndiaWest: Your Trusted Source for Today's Global News
 
Brief biography of Julius Robert Oppenheimer
Brief biography of Julius Robert OppenheimerBrief biography of Julius Robert Oppenheimer
Brief biography of Julius Robert Oppenheimer
 
Global Terrorism and its types and prevention ppt.
Global Terrorism and its types and prevention ppt.Global Terrorism and its types and prevention ppt.
Global Terrorism and its types and prevention ppt.
 
Opportunities, challenges, and power of media and information
Opportunities, challenges, and power of media and informationOpportunities, challenges, and power of media and information
Opportunities, challenges, and power of media and information
 
complaint-ECI-PM-media-1-Chandru.pdfra;;prfk
complaint-ECI-PM-media-1-Chandru.pdfra;;prfkcomplaint-ECI-PM-media-1-Chandru.pdfra;;prfk
complaint-ECI-PM-media-1-Chandru.pdfra;;prfk
 
Quiz for Heritage Indian including all the rounds
Quiz for Heritage Indian including all the roundsQuiz for Heritage Indian including all the rounds
Quiz for Heritage Indian including all the rounds
 

European Union Regional Social Progress Index Scorecards

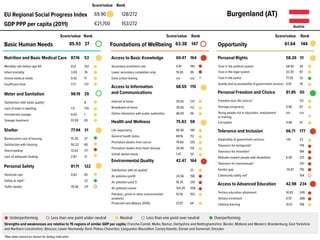
  • 1. EU Regional Social Progress Index 69.90 128/272 GDP PPP per capita (2011) €21,700 153/272 Basic Human Needs 85.93 37 Foundations of Wellbeing 63.38 147 Opportunity 61.64 144 Nutrition and Basic Medical Care 87.16 53 Mortality rate before age 65 0.12 102 Infant mortality 3.00 76 Unmet medical needs 0.42 11 Insufficient food 7.77 137 Water and Sanitation 98.19 29 Satisfaction with water quality* 8 Lack of toilet in dwelling 1.11 179 Uncollected sewage 0.00 1 Sewage treatment 97.09 65 Shelter 77.94 31 Burdensome cost of housing 15.26 27 Satisfaction with housing 50.22 85 Overcrowding 13.63 171 Lack of adequate heating 2.87 31 Personal Safety 81.11 122 Homicide rate 0.82 85 Safety at night* 22 Traffic deaths 79.36 211 Access to Basic Knowledge 69.47 164 Secondary enrolment rate 0.91 195 Lower secondary completion only 19.00 99 Early school leaving n/a n/a Access to Information and Communications 68.65 119 Internet at home 79.00 137 Broadband at home 78.00 112 Online interaction with public authorities 48.00 99 Health and Wellness 75.83 58 Life expectancy 80.90 140 General health status 69.16 112 Premature deaths from cancer 79.60 125 Premature deaths from heart disease 38.40 114 Unmet dental needs 1.47 20 Environmental Quality 42.47 164 Satisfaction with air quality* 33 Air pollution-pm10 24.56 198 Air pollution-pm2.5 18.35 210 Air pollution-ozone 124.29 206 Pollution, grime or other environmental problems 10.76 103 Protected land (Natura 2000) 27.97 64 Personal Rights 58.26 31 Trust in the political system 58.90 34 Trust in the legal system 33.30 97 Trust in the police 77.26 32 Quality and accountability of government services 0.81 34 Personal Freedom and Choice 81.85 50 Freedom over life choices* 112 Teenage pregnancy 0.66 67 Young people not in education, employment or training n/a n/a Corruption 0.98 47 Tolerance and Inclusion 66.71 177 Impartiality of government services 1.16 23 Tolerance for immigrants* 179 Tolerance for minorities* 194 Attitudes toward people with disabilities 6.90 221 Tolerance for homosexuals* 201 Gender gap -10.87 176 Community safety net* 154 Access to Advanced Education 42.98 234 Tertiary education attainment 14.83 249 Tertiary enrolment 0.01 268 Lifelong learning 10.13 108 Burgenland (AT) Strengths and weaknesses are relative to 15 regions of similar GDP per capita: Franche-Comté; Malta; Namur; Derbyshire and Nottinghamshire; Border, Midland and Western; Brandenburg; East Yorkshire and Northern Lincolnshire; Abruzzo; Lower Normandy; Kent; Poitou-Charentes; Languedoc-Roussillon; Canary Islands; Dorset and Somerset; Dresden *Raw data cannot be shown for Gallup indicators Score/value Score/value Score/value Score/value Rank Rank Rank Rank Underperforming OverperformingLess than one point under neutral Less than one point over neutralNeutral Austria
  • 2. EU Regional Social Progress Index 71.01 114/272 GDP PPP per capita (2011) €26,600 99/272 Basic Human Needs 85.47 47 Foundations of Wellbeing 64.90 111 Opportunity 63.66 129 Nutrition and Basic Medical Care 86.24 78 Mortality rate before age 65 0.12 102 Infant mortality 3.50 135 Unmet medical needs 0.42 11 Insufficient food 7.77 137 Water and Sanitation 96.90 68 Satisfaction with water quality* 119 Lack of toilet in dwelling 1.11 179 Uncollected sewage 0.00 1 Sewage treatment 99.09 33 Shelter 77.94 31 Burdensome cost of housing 15.26 27 Satisfaction with housing 50.22 85 Overcrowding 13.63 171 Lack of adequate heating 2.87 31 Personal Safety 81.40 118 Homicide rate 0.40 7 Safety at night* 35 Traffic deaths 85.93 224 Access to Basic Knowledge 74.69 123 Secondary enrolment rate 0.90 210 Lower secondary completion only 16.47 78 Early school leaving 6.70 34 Access to Information and Communications 67.31 132 Internet at home 76.00 159 Broadband at home 74.00 145 Online interaction with public authorities 51.00 74 Health and Wellness 75.15 80 Life expectancy 80.70 153 General health status 69.16 112 Premature deaths from cancer 80.00 127 Premature deaths from heart disease 35.00 84 Unmet dental needs 1.47 20 Environmental Quality 45.00 139 Satisfaction with air quality* 95 Air pollution-pm10 22.62 172 Air pollution-pm2.5 17.09 188 Air pollution-ozone 122.87 206 Pollution, grime or other environmental problems 10.76 103 Protected land (Natura 2000) 29.08 55 Personal Rights 58.26 31 Trust in the political system 58.90 34 Trust in the legal system 33.30 97 Trust in the police 77.26 32 Quality and accountability of government services 0.81 34 Personal Freedom and Choice 81.26 62 Freedom over life choices* 21 Teenage pregnancy 0.72 83 Young people not in education, employment or training 7.07 44 Corruption 0.65 111 Tolerance and Inclusion 66.23 179 Impartiality of government services 1.20 18 Tolerance for immigrants* 192 Tolerance for minorities* 219 Attitudes toward people with disabilities 6.90 221 Tolerance for homosexuals* 194 Gender gap -9.60 111 Community safety net* 166 Access to Advanced Education 50.83 201 Tertiary education attainment 17.33 226 Tertiary enrolment 0.01 263 Lifelong learning 12.20 83 Niederösterreich Strengths and weaknesses are relative to 15 regions of similar GDP per capita: Balearic Islands; North Middle Sweden; East Middle Sweden; Koblenz; Friesland; Western Finland; Marche; WeserEms; Provence-Alpes-Côte d’Azur; Madeira; South Sweden; Eastern Scotland; Mazovia; Hampshire and Isle of Wight; Småland with Islands *Raw data cannot be shown for Gallup indicators Score/value Score/value Score/value Score/value Rank Rank Rank Rank Underperforming OverperformingLess than one point under neutral Less than one point over neutralNeutral Austria
  • 3. EU Regional Social Progress Index 73.11 64/272 GDP PPP per capita (2011) €41,300 11/272 Basic Human Needs 85.87 38 Foundations of Wellbeing 59.90 178 Opportunity 74.74 31 Nutrition and Basic Medical Care 82.03 177 Mortality rate before age 65 0.15 202 Infant mortality 4.80 224 Unmet medical needs 0.42 11 Insufficient food 7.77 137 Water and Sanitation 98.72 15 Satisfaction with water quality* 16 Lack of toilet in dwelling 1.11 179 Uncollected sewage 0.00 1 Sewage treatment 100.00 1 Shelter 77.94 31 Burdensome cost of housing 15.26 27 Satisfaction with housing 50.22 85 Overcrowding 13.63 171 Lack of adequate heating 2.87 31 Personal Safety 85.47 29 Homicide rate 1.01 126 Safety at night* 118 Traffic deaths 12.22 3 Access to Basic Knowledge 70.62 156 Secondary enrolment rate 0.90 210 Lower secondary completion only 18.00 91 Early school leaving 11.43 132 Access to Information and Communications 75.98 42 Internet at home 83.00 101 Broadband at home 83.00 81 Online interaction with public authorities 61.00 35 Health and Wellness 70.95 170 Life expectancy 80.10 186 General health status 69.16 112 Premature deaths from cancer 89.20 185 Premature deaths from heart disease 45.40 156 Unmet dental needs 1.47 20 Environmental Quality 29.32 260 Satisfaction with air quality* 184 Air pollution-pm10 28.07 238 Air pollution-pm2.5 23.45 251 Air pollution-ozone 120.76 206 Pollution, grime or other environmental problems 10.76 103 Protected land (Natura 2000) 13.35 172 Personal Rights 58.26 31 Trust in the political system 58.90 34 Trust in the legal system 33.30 97 Trust in the police 77.26 32 Quality and accountability of government services 0.81 34 Personal Freedom and Choice 74.45 106 Freedom over life choices* 39 Teenage pregnancy 1.47 191 Young people not in education, employment or training 10.50 103 Corruption 0.10 153 Tolerance and Inclusion 72.10 143 Impartiality of government services 0.58 120 Tolerance for immigrants* 153 Tolerance for minorities* 152 Attitudes toward people with disabilities 6.90 221 Tolerance for homosexuals* 98 Gender gap -6.73 43 Community safety net* 193 Access to Advanced Education 96.61 10 Tertiary education attainment 28.23 119 Tertiary enrolment 0.11 1 Lifelong learning 18.03 1 Wien Strengths and weaknesses are relative to 15 regions of similar GDP per capita: Upper Bavaria; North Eastern Scotland; Darmstadt; Stockholm; Prague; Utrecht; Helsinki; Bremen; Capital Region of Denmark; Groningen; Île de France; North Holland; Bolzano; Bratislava Region; Salzburg *Raw data cannot be shown for Gallup indicators Score/value Score/value Score/value Score/value Rank Rank Rank Rank Underperforming OverperformingLess than one point under neutral Less than one point over neutralNeutral Austria
  • 4. EU Regional Social Progress Index 71.24 106/272 GDP PPP per capita (2011) €27,600 77/272 Basic Human Needs 86.31 33 Foundations of Wellbeing 63.58 144 Opportunity 64.91 116 Nutrition and Basic Medical Care 85.93 87 Mortality rate before age 65 0.13 139 Infant mortality 3.35 115 Unmet medical needs 0.42 11 Insufficient food 7.77 137 Water and Sanitation 99.09 3 Satisfaction with water quality* 4 Lack of toilet in dwelling 1.11 179 Uncollected sewage 0.00 1 Sewage treatment 99.86 22 Shelter 77.94 31 Burdensome cost of housing 15.26 27 Satisfaction with housing 50.22 85 Overcrowding 13.63 171 Lack of adequate heating 2.87 31 Personal Safety 82.99 88 Homicide rate 0.48 16 Safety at night* 36 Traffic deaths 71.34 195 Access to Basic Knowledge 77.38 107 Secondary enrolment rate 0.91 195 Lower secondary completion only 12.47 42 Early school leaving 7.35 46 Access to Information and Communications 66.31 139 Internet at home 77.00 154 Broadband at home 75.00 142 Online interaction with public authorities 46.00 119 Health and Wellness 76.31 52 Life expectancy 81.30 102 General health status 69.16 112 Premature deaths from cancer 75.30 88 Premature deaths from heart disease 37.10 108 Unmet dental needs 1.47 20 Environmental Quality 38.69 207 Satisfaction with air quality* 85 Air pollution-pm10 18.60 98 Air pollution-pm2.5 14.54 134 Air pollution-ozone 124.22 206 Pollution, grime or other environmental problems 10.76 103 Protected land (Natura 2000) 8.37 211 Personal Rights 58.26 31 Trust in the political system 58.90 34 Trust in the legal system 33.30 97 Trust in the police 77.26 32 Quality and accountability of government services 0.81 34 Personal Freedom and Choice 81.70 55 Freedom over life choices* 37 Teenage pregnancy 0.85 113 Young people not in education, employment or training 7.33 53 Corruption 0.92 53 Tolerance and Inclusion 62.17 190 Impartiality of government services 0.88 69 Tolerance for immigrants* 237 Tolerance for minorities* 233 Attitudes toward people with disabilities 6.90 221 Tolerance for homosexuals* 202 Gender gap -10.17 134 Community safety net* 116 Access to Advanced Education 58.84 157 Tertiary education attainment 16.93 229 Tertiary enrolment 0.02 223 Lifelong learning 12.17 85 Kärnten Strengths and weaknesses are relative to 15 regions of similar GDP per capita: Münster; Småland with Islands; Liguria; Giessen; Hampshire and Isle of Wight; East Flanders; Arnsberg; South Sweden; Rhône- Alpes; WeserEms; Central Hungary; Friesland; East Middle Sweden; Gelderland; Northern Jutland *Raw data cannot be shown for Gallup indicators Score/value Score/value Score/value Score/value Rank Rank Rank Rank Underperforming OverperformingLess than one point under neutral Less than one point over neutralNeutral Austria
  • 5. EU Regional Social Progress Index 73.82 49/272 GDP PPP per capita (2011) €28,100 73/272 Basic Human Needs 87.01 27 Foundations of Wellbeing 64.87 112 Opportunity 70.45 65 Nutrition and Basic Medical Care 87.85 45 Mortality rate before age 65 0.12 102 Infant mortality 2.60 42 Unmet medical needs 0.42 11 Insufficient food 7.77 137 Water and Sanitation 98.32 26 Satisfaction with water quality* 45 Lack of toilet in dwelling 1.11 179 Uncollected sewage 0.00 1 Sewage treatment 99.35 31 Shelter 77.94 31 Burdensome cost of housing 15.26 27 Satisfaction with housing 50.22 85 Overcrowding 13.63 171 Lack of adequate heating 2.87 31 Personal Safety 84.54 54 Homicide rate 0.33 3 Safety at night* 37 Traffic deaths 62.32 144 Access to Basic Knowledge 76.43 116 Secondary enrolment rate 0.90 210 Lower secondary completion only 15.20 70 Early school leaving 5.13 15 Access to Information and Communications 71.98 97 Internet at home 82.00 112 Broadband at home 81.00 97 Online interaction with public authorities 52.00 68 Health and Wellness 75.19 77 Life expectancy 81.45 92 General health status 69.16 112 Premature deaths from cancer 74.20 81 Premature deaths from heart disease 37.90 113 Unmet dental needs 1.47 20 Environmental Quality 39.94 193 Satisfaction with air quality* 164 Air pollution-pm10 21.79 156 Air pollution-pm2.5 16.15 174 Air pollution-ozone 124.65 206 Pollution, grime or other environmental problems 10.76 103 Protected land (Natura 2000) 16.61 136 Personal Rights 58.26 31 Trust in the political system 58.90 34 Trust in the legal system 33.30 97 Trust in the police 77.26 32 Quality and accountability of government services 0.81 34 Personal Freedom and Choice 82.64 39 Freedom over life choices* 28 Teenage pregnancy 0.86 116 Young people not in education, employment or training 5.90 26 Corruption 0.88 66 Tolerance and Inclusion 66.02 180 Impartiality of government services 1.26 12 Tolerance for immigrants* 200 Tolerance for minorities* 223 Attitudes toward people with disabilities 6.90 221 Tolerance for homosexuals* 190 Gender gap -10.30 140 Community safety net* 102 Access to Advanced Education 76.15 85 Tertiary education attainment 17.40 225 Tertiary enrolment 0.05 53 Lifelong learning 13.97 67 Steiermark Strengths and weaknesses are relative to 15 regions of similar GDP per capita: Aragon; Piedmont; Northern Jutland; La Rioja; Gelderland; Lisbon; Central Hungary; Tuscany; Upper Franconia; Rhône-Alpes; Surrey, East and West Sussex; Southern Denmark; Arnsberg; Berlin; East Flanders *Raw data cannot be shown for Gallup indicators Score/value Score/value Score/value Score/value Rank Rank Rank Rank Underperforming OverperformingLess than one point under neutral Less than one point over neutralNeutral Austria
  • 6. EU Regional Social Progress Index 72.12 86/272 GDP PPP per capita (2011) €32,500 35/272 Basic Human Needs 86.33 32 Foundations of Wellbeing 64.53 126 Opportunity 66.45 97 Nutrition and Basic Medical Care 87.76 47 Mortality rate before age 65 0.11 52 Infant mortality 2.95 71 Unmet medical needs 0.42 11 Insufficient food 7.77 137 Water and Sanitation 97.20 64 Satisfaction with water quality* 87 Lack of toilet in dwelling 1.11 179 Uncollected sewage 0.00 1 Sewage treatment 97.20 62 Shelter 77.94 31 Burdensome cost of housing 15.26 27 Satisfaction with housing 50.22 85 Overcrowding 13.63 171 Lack of adequate heating 2.87 31 Personal Safety 83.00 87 Homicide rate 0.59 34 Safety at night* 28 Traffic deaths 69.54 186 Access to Basic Knowledge 75.15 119 Secondary enrolment rate 0.92 177 Lower secondary completion only 19.17 102 Early school leaving 7.47 50 Access to Information and Communications 72.98 80 Internet at home 83.00 101 Broadband at home 81.00 97 Online interaction with public authorities 54.00 60 Health and Wellness 77.11 37 Life expectancy 81.50 89 General health status 69.16 112 Premature deaths from cancer 72.50 70 Premature deaths from heart disease 36.40 102 Unmet dental needs 1.47 20 Environmental Quality 37.70 220 Satisfaction with air quality* 59 Air pollution-pm10 19.27 111 Air pollution-pm2.5 14.71 143 Air pollution-ozone 118.69 195 Pollution, grime or other environmental problems 10.76 103 Protected land (Natura 2000) 6.27 226 Personal Rights 58.26 31 Trust in the political system 58.90 34 Trust in the legal system 33.30 97 Trust in the police 77.26 32 Quality and accountability of government services 0.81 34 Personal Freedom and Choice 81.48 59 Freedom over life choices* 36 Teenage pregnancy 0.74 89 Young people not in education, employment or training 5.73 24 Corruption 0.54 128 Tolerance and Inclusion 67.27 174 Impartiality of government services 1.17 22 Tolerance for immigrants* 183 Tolerance for minorities* 197 Attitudes toward people with disabilities 6.90 221 Tolerance for homosexuals* 193 Gender gap -10.23 136 Community safety net* 115 Access to Advanced Education 60.02 151 Tertiary education attainment 17.10 227 Tertiary enrolment 0.02 223 Lifelong learning 12.77 76 Oberösterreich Strengths and weaknesses are relative to 15 regions of similar GDP per capita: Flemish Brabant; Navarra; Cologne; Tübingen; Emilia–Romagna; Middle Franconia; South Holland; Madrid; Upper Palatinate; Walloon Brabant; Trento; Zeeland; Cheshire; North Brabant; Basque Country *Raw data cannot be shown for Gallup indicators Score/value Score/value Score/value Score/value Rank Rank Rank Rank Underperforming OverperformingLess than one point under neutral Less than one point over neutralNeutral Austria
  • 7. EU Regional Social Progress Index 75.82 31/272 GDP PPP per capita (2011) €37,500 19/272 Basic Human Needs 86.56 29 Foundations of Wellbeing 70.93 21 Opportunity 70.51 64 Nutrition and Basic Medical Care 89.28 24 Mortality rate before age 65 0.11 52 Infant mortality 2.20 19 Unmet medical needs 0.42 11 Insufficient food 7.77 137 Water and Sanitation 97.65 47 Satisfaction with water quality* 14 Lack of toilet in dwelling 1.11 179 Uncollected sewage 0.00 1 Sewage treatment 95.35 79 Shelter 77.94 31 Burdensome cost of housing 15.26 27 Satisfaction with housing 50.22 85 Overcrowding 13.63 171 Lack of adequate heating 2.87 31 Personal Safety 82.00 107 Homicide rate 0.76 62 Safety at night* 15 Traffic deaths 79.92 213 Access to Basic Knowledge 91.38 12 Secondary enrolment rate 1.00 1 Lower secondary completion only 14.50 62 Early school leaving n/a n/a Access to Information and Communications 71.65 98 Internet at home 79.00 137 Broadband at home 78.00 112 Online interaction with public authorities 57.00 49 Health and Wellness 78.91 9 Life expectancy 82.00 58 General health status 69.16 112 Premature deaths from cancer 62.90 20 Premature deaths from heart disease 34.40 80 Unmet dental needs 1.47 20 Environmental Quality 45.98 129 Satisfaction with air quality* 45 Air pollution-pm10 16.39 47 Air pollution-pm2.5 13.11 96 Air pollution-ozone 116.03 167 Pollution, grime or other environmental problems 10.76 103 Protected land (Natura 2000) 15.27 151 Personal Rights 58.26 31 Trust in the political system 58.90 34 Trust in the legal system 33.30 97 Trust in the police 77.26 32 Quality and accountability of government services 0.81 34 Personal Freedom and Choice 82.08 49 Freedom over life choices* 47 Teenage pregnancy 0.66 67 Young people not in education, employment or training 5.90 26 Corruption 0.70 109 Tolerance and Inclusion 66.87 176 Impartiality of government services 1.21 17 Tolerance for immigrants* 195 Tolerance for minorities* 213 Attitudes toward people with disabilities 6.90 221 Tolerance for homosexuals* 189 Gender gap -10.03 124 Community safety net* 89 Access to Advanced Education 76.00 86 Tertiary education attainment 20.70 195 Tertiary enrolment 0.05 58 Lifelong learning 13.07 74 Salzburg Strengths and weaknesses are relative to 15 regions of similar GDP per capita: Bolzano; North Holland; Berkshire, Buckinghamshire and Oxfordshire; Southern and Eastern; Stuttgart; Åland; Capital Region of Denmark; Bremen; Helsinki; Utrecht; Antwerp; Vorarlberg; Darmstadt; Düsseldorf; Lombardy *Raw data cannot be shown for Gallup indicators Score/value Score/value Score/value Score/value Rank Rank Rank Rank Underperforming OverperformingLess than one point under neutral Less than one point over neutralNeutral Austria
  • 8. EU Regional Social Progress Index 75.13 33/272 GDP PPP per capita (2011) €33,400 29/272 Basic Human Needs 87.58 23 Foundations of Wellbeing 67.14 63 Opportunity 71.41 54 Nutrition and Basic Medical Care 89.08 27 Mortality rate before age 65 0.10 17 Infant mortality 2.65 44 Unmet medical needs 0.42 11 Insufficient food 7.77 137 Water and Sanitation 98.66 17 Satisfaction with water quality* 7 Lack of toilet in dwelling 1.11 179 Uncollected sewage 0.00 1 Sewage treatment 98.91 38 Shelter 77.94 31 Burdensome cost of housing 15.26 27 Satisfaction with housing 50.22 85 Overcrowding 13.63 171 Lack of adequate heating 2.87 31 Personal Safety 85.27 39 Homicide rate 0.33 3 Safety at night* 18 Traffic deaths 61.82 142 Access to Basic Knowledge 72.43 140 Secondary enrolment rate 0.91 195 Lower secondary completion only 19.77 110 Early school leaving 8.97 77 Access to Information and Communications 72.31 87 Internet at home 84.00 97 Broadband at home 83.00 81 Online interaction with public authorities 49.00 95 Health and Wellness 77.00 40 Life expectancy 82.25 48 General health status 69.16 112 Premature deaths from cancer 67.40 36 Premature deaths from heart disease 30.90 42 Unmet dental needs 1.47 20 Environmental Quality 48.81 100 Satisfaction with air quality* 175 Air pollution-pm10 12.48 21 Air pollution-pm2.5 10.10 34 Air pollution-ozone 119.06 198 Pollution, grime or other environmental problems 10.76 103 Protected land (Natura 2000) 14.62 158 Personal Rights 58.26 31 Trust in the political system 58.90 34 Trust in the legal system 33.30 97 Trust in the police 77.26 32 Quality and accountability of government services 0.81 34 Personal Freedom and Choice 81.76 53 Freedom over life choices* 58 Teenage pregnancy 0.68 74 Young people not in education, employment or training 5.90 26 Corruption 0.70 109 Tolerance and Inclusion 68.10 170 Impartiality of government services 1.73 2 Tolerance for immigrants* 193 Tolerance for minorities* 192 Attitudes toward people with disabilities 6.90 221 Tolerance for homosexuals* 192 Gender gap -10.97 178 Community safety net* 28 Access to Advanced Education 78.78 70 Tertiary education attainment 19.13 205 Tertiary enrolment 0.05 33 Lifelong learning 12.67 77 Tirol Strengths and weaknesses are relative to 15 regions of similar GDP per capita: Karlsruhe; Aosta Valley; Basque Country; North Brabant; Lombardy; Madrid; Düsseldorf; South Holland; Vorarlberg; Middle Franconia; Cologne; Flemish Brabant; Upper Austria; Antwerp; Navarra *Raw data cannot be shown for Gallup indicators Score/value Score/value Score/value Score/value Rank Rank Rank Rank Underperforming OverperformingLess than one point under neutral Less than one point over neutralNeutral Austria
  • 9. EU Regional Social Progress Index 71.75 95/272 GDP PPP per capita (2011) €34,400 26/272 Basic Human Needs 87.05 25 Foundations of Wellbeing 65.01 110 Opportunity 64.28 126 Nutrition and Basic Medical Care 88.20 42 Mortality rate before age 65 0.10 17 Infant mortality 3.40 124 Unmet medical needs 0.42 11 Insufficient food 7.77 137 Water and Sanitation 98.47 20 Satisfaction with water quality* 22 Lack of toilet in dwelling 1.11 179 Uncollected sewage 0.00 1 Sewage treatment 99.39 30 Shelter 77.94 31 Burdensome cost of housing 15.26 27 Satisfaction with housing 50.22 85 Overcrowding 13.63 171 Lack of adequate heating 2.87 31 Personal Safety 84.24 59 Homicide rate 0.36 6 Safety at night* 49 Traffic deaths 56.66 129 Access to Basic Knowledge 67.30 178 Secondary enrolment rate 0.89 222 Lower secondary completion only 21.13 122 Early school leaving 11.40 129 Access to Information and Communications 73.65 77 Internet at home 84.00 97 Broadband at home 83.00 81 Online interaction with public authorities 53.00 64 Health and Wellness 78.01 22 Life expectancy 82.35 38 General health status 69.16 112 Premature deaths from cancer 73.00 71 Premature deaths from heart disease 28.80 31 Unmet dental needs 1.47 20 Environmental Quality 44.01 152 Satisfaction with air quality* 114 Air pollution-pm10 14.05 24 Air pollution-pm2.5 10.63 39 Air pollution-ozone 121.83 206 Pollution, grime or other environmental problems 10.76 103 Protected land (Natura 2000) 8.19 213 Personal Rights 58.26 31 Trust in the political system 58.90 34 Trust in the legal system 33.30 97 Trust in the police 77.26 32 Quality and accountability of government services 0.81 34 Personal Freedom and Choice 79.05 71 Freedom over life choices* 14 Teenage pregnancy 0.81 104 Young people not in education, employment or training 7.37 55 Corruption 0.20 149 Tolerance and Inclusion 68.86 166 Impartiality of government services 1.08 32 Tolerance for immigrants* 111 Tolerance for minorities* 125 Attitudes toward people with disabilities 6.90 221 Tolerance for homosexuals* 195 Gender gap -13.23 209 Community safety net* 153 Access to Advanced Education 52.54 191 Tertiary education attainment 18.07 212 Tertiary enrolment 0.01 269 Lifelong learning 14.00 66 Vorarlberg Strengths and weaknesses are relative to 15 regions of similar GDP per capita: Düsseldorf; Lombardy; Aosta Valley; Karlsruhe; Antwerp; Tyrol; Basque Country; North Brabant; Madrid; South Holland; Åland; Middle Franconia; Cologne; Flemish Brabant; Upper Austria *Raw data cannot be shown for Gallup indicators Score/value Score/value Score/value Score/value Rank Rank Rank Rank Underperforming OverperformingLess than one point under neutral Less than one point over neutralNeutral Austria
  • 10. EU Regional Social Progress Index 66.85 153/272 GDP PPP per capita (2011) €55,600 3/272 Basic Human Needs 74.73 182 Foundations of Wellbeing 56.48 212 Opportunity 70.04 68 Nutrition and Basic Medical Care 80.47 197 Mortality rate before age 65 0.13 139 Infant mortality 3.10 91 Unmet medical needs 3.42 207 Insufficient food 12.54 209 Water and Sanitation 86.02 143 Satisfaction with water quality* 227 Lack of toilet in dwelling 3.03 221 Uncollected sewage 0.00 1 Sewage treatment 78.00 125 Shelter 65.05 169 Burdensome cost of housing 54.28 230 Satisfaction with housing 43.34 97 Overcrowding 8.37 155 Lack of adequate heating 16.39 230 Personal Safety 68.38 239 Homicide rate 3.35 259 Safety at night* 226 Traffic deaths 24.78 24 Access to Basic Knowledge 60.52 221 Secondary enrolment rate 0.92 177 Lower secondary completion only 32.27 202 Early school leaving 18.90 225 Access to Information and Communications 68.76 118 Internet at home 78.00 150 Broadband at home 76.00 135 Online interaction with public authorities 52.00 68 Health and Wellness 66.63 204 Life expectancy 80.45 167 General health status 72.84 91 Premature deaths from cancer 86.10 167 Premature deaths from heart disease 39.40 119 Unmet dental needs 4.60 149 Environmental Quality 33.94 245 Satisfaction with air quality* 258 Air pollution-pm10 25.96 214 Air pollution-pm2.5 18.63 214 Air pollution-ozone 104.17 78 Pollution, grime or other environmental problems 28.36 269 Protected land (Natura 2000) 14.10 167 Personal Rights 53.27 80 Trust in the political system 45.94 129 Trust in the legal system 37.36 78 Trust in the police 67.45 91 Quality and accountability of government services 0.74 43 Personal Freedom and Choice 70.90 144 Freedom over life choices* 102 Teenage pregnancy 1.19 162 Young people not in education, employment or training 18.90 227 Corruption 0.75 102 Tolerance and Inclusion 70.42 154 Impartiality of government services -0.36 188 Tolerance for immigrants* 110 Tolerance for minorities* 154 Attitudes toward people with disabilities 7.60 128 Tolerance for homosexuals* 96 Gender gap -9.87 118 Community safety net* 199 Access to Advanced Education 87.70 35 Tertiary education attainment 42.20 1 Tertiary enrolment 0.09 1 Lifelong learning 9.60 119 Région de BruxellesCapitale / Brussels Hoofdstedelijk Gewest Strengths and weaknesses are relative to 15 regions of similar GDP per capita: Hamburg; Luxembourg; Bratislava Region; Île de France; Groningen; Prague; Stockholm; Vienna; Upper Bavaria; North Eastern Scotland; Darmstadt; Utrecht; Helsinki; Bremen; Capital Region of Denmark *Raw data cannot be shown for Gallup indicators Score/value Score/value Score/value Score/value Rank Rank Rank Rank Underperforming OverperformingLess than one point under neutral Less than one point over neutralNeutral Belgium
  • 11. EU Regional Social Progress Index 72.06 88/272 GDP PPP per capita (2011) €34,800 24/272 Basic Human Needs 84.86 61 Foundations of Wellbeing 64.63 124 Opportunity 67.50 87 Nutrition and Basic Medical Care 87.00 60 Mortality rate before age 65 0.11 52 Infant mortality 4.25 200 Unmet medical needs 1.01 45 Insufficient food 2.55 30 Water and Sanitation 95.94 79 Satisfaction with water quality* 139 Lack of toilet in dwelling 0.86 163 Uncollected sewage 0.00 1 Sewage treatment 99.44 29 Shelter 80.20 23 Burdensome cost of housing 16.52 36 Satisfaction with housing 43.34 97 Overcrowding 1.48 4 Lack of adequate heating 3.82 44 Personal Safety 76.89 165 Homicide rate 2.00 239 Safety at night* 106 Traffic deaths 53.72 113 Access to Basic Knowledge 72.19 142 Secondary enrolment rate 0.94 140 Lower secondary completion only 26.20 170 Early school leaving 10.23 107 Access to Information and Communications 74.43 58 Internet at home 86.00 85 Broadband at home 84.00 73 Online interaction with public authorities 53.00 64 Health and Wellness 75.25 73 Life expectancy 81.35 98 General health status 76.54 23 Premature deaths from cancer 74.60 85 Premature deaths from heart disease 33.50 67 Unmet dental needs 2.70 116 Environmental Quality 40.43 187 Satisfaction with air quality* 191 Air pollution-pm10 26.53 219 Air pollution-pm2.5 18.57 213 Air pollution-ozone 106.12 86 Pollution, grime or other environmental problems 12.66 159 Protected land (Natura 2000) 16.31 138 Personal Rights 53.27 80 Trust in the political system 45.94 129 Trust in the legal system 37.36 78 Trust in the police 67.45 91 Quality and accountability of government services 0.74 43 Personal Freedom and Choice 78.23 74 Freedom over life choices* 103 Teenage pregnancy 0.70 78 Young people not in education, employment or training 10.93 111 Corruption 0.91 57 Tolerance and Inclusion 75.07 94 Impartiality of government services 0.98 50 Tolerance for immigrants* 134 Tolerance for minorities* 172 Attitudes toward people with disabilities 7.60 128 Tolerance for homosexuals* 30 Gender gap -9.40 102 Community safety net* 63 Access to Advanced Education 64.90 120 Tertiary education attainment 34.73 49 Tertiary enrolment 0.03 123 Lifelong learning 6.17 196 Prov. Antwerpen Strengths and weaknesses are relative to 15 regions of similar GDP per capita: Vorarlberg; Åland; Düsseldorf; Lombardy; Aosta Valley; Karlsruhe; Tyrol; Stuttgart; Basque Country; North Brabant; Southern and Eastern; Berkshire, Buckinghamshire and Oxfordshire; Madrid; South Holland; Middle Franconia *Raw data cannot be shown for Gallup indicators Score/value Score/value Score/value Score/value Rank Rank Rank Rank Underperforming OverperformingLess than one point under neutral Less than one point over neutralNeutral Belgium
  • 12. EU Regional Social Progress Index 72.44 78/272 GDP PPP per capita (2011) €24,900 112/272 Basic Human Needs 84.78 64 Foundations of Wellbeing 68.05 43 Opportunity 65.23 109 Nutrition and Basic Medical Care 88.28 41 Mortality rate before age 65 0.11 52 Infant mortality 3.70 157 Unmet medical needs 1.01 45 Insufficient food 2.55 30 Water and Sanitation 96.08 77 Satisfaction with water quality* 139 Lack of toilet in dwelling 0.86 163 Uncollected sewage 0.00 1 Sewage treatment 100.00 1 Shelter 80.20 23 Burdensome cost of housing 16.52 36 Satisfaction with housing 43.34 97 Overcrowding 1.48 4 Lack of adequate heating 3.82 44 Personal Safety 75.28 179 Homicide rate 1.56 214 Safety at night* 106 Traffic deaths 78.30 207 Access to Basic Knowledge 78.19 101 Secondary enrolment rate 0.98 37 Lower secondary completion only 28.73 190 Early school leaving 9.73 97 Access to Information and Communications 70.43 103 Internet at home 83.00 101 Broadband at home 81.00 97 Online interaction with public authorities 47.00 109 Health and Wellness 75.73 62 Life expectancy 81.65 82 General health status 76.54 23 Premature deaths from cancer 74.10 78 Premature deaths from heart disease 32.50 58 Unmet dental needs 2.70 116 Environmental Quality 49.83 92 Satisfaction with air quality* 191 Air pollution-pm10 23.85 185 Air pollution-pm2.5 16.66 182 Air pollution-ozone 107.26 95 Pollution, grime or other environmental problems 12.66 159 Protected land (Natura 2000) 30.28 51 Personal Rights 53.27 80 Trust in the political system 45.94 129 Trust in the legal system 37.36 78 Trust in the police 67.45 91 Quality and accountability of government services 0.74 43 Personal Freedom and Choice 78.12 75 Freedom over life choices* 103 Teenage pregnancy 0.51 33 Young people not in education, employment or training 11.80 126 Corruption 0.91 57 Tolerance and Inclusion 75.07 94 Impartiality of government services 0.98 50 Tolerance for immigrants* 134 Tolerance for minorities* 172 Attitudes toward people with disabilities 7.60 128 Tolerance for homosexuals* 30 Gender gap -9.40 102 Community safety net* 63 Access to Advanced Education 56.30 167 Tertiary education attainment 29.40 105 Tertiary enrolment 0.03 217 Lifelong learning 6.60 189 Prov. Limburg (BE) Strengths and weaknesses are relative to 15 regions of similar GDP per capita: Trier; Cyprus; South Aegean; East Anglia; Drenthe; Castile and León; Cantabria; Pays de la Loire; Leicestershire, Rutland and Northamptonshire; West Yorkshire; Midi-Pyrénées; Aquitaine; Southern Finland; Greater Manchester; Upper Normandy *Raw data cannot be shown for Gallup indicators Score/value Score/value Score/value Score/value Rank Rank Rank Rank Underperforming OverperformingLess than one point under neutral Less than one point over neutralNeutral Belgium
  • 13. EU Regional Social Progress Index 73.82 49/272 GDP PPP per capita (2011) €27,400 84/272 Basic Human Needs 85.18 54 Foundations of Wellbeing 65.14 109 Opportunity 71.84 49 Nutrition and Basic Medical Care 86.65 67 Mortality rate before age 65 0.12 102 Infant mortality 3.80 166 Unmet medical needs 1.01 45 Insufficient food 2.55 30 Water and Sanitation 95.72 81 Satisfaction with water quality* 139 Lack of toilet in dwelling 0.86 163 Uncollected sewage 0.00 1 Sewage treatment 98.56 41 Shelter 80.20 23 Burdensome cost of housing 16.52 36 Satisfaction with housing 43.34 97 Overcrowding 1.48 4 Lack of adequate heating 3.82 44 Personal Safety 78.66 152 Homicide rate 1.10 139 Safety at night* 106 Traffic deaths 64.52 162 Access to Basic Knowledge 81.75 71 Secondary enrolment rate 1.00 1 Lower secondary completion only 26.47 172 Early school leaving 8.47 68 Access to Information and Communications 73.09 79 Internet at home 83.00 101 Broadband at home 82.00 92 Online interaction with public authorities 54.00 60 Health and Wellness 73.89 108 Life expectancy 80.95 135 General health status 76.54 23 Premature deaths from cancer 81.70 144 Premature deaths from heart disease 36.00 95 Unmet dental needs 2.70 116 Environmental Quality 37.17 225 Satisfaction with air quality* 191 Air pollution-pm10 27.34 230 Air pollution-pm2.5 19.06 219 Air pollution-ozone 102.27 70 Pollution, grime or other environmental problems 12.66 159 Protected land (Natura 2000) 8.30 212 Personal Rights 53.27 80 Trust in the political system 45.94 129 Trust in the legal system 37.36 78 Trust in the police 67.45 91 Quality and accountability of government services 0.74 43 Personal Freedom and Choice 79.87 69 Freedom over life choices* 103 Teenage pregnancy 0.73 84 Young people not in education, employment or training 8.47 72 Corruption 0.91 57 Tolerance and Inclusion 75.07 94 Impartiality of government services 0.98 50 Tolerance for immigrants* 134 Tolerance for minorities* 172 Attitudes toward people with disabilities 7.60 128 Tolerance for homosexuals* 30 Gender gap -9.40 102 Community safety net* 63 Access to Advanced Education 81.05 64 Tertiary education attainment 35.77 44 Tertiary enrolment 0.05 1 Lifelong learning 7.50 162 Prov. OostVlaanderen Strengths and weaknesses are relative to 15 regions of similar GDP per capita: Arnsberg; Giessen; Liguria; Rhône-Alpes; Carinthia; Münster; Central Hungary; Småland with Islands; Hampshire and Isle of Wight; Gelderland; Northern Jutland; Styria; Aragon; Piedmont; South Sweden *Raw data cannot be shown for Gallup indicators Score/value Score/value Score/value Score/value Rank Rank Rank Rank Underperforming OverperformingLess than one point under neutral Less than one point over neutralNeutral Belgium
  • 14. EU Regional Social Progress Index 74.31 42/272 GDP PPP per capita (2011) €31,800 40/272 Basic Human Needs 86.47 31 Foundations of Wellbeing 64.81 114 Opportunity 72.43 43 Nutrition and Basic Medical Care 88.68 36 Mortality rate before age 65 0.11 52 Infant mortality 3.35 115 Unmet medical needs 1.01 45 Insufficient food 2.55 30 Water and Sanitation 95.03 86 Satisfaction with water quality* 139 Lack of toilet in dwelling 0.86 163 Uncollected sewage 0.00 1 Sewage treatment 95.80 76 Shelter 80.20 23 Burdensome cost of housing 16.52 36 Satisfaction with housing 43.34 97 Overcrowding 1.48 4 Lack of adequate heating 3.82 44 Personal Safety 82.34 100 Homicide rate 0.65 43 Safety at night* 106 Traffic deaths 48.28 101 Access to Basic Knowledge 75.06 121 Secondary enrolment rate 0.92 177 Lower secondary completion only 19.53 108 Early school leaving 6.03 24 Access to Information and Communications 73.76 70 Internet at home 83.00 101 Broadband at home 81.00 97 Online interaction with public authorities 57.00 49 Health and Wellness 76.29 53 Life expectancy 82.00 58 General health status 76.54 23 Premature deaths from cancer 73.40 72 Premature deaths from heart disease 31.40 48 Unmet dental needs 2.70 116 Environmental Quality 38.64 208 Satisfaction with air quality* 191 Air pollution-pm10 25.34 205 Air pollution-pm2.5 17.61 196 Air pollution-ozone 105.88 85 Pollution, grime or other environmental problems 12.66 159 Protected land (Natura 2000) 9.81 199 Personal Rights 53.27 80 Trust in the political system 45.94 129 Trust in the legal system 37.36 78 Trust in the police 67.45 91 Quality and accountability of government services 0.74 43 Personal Freedom and Choice 81.69 57 Freedom over life choices* 103 Teenage pregnancy 0.36 7 Young people not in education, employment or training 7.23 48 Corruption 0.91 57 Tolerance and Inclusion 75.07 94 Impartiality of government services 0.98 50 Tolerance for immigrants* 134 Tolerance for minorities* 172 Attitudes toward people with disabilities 7.60 128 Tolerance for homosexuals* 30 Gender gap -9.40 102 Community safety net* 63 Access to Advanced Education 81.75 59 Tertiary education attainment 43.33 1 Tertiary enrolment 0.05 53 Lifelong learning 9.07 133 Prov. VlaamsBrabant Strengths and weaknesses are relative to 15 regions of similar GDP per capita: Upper Austria; Cologne; Navarra; Tübingen; Emilia–Romagna; Middle Franconia; South Holland; Madrid; Upper Palatinate; Walloon Brabant; Trento; Zeeland; Cheshire; North Brabant; Basque Country *Raw data cannot be shown for Gallup indicators Score/value Score/value Score/value Score/value Rank Rank Rank Rank Underperforming OverperformingLess than one point under neutral Less than one point over neutralNeutral Belgium
  • 15. EU Regional Social Progress Index 70.75 118/272 GDP PPP per capita (2011) €28,500 67/272 Basic Human Needs 85.10 56 Foundations of Wellbeing 62.74 155 Opportunity 65.42 105 Nutrition and Basic Medical Care 87.01 58 Mortality rate before age 65 0.12 102 Infant mortality 3.60 146 Unmet medical needs 1.01 45 Insufficient food 2.55 30 Water and Sanitation 95.98 78 Satisfaction with water quality* 139 Lack of toilet in dwelling 0.86 163 Uncollected sewage 0.00 1 Sewage treatment 99.61 26 Shelter 80.20 23 Burdensome cost of housing 16.52 36 Satisfaction with housing 43.34 97 Overcrowding 1.48 4 Lack of adequate heating 3.82 44 Personal Safety 77.79 159 Homicide rate 0.89 104 Safety at night* 106 Traffic deaths 77.01 205 Access to Basic Knowledge 75.29 118 Secondary enrolment rate 0.95 115 Lower secondary completion only 27.00 178 Early school leaving 7.60 52 Access to Information and Communications 66.43 136 Internet at home 78.00 150 Broadband at home 77.00 123 Online interaction with public authorities 44.00 124 Health and Wellness 74.65 91 Life expectancy 81.60 83 General health status 76.54 23 Premature deaths from cancer 80.50 136 Premature deaths from heart disease 37.60 110 Unmet dental needs 2.70 116 Environmental Quality 38.63 209 Satisfaction with air quality* 191 Air pollution-pm10 26.96 227 Air pollution-pm2.5 19.00 216 Air pollution-ozone 99.89 61 Pollution, grime or other environmental problems 12.66 159 Protected land (Natura 2000) 8.85 208 Personal Rights 53.27 80 Trust in the political system 45.94 129 Trust in the legal system 37.36 78 Trust in the police 67.45 91 Quality and accountability of government services 0.74 43 Personal Freedom and Choice 80.14 68 Freedom over life choices* 103 Teenage pregnancy 0.63 63 Young people not in education, employment or training 8.47 72 Corruption 0.91 57 Tolerance and Inclusion 75.07 94 Impartiality of government services 0.98 50 Tolerance for immigrants* 134 Tolerance for minorities* 172 Attitudes toward people with disabilities 7.60 128 Tolerance for homosexuals* 30 Gender gap -9.40 102 Community safety net* 63 Access to Advanced Education 55.31 174 Tertiary education attainment 32.17 77 Tertiary enrolment 0.02 248 Lifelong learning 6.73 184 Prov. WestVlaanderen Strengths and weaknesses are relative to 15 regions of similar GDP per capita: Bedfordshire and Hertfordshire; Berlin; Southern Denmark; RheinhessenPfalz; Surrey, East and West Sussex; Upper Franconia; Tuscany; Kassel; Lisbon; La Rioja; Gloucestershire, Wiltshire and Bristol/Bath area; Piedmont; Aragon; Saarland; Overijssel *Raw data cannot be shown for Gallup indicators Score/value Score/value Score/value Score/value Rank Rank Rank Rank Underperforming OverperformingLess than one point under neutral Less than one point over neutralNeutral Belgium
  • 16. EU Regional Social Progress Index 68.89 139/272 GDP PPP per capita (2011) €29,800 56/272 Basic Human Needs 73.70 191 Foundations of Wellbeing 63.04 152 Opportunity 70.15 67 Nutrition and Basic Medical Care 83.26 152 Mortality rate before age 65 0.12 102 Infant mortality 4.45 215 Unmet medical needs 1.91 141 Insufficient food 6.46 66 Water and Sanitation 69.27 237 Satisfaction with water quality* 162 Lack of toilet in dwelling 1.70 201 Uncollected sewage 2.13 232 Sewage treatment 0.91 234 Shelter 71.01 151 Burdensome cost of housing 46.97 212 Satisfaction with housing 43.34 97 Overcrowding 1.59 13 Lack of adequate heating 9.97 185 Personal Safety 71.67 214 Homicide rate 1.59 219 Safety at night* 196 Traffic deaths 71.64 197 Access to Basic Knowledge 74.25 126 Secondary enrolment rate 0.92 177 Lower secondary completion only 17.07 83 Early school leaving 8.53 70 Access to Information and Communications 74.43 58 Internet at home 84.00 97 Broadband at home 82.00 92 Online interaction with public authorities 57.00 49 Health and Wellness 72.43 147 Life expectancy 81.15 112 General health status 68.36 126 Premature deaths from cancer 77.80 110 Premature deaths from heart disease 30.90 42 Unmet dental needs 3.70 134 Environmental Quality 36.06 238 Satisfaction with air quality* 204 Air pollution-pm10 24.06 187 Air pollution-pm2.5 16.29 176 Air pollution-ozone 107.05 93 Pollution, grime or other environmental problems 19.57 212 Protected land (Natura 2000) 7.84 217 Personal Rights 53.27 80 Trust in the political system 45.94 129 Trust in the legal system 37.36 78 Trust in the police 67.45 91 Quality and accountability of government services 0.74 43 Personal Freedom and Choice 74.73 102 Freedom over life choices* 123 Teenage pregnancy 0.57 47 Young people not in education, employment or training 12.80 146 Corruption 0.37 134 Tolerance and Inclusion 69.52 161 Impartiality of government services -0.35 183 Tolerance for immigrants* 140 Tolerance for minorities* 155 Attitudes toward people with disabilities 7.60 128 Tolerance for homosexuals* 102 Gender gap -10.60 150 Community safety net* 181 Access to Advanced Education 85.02 43 Tertiary education attainment 52.70 1 Tertiary enrolment 0.08 1 Lifelong learning 8.20 150 Prov. Brabant Wallon Strengths and weaknesses are relative to 15 regions of similar GDP per capita: Upper Palatinate; Trento; Zeeland; Cheshire; Emilia–Romagna; Tübingen; Navarra; Upper Norrland; Lower Franconia; Upper Austria; Swabia; Flemish Brabant; Cologne; Lazio; Veneto *Raw data cannot be shown for Gallup indicators Score/value Score/value Score/value Score/value Rank Rank Rank Rank Underperforming OverperformingLess than one point under neutral Less than one point over neutralNeutral Belgium
  • 17. EU Regional Social Progress Index 62.44 183/272 GDP PPP per capita (2011) €19,900 183/272 Basic Human Needs 71.63 200 Foundations of Wellbeing 56.49 211 Opportunity 59.69 154 Nutrition and Basic Medical Care 79.86 199 Mortality rate before age 65 0.18 223 Infant mortality 3.35 115 Unmet medical needs 1.91 141 Insufficient food 6.46 66 Water and Sanitation 69.23 238 Satisfaction with water quality* 162 Lack of toilet in dwelling 1.70 201 Uncollected sewage 1.62 224 Sewage treatment 0.00 236 Shelter 71.01 151 Burdensome cost of housing 46.97 212 Satisfaction with housing 43.34 97 Overcrowding 1.59 13 Lack of adequate heating 9.97 185 Personal Safety 66.76 248 Homicide rate 2.12 243 Safety at night* 196 Traffic deaths 95.32 241 Access to Basic Knowledge 65.93 190 Secondary enrolment rate 0.96 76 Lower secondary completion only 35.30 211 Early school leaving 17.27 217 Access to Information and Communications 62.09 157 Internet at home 72.00 183 Broadband at home 71.00 161 Online interaction with public authorities 43.00 131 Health and Wellness 64.49 213 Life expectancy 78.20 217 General health status 68.36 126 Premature deaths from cancer 103.20 220 Premature deaths from heart disease 57.10 203 Unmet dental needs 3.70 134 Environmental Quality 36.40 233 Satisfaction with air quality* 204 Air pollution-pm10 24.33 192 Air pollution-pm2.5 16.78 186 Air pollution-ozone 106.47 88 Pollution, grime or other environmental problems 19.57 212 Protected land (Natura 2000) 9.12 206 Personal Rights 53.27 80 Trust in the political system 45.94 129 Trust in the legal system 37.36 78 Trust in the police 67.45 91 Quality and accountability of government services 0.74 43 Personal Freedom and Choice 68.65 163 Freedom over life choices* 123 Teenage pregnancy 1.66 204 Young people not in education, employment or training 17.53 217 Corruption 0.37 134 Tolerance and Inclusion 69.52 161 Impartiality of government services -0.35 183 Tolerance for immigrants* 140 Tolerance for minorities* 155 Attitudes toward people with disabilities 7.60 128 Tolerance for homosexuals* 102 Gender gap -10.60 150 Community safety net* 181 Access to Advanced Education 48.74 214 Tertiary education attainment 27.10 131 Tertiary enrolment 0.03 217 Lifelong learning 3.47 225 Prov. Hainaut Strengths and weaknesses are relative to 15 regions of similar GDP per capita: Sardinia; South Yorkshire; Shropshire and Staffordshire; Central Greece (NUTS2); Castile-La Mancha; South West Bulgaria; Melilla; Martinique; Luxembourg (Belgium); Molise; Crete; Andalusia; Thuringia; Lancashire; Algarve *Raw data cannot be shown for Gallup indicators Score/value Score/value Score/value Score/value Rank Rank Rank Rank Underperforming OverperformingLess than one point under neutral Less than one point over neutralNeutral Belgium
  • 18. EU Regional Social Progress Index 64.80 168/272 GDP PPP per capita (2011) €22,600 136/272 Basic Human Needs 72.12 198 Foundations of Wellbeing 57.05 208 Opportunity 65.68 103 Nutrition and Basic Medical Care 82.13 174 Mortality rate before age 65 0.16 213 Infant mortality 3.40 124 Unmet medical needs 1.91 141 Insufficient food 6.46 66 Water and Sanitation 69.15 241 Satisfaction with water quality* 162 Lack of toilet in dwelling 1.70 201 Uncollected sewage 1.83 229 Sewage treatment 0.00 236 Shelter 71.01 151 Burdensome cost of housing 46.97 212 Satisfaction with housing 43.34 97 Overcrowding 1.59 13 Lack of adequate heating 9.97 185 Personal Safety 66.66 249 Homicide rate 2.70 255 Safety at night* 196 Traffic deaths 80.21 215 Access to Basic Knowledge 55.23 241 Secondary enrolment rate 0.87 243 Lower secondary completion only 33.03 206 Early school leaving 15.47 199 Access to Information and Communications 65.43 144 Internet at home 77.00 154 Broadband at home 76.00 135 Online interaction with public authorities 43.00 131 Health and Wellness 68.16 195 Life expectancy 79.10 212 General health status 68.36 126 Premature deaths from cancer 84.60 159 Premature deaths from heart disease 46.70 163 Unmet dental needs 3.70 134 Environmental Quality 41.41 178 Satisfaction with air quality* 204 Air pollution-pm10 21.47 151 Air pollution-pm2.5 15.00 149 Air pollution-ozone 106.97 92 Pollution, grime or other environmental problems 19.57 212 Protected land (Natura 2000) 13.83 169 Personal Rights 53.27 80 Trust in the political system 45.94 129 Trust in the legal system 37.36 78 Trust in the police 67.45 91 Quality and accountability of government services 0.74 43 Personal Freedom and Choice 72.14 130 Freedom over life choices* 123 Teenage pregnancy 1.22 165 Young people not in education, employment or training 14.13 165 Corruption 0.37 134 Tolerance and Inclusion 69.52 161 Impartiality of government services -0.35 183 Tolerance for immigrants* 140 Tolerance for minorities* 155 Attitudes toward people with disabilities 7.60 128 Tolerance for homosexuals* 102 Gender gap -10.60 150 Community safety net* 181 Access to Advanced Education 68.68 105 Tertiary education attainment 31.93 80 Tertiary enrolment 0.04 66 Lifelong learning 6.43 190 Prov. Liège Strengths and weaknesses are relative to 15 regions of similar GDP per capita: Galicia; Brittany; West Midlands; Zealand; Essex; Nord-Pas-de-Calais; Ceuta; Corsica; Valencia; Herefordshire, Worcestershire and Warwickshire; Burgundy; Cumbria; Auvergne; Dresden; Dorset and Somerset *Raw data cannot be shown for Gallup indicators Score/value Score/value Score/value Score/value Rank Rank Rank Rank Underperforming OverperformingLess than one point under neutral Less than one point over neutralNeutral Belgium
  • 19. EU Regional Social Progress Index 65.84 160/272 GDP PPP per capita (2011) €20,300 177/272 Basic Human Needs 70.51 208 Foundations of Wellbeing 66.16 81 Opportunity 61.03 147 Nutrition and Basic Medical Care 81.95 182 Mortality rate before age 65 0.16 213 Infant mortality 3.25 103 Unmet medical needs 1.91 141 Insufficient food 6.46 66 Water and Sanitation 70.00 235 Satisfaction with water quality* 162 Lack of toilet in dwelling 1.70 201 Uncollected sewage 1.11 219 Sewage treatment 2.36 231 Shelter 71.01 151 Burdensome cost of housing 46.97 212 Satisfaction with housing 43.34 97 Overcrowding 1.59 13 Lack of adequate heating 9.97 185 Personal Safety 59.92 267 Homicide rate 1.62 222 Safety at night* 196 Traffic deaths 161.99 271 Access to Basic Knowledge 78.59 98 Secondary enrolment rate 1.02 1 Lower secondary completion only 29.90 194 Early school leaving 11.70 139 Access to Information and Communications 66.43 136 Internet at home 76.00 159 Broadband at home 76.00 135 Online interaction with public authorities 47.00 109 Health and Wellness 68.07 196 Life expectancy 79.40 208 General health status 68.36 126 Premature deaths from cancer 89.90 189 Premature deaths from heart disease 45.70 159 Unmet dental needs 3.70 134 Environmental Quality 52.86 67 Satisfaction with air quality* 204 Air pollution-pm10 15.71 36 Air pollution-pm2.5 11.86 62 Air pollution-ozone 113.63 136 Pollution, grime or other environmental problems 19.57 212 Protected land (Natura 2000) 31.25 47 Personal Rights 53.27 80 Trust in the political system 45.94 129 Trust in the legal system 37.36 78 Trust in the police 67.45 91 Quality and accountability of government services 0.74 43 Personal Freedom and Choice 73.44 115 Freedom over life choices* 123 Teenage pregnancy 0.94 134 Young people not in education, employment or training 13.30 154 Corruption 0.37 134 Tolerance and Inclusion 69.52 161 Impartiality of government services -0.35 183 Tolerance for immigrants* 140 Tolerance for minorities* 155 Attitudes toward people with disabilities 7.60 128 Tolerance for homosexuals* 102 Gender gap -10.60 150 Community safety net* 181 Access to Advanced Education 49.58 209 Tertiary education attainment 32.07 78 Tertiary enrolment 0.01 260 Lifelong learning 5.53 208 Prov. Luxembourg (BE) Strengths and weaknesses are relative to 15 regions of similar GDP per capita: Melilla; Molise; Thuringia; Lancashire; Castile-La Mancha; Algarve; Western Macedonia; Murcia; Northern Ireland; Shropshire and Staffordshire; Mecklenburg-Vorpommern; Highlands and Islands; Sardinia; Hainaut; Picardy *Raw data cannot be shown for Gallup indicators Score/value Score/value Score/value Score/value Rank Rank Rank Rank Underperforming OverperformingLess than one point under neutral Less than one point over neutralNeutral Belgium
  • 20. EU Regional Social Progress Index 66.54 156/272 GDP PPP per capita (2011) €21,500 155/272 Basic Human Needs 70.87 204 Foundations of Wellbeing 64.19 133 Opportunity 64.67 120 Nutrition and Basic Medical Care 81.95 182 Mortality rate before age 65 0.17 218 Infant mortality 2.80 57 Unmet medical needs 1.91 141 Insufficient food 6.46 66 Water and Sanitation 69.22 239 Satisfaction with water quality* 162 Lack of toilet in dwelling 1.70 201 Uncollected sewage 1.63 225 Sewage treatment 0.00 236 Shelter 71.01 151 Burdensome cost of housing 46.97 212 Satisfaction with housing 43.34 97 Overcrowding 1.59 13 Lack of adequate heating 9.97 185 Personal Safety 61.99 258 Homicide rate 1.63 225 Safety at night* 196 Traffic deaths 145.61 265 Access to Basic Knowledge 76.86 113 Secondary enrolment rate 0.99 18 Lower secondary completion only 28.10 186 Early school leaving 13.27 164 Access to Information and Communications 69.43 112 Internet at home 79.00 137 Broadband at home 78.00 112 Online interaction with public authorities 51.00 74 Health and Wellness 67.25 200 Life expectancy 78.95 213 General health status 68.36 126 Premature deaths from cancer 90.60 191 Premature deaths from heart disease 48.60 172 Unmet dental needs 3.70 134 Environmental Quality 45.52 133 Satisfaction with air quality* 204 Air pollution-pm10 21.05 143 Air pollution-pm2.5 13.94 126 Air pollution-ozone 108.56 102 Pollution, grime or other environmental problems 19.57 212 Protected land (Natura 2000) 21.19 105 Personal Rights 53.27 80 Trust in the political system 45.94 129 Trust in the legal system 37.36 78 Trust in the police 67.45 91 Quality and accountability of government services 0.74 43 Personal Freedom and Choice 73.46 113 Freedom over life choices* 123 Teenage pregnancy 0.94 134 Young people not in education, employment or training 13.27 153 Corruption 0.37 134 Tolerance and Inclusion 69.52 161 Impartiality of government services -0.35 183 Tolerance for immigrants* 140 Tolerance for minorities* 155 Attitudes toward people with disabilities 7.60 128 Tolerance for homosexuals* 102 Gender gap -10.60 150 Community safety net* 181 Access to Advanced Education 63.35 129 Tertiary education attainment 33.67 60 Tertiary enrolment 0.04 91 Lifelong learning 4.67 214 Prov. Namur Strengths and weaknesses are relative to 15 regions of similar GDP per capita: Derbyshire and Nottinghamshire; Malta; Brandenburg; East Yorkshire and Northern Lincolnshire; Lower Normandy; Burgenland; Languedoc-Roussillon; Canary Islands; Ionian Islands; Franche-Comté; Devon; Lorraine; Northumberland and Tyne and Wear; Border, Midland and Western; Saxony-Anhalt *Raw data cannot be shown for Gallup indicators Score/value Score/value Score/value Score/value Rank Rank Rank Rank Underperforming OverperformingLess than one point under neutral Less than one point over neutralNeutral Belgium
  • 21. EU Regional Social Progress Index 40.62 271/272 GDP PPP per capita (2011) €7,200 271/272 Basic Human Needs 44.71 268 Foundations of Wellbeing 46.97 266 Opportunity 31.12 272 Nutrition and Basic Medical Care 41.46 267 Mortality rate before age 65 0.27 268 Infant mortality 9.45 266 Unmet medical needs 8.35 246 Insufficient food 45.62 268 Water and Sanitation 39.07 267 Satisfaction with water quality* 251 Lack of toilet in dwelling 34.52 249 Uncollected sewage 34.53 264 Sewage treatment 0.00 236 Shelter 36.62 268 Burdensome cost of housing 40.90 190 Satisfaction with housing 5.08 267 Overcrowding 42.52 234 Lack of adequate heating 54.24 272 Personal Safety 64.08 256 Homicide rate 2.54 254 Safety at night* 192 Traffic deaths 106.03 255 Access to Basic Knowledge 64.65 196 Secondary enrolment rate 0.90 210 Lower secondary completion only 18.17 94 Early school leaving 18.53 224 Access to Information and Communications 33.40 272 Internet at home 43.00 267 Broadband at home 42.00 259 Online interaction with public authorities 14.00 260 Health and Wellness 43.18 268 Life expectancy 72.95 270 General health status 64.16 220 Premature deaths from cancer 100.10 212 Premature deaths from heart disease 206.10 262 Unmet dental needs 9.97 247 Environmental Quality 49.33 95 Satisfaction with air quality* 174 Air pollution-pm10 27.31 229 Air pollution-pm2.5 18.02 209 Air pollution-ozone 112.73 125 Pollution, grime or other environmental problems 16.60 195 Protected land (Natura 2000) 40.51 1 Personal Rights 15.62 270 Trust in the political system 15.33 256 Trust in the legal system 11.48 225 Trust in the police 19.86 269 Quality and accountability of government services -2.13 263 Personal Freedom and Choice 34.86 271 Freedom over life choices* 199 Teenage pregnancy 4.92 270 Young people not in education, employment or training 34.77 264 Corruption -2.07 267 Tolerance and Inclusion 53.49 236 Impartiality of government services -2.55 269 Tolerance for immigrants* 262 Tolerance for minorities* 191 Attitudes toward people with disabilities 6.40 231 Tolerance for homosexuals* 244 Gender gap -3.73 14 Community safety net* 213 Access to Advanced Education 26.47 270 Tertiary education attainment 18.77 209 Tertiary enrolment 0.00 272 Lifelong learning n/a n/a Severozapaden Strengths and weaknesses are relative to 15 regions of similar GDP per capita: Northeast Romania; North Central Bulgaria; South Central Bulgaria; North East Bulgaria; Southwest Oltenia; South East Bulgaria; Southeast Romania; Northern Hungary; South Muntenia; Northern Great Plain; Lublin Province; Podkarpacia; Northwest Romania; Southern Great Plain; Southern Transdanubia *Raw data cannot be shown for Gallup indicators Score/value Score/value Score/value Score/value Rank Rank Rank Rank Underperforming OverperformingLess than one point under neutral Less than one point over neutralNeutral Bulgaria
  • 22. EU Regional Social Progress Index 46.22 265/272 GDP PPP per capita (2011) €7,800 270/272 Basic Human Needs 47.33 266 Foundations of Wellbeing 49.30 260 Opportunity 42.18 259 Nutrition and Basic Medical Care 39.34 269 Mortality rate before age 65 0.25 256 Infant mortality 8.65 261 Unmet medical needs 9.92 255 Insufficient food 55.18 270 Water and Sanitation 47.37 261 Satisfaction with water quality* 230 Lack of toilet in dwelling 29.11 248 Uncollected sewage 23.01 261 Sewage treatment 0.00 236 Shelter 39.33 265 Burdensome cost of housing 45.18 207 Satisfaction with housing 7.80 258 Overcrowding 38.12 229 Lack of adequate heating 48.39 270 Personal Safety 65.51 253 Homicide rate 2.03 241 Safety at night* 219 Traffic deaths 94.11 238 Access to Basic Knowledge 67.46 176 Secondary enrolment rate 0.92 177 Lower secondary completion only 22.60 130 Early school leaving 15.97 208 Access to Information and Communications 39.73 260 Internet at home 50.00 262 Broadband at home 49.00 253 Online interaction with public authorities 19.00 247 Health and Wellness 47.10 261 Life expectancy 73.75 267 General health status 63.82 221 Premature deaths from cancer 106.50 229 Premature deaths from heart disease 170.00 258 Unmet dental needs 8.83 243 Environmental Quality 44.97 140 Satisfaction with air quality* 168 Air pollution-pm10 27.82 235 Air pollution-pm2.5 19.82 227 Air pollution-ozone 111.42 114 Pollution, grime or other environmental problems 9.80 89 Protected land (Natura 2000) 28.07 63 Personal Rights 20.09 266 Trust in the political system 15.90 253 Trust in the legal system 10.33 242 Trust in the police 29.11 264 Quality and accountability of government services -1.58 253 Personal Freedom and Choice 46.47 259 Freedom over life choices* 213 Teenage pregnancy 3.49 259 Young people not in education, employment or training 24.40 251 Corruption -1.41 250 Tolerance and Inclusion 58.94 204 Impartiality of government services -2.06 266 Tolerance for immigrants* 228 Tolerance for minorities* 137 Attitudes toward people with disabilities 6.40 231 Tolerance for homosexuals* 207 Gender gap -5.57 34 Community safety net* 225 Access to Advanced Education 49.01 212 Tertiary education attainment 20.97 192 Tertiary enrolment 0.05 47 Lifelong learning 0.87 266 Severen tsentralen Strengths and weaknesses are relative to 15 regions of similar GDP per capita: Northeast Romania; South Central Bulgaria; North West Bulgaria; North East Bulgaria; Southwest Oltenia; South East Bulgaria; Southeast Romania; Northern Hungary; South Muntenia; Northern Great Plain; Lublin Province; Podkarpacia; Northwest Romania; Southern Great Plain; Southern Transdanubia *Raw data cannot be shown for Gallup indicators Score/value Score/value Score/value Score/value Rank Rank Rank Rank Underperforming OverperformingLess than one point under neutral Less than one point over neutralNeutral Bulgaria
  • 23. EU Regional Social Progress Index 45.67 266/272 GDP PPP per capita (2011) €9,400 267/272 Basic Human Needs 46.28 267 Foundations of Wellbeing 46.67 267 Opportunity 44.06 252 Nutrition and Basic Medical Care 35.78 271 Mortality rate before age 65 0.25 256 Infant mortality 8.60 260 Unmet medical needs 14.15 269 Insufficient food 51.28 269 Water and Sanitation 47.65 260 Satisfaction with water quality* 260 Lack of toilet in dwelling 26.55 245 Uncollected sewage 14.81 253 Sewage treatment 0.00 236 Shelter 36.41 269 Burdensome cost of housing 45.35 209 Satisfaction with housing 6.29 263 Overcrowding 46.50 251 Lack of adequate heating 45.88 268 Personal Safety 68.80 236 Homicide rate 1.60 221 Safety at night* 211 Traffic deaths 83.17 219 Access to Basic Knowledge 64.45 197 Secondary enrolment rate 0.89 222 Lower secondary completion only 24.97 154 Early school leaving 14.07 182 Access to Information and Communications 40.40 259 Internet at home 52.00 254 Broadband at home 52.00 245 Online interaction with public authorities 16.00 258 Health and Wellness 40.51 271 Life expectancy 73.95 265 General health status 64.25 218 Premature deaths from cancer 118.30 247 Premature deaths from heart disease 166.00 257 Unmet dental needs 16.23 269 Environmental Quality 43.26 159 Satisfaction with air quality* 201 Air pollution-pm10 28.07 238 Air pollution-pm2.5 20.49 231 Air pollution-ozone 113.35 132 Pollution, grime or other environmental problems 17.36 203 Protected land (Natura 2000) 33.69 37 Personal Rights 22.77 265 Trust in the political system 17.80 250 Trust in the legal system 12.89 215 Trust in the police 21.09 267 Quality and accountability of government services -0.72 216 Personal Freedom and Choice 47.79 257 Freedom over life choices* 222 Teenage pregnancy 4.03 265 Young people not in education, employment or training 23.97 249 Corruption -0.57 195 Tolerance and Inclusion 60.08 201 Impartiality of government services -0.31 181 Tolerance for immigrants* 208 Tolerance for minorities* 127 Attitudes toward people with disabilities 6.40 231 Tolerance for homosexuals* 234 Gender gap -8.10 71 Community safety net* 256 Access to Advanced Education 50.65 205 Tertiary education attainment 23.33 173 Tertiary enrolment 0.05 56 Lifelong learning 1.40 255 Severoiztochen Strengths and weaknesses are relative to 15 regions of similar GDP per capita: Southwest Oltenia; South East Bulgaria; Southeast Romania; Northern Hungary; South Muntenia; South Central Bulgaria; Northern Great Plain; Lublin Province; Podkarpacia; Northwest Romania; North Central Bulgaria; Southern Great Plain; Northeast Romania; Southern Transdanubia; North West Bulgaria *Raw data cannot be shown for Gallup indicators Score/value Score/value Score/value Score/value Rank Rank Rank Rank Underperforming OverperformingLess than one point under neutral Less than one point over neutralNeutral Bulgaria
  • 24. EU Regional Social Progress Index 39.72 272/272 GDP PPP per capita (2011) €9,500 266/272 Basic Human Needs 42.46 272 Foundations of Wellbeing 45.80 269 Opportunity 31.61 271 Nutrition and Basic Medical Care 31.32 272 Mortality rate before age 65 0.26 261 Infant mortality 10.65 271 Unmet medical needs 13.09 267 Insufficient food 55.81 271 Water and Sanitation 44.75 266 Satisfaction with water quality* 242 Lack of toilet in dwelling 28.84 247 Uncollected sewage 26.39 263 Sewage treatment 0.00 236 Shelter 34.13 272 Burdensome cost of housing 48.76 222 Satisfaction with housing 6.08 264 Overcrowding 47.30 257 Lack of adequate heating 50.21 271 Personal Safety 63.00 257 Homicide rate 2.47 253 Safety at night* 212 Traffic deaths 104.29 254 Access to Basic Knowledge 54.79 243 Secondary enrolment rate 0.85 266 Lower secondary completion only 24.03 142 Early school leaving 20.07 231 Access to Information and Communications 38.06 263 Internet at home 47.00 266 Broadband at home 47.00 254 Online interaction with public authorities 19.00 247 Health and Wellness 42.16 270 Life expectancy 73.65 268 General health status 66.90 167 Premature deaths from cancer 103.20 220 Premature deaths from heart disease 190.80 261 Unmet dental needs 11.57 254 Environmental Quality 49.08 98 Satisfaction with air quality* 234 Air pollution-pm10 25.79 209 Air pollution-pm2.5 17.50 193 Air pollution-ozone 112.29 119 Pollution, grime or other environmental problems 20.52 222 Protected land (Natura 2000) 43.17 1 Personal Rights 14.42 271 Trust in the political system 11.05 271 Trust in the legal system 11.34 230 Trust in the police 20.16 268 Quality and accountability of government services -2.17 265 Personal Freedom and Choice 35.49 270 Freedom over life choices* 224 Teenage pregnancy 6.60 271 Young people not in education, employment or training 27.90 259 Corruption -1.28 241 Tolerance and Inclusion 53.87 232 Impartiality of government services -2.12 267 Tolerance for immigrants* 244 Tolerance for minorities* 199 Attitudes toward people with disabilities 6.40 231 Tolerance for homosexuals* 247 Gender gap -7.03 44 Community safety net* 214 Access to Advanced Education 29.10 267 Tertiary education attainment 19.73 200 Tertiary enrolment 0.02 254 Lifelong learning 1.03 263 Yugoiztochen Strengths and weaknesses are relative to 15 regions of similar GDP per capita: Southwest Oltenia; North East Bulgaria; Southeast Romania; Northern Hungary; South Muntenia; South Central Bulgaria; Northern Great Plain; Lublin Province; Podkarpacia; Northwest Romania; North Central Bulgaria; Southern Great Plain; Northeast Romania; Southern Transdanubia; Central Romania *Raw data cannot be shown for Gallup indicators Score/value Score/value Score/value Score/value Rank Rank Rank Rank Underperforming OverperformingLess than one point under neutral Less than one point over neutralNeutral Bulgaria
  • 25. EU Regional Social Progress Index 50.70 258/272 GDP PPP per capita (2011) €19,600 188/272 Basic Human Needs 52.75 259 Foundations of Wellbeing 54.84 228 Opportunity 44.79 251 Nutrition and Basic Medical Care 55.31 259 Mortality rate before age 65 0.23 248 Infant mortality 4.95 228 Unmet medical needs 6.57 227 Insufficient food 41.54 267 Water and Sanitation 54.76 259 Satisfaction with water quality* 259 Lack of toilet in dwelling 9.18 238 Uncollected sewage 15.89 255 Sewage treatment 0.00 236 Shelter 36.15 271 Burdensome cost of housing 46.03 211 Satisfaction with housing 6.31 262 Overcrowding 48.81 265 Lack of adequate heating 42.85 267 Personal Safety 67.27 245 Homicide rate 2.08 242 Safety at night* 229 Traffic deaths 62.56 147 Access to Basic Knowledge 86.80 26 Secondary enrolment rate 0.95 115 Lower secondary completion only 8.90 22 Early school leaving 4.07 7 Access to Information and Communications 54.40 211 Internet at home 64.00 234 Broadband at home 64.00 214 Online interaction with public authorities 34.00 171 Health and Wellness 44.20 266 Life expectancy 75.25 250 General health status 66.93 166 Premature deaths from cancer 105.40 225 Premature deaths from heart disease 171.40 259 Unmet dental needs 8.97 244 Environmental Quality 39.45 202 Satisfaction with air quality* 260 Air pollution-pm10 34.93 259 Air pollution-pm2.5 23.94 255 Air pollution-ozone 115.29 150 Pollution, grime or other environmental problems 17.36 203 Protected land (Natura 2000) 46.20 1 Personal Rights 18.17 269 Trust in the political system 19.47 243 Trust in the legal system 14.37 184 Trust in the police 28.68 265 Quality and accountability of government services -2.47 268 Personal Freedom and Choice 50.97 252 Freedom over life choices* 247 Teenage pregnancy 2.25 238 Young people not in education, employment or training 10.97 113 Corruption -2.66 270 Tolerance and Inclusion 51.69 249 Impartiality of government services -3.17 270 Tolerance for immigrants* 249 Tolerance for minorities* 234 Attitudes toward people with disabilities 6.40 231 Tolerance for homosexuals* 222 Gender gap -4.70 22 Community safety net* 230 Access to Advanced Education 66.85 110 Tertiary education attainment 33.63 62 Tertiary enrolment 0.06 1 Lifelong learning 2.63 238 Yugozapaden Strengths and weaknesses are relative to 15 regions of similar GDP per capita: Martinique; Crete; Andalusia; Central Greece (NUTS2); South Yorkshire; Tees Valley and Durham; Azores; Lincolnshire; Hainaut; Sardinia; Guadeloupe; Shropshire and Staffordshire; Southeast; Castile-La Mancha; Central Bohemian Region *Raw data cannot be shown for Gallup indicators Score/value Score/value Score/value Score/value Rank Rank Rank Rank Underperforming OverperformingLess than one point under neutral Less than one point over neutralNeutral Bulgaria
  • 26. EU Regional Social Progress Index 44.22 267/272 GDP PPP per capita (2011) €8,100 269/272 Basic Human Needs 47.86 265 Foundations of Wellbeing 49.74 256 Opportunity 35.74 270 Nutrition and Basic Medical Care 40.70 268 Mortality rate before age 65 0.23 248 Infant mortality 9.50 267 Unmet medical needs 6.34 226 Insufficient food 62.85 272 Water and Sanitation 45.72 263 Satisfaction with water quality* 255 Lack of toilet in dwelling 25.37 244 Uncollected sewage 24.34 262 Sewage treatment 0.00 236 Shelter 37.98 266 Burdensome cost of housing 43.90 201 Satisfaction with housing 2.71 271 Overcrowding 44.24 240 Lack of adequate heating 40.86 266 Personal Safety 70.02 229 Homicide rate 1.73 230 Safety at night* 181 Traffic deaths 85.20 223 Access to Basic Knowledge 62.39 210 Secondary enrolment rate 0.89 222 Lower secondary completion only 24.80 152 Early school leaving 15.30 195 Access to Information and Communications 42.40 256 Internet at home 53.00 251 Broadband at home 53.00 243 Online interaction with public authorities 20.00 243 Health and Wellness 48.05 257 Life expectancy 74.75 257 General health status 71.36 104 Premature deaths from cancer 105.90 228 Premature deaths from heart disease 165.80 256 Unmet dental needs 6.93 231 Environmental Quality 47.17 114 Satisfaction with air quality* 247 Air pollution-pm10 32.77 255 Air pollution-pm2.5 20.48 230 Air pollution-ozone 114.18 140 Pollution, grime or other environmental problems 8.94 44 Protected land (Natura 2000) 56.52 1 Personal Rights 14.02 272 Trust in the political system 10.99 272 Trust in the legal system 7.95 254 Trust in the police 15.32 270 Quality and accountability of government services -1.77 256 Personal Freedom and Choice 42.63 269 Freedom over life choices* 250 Teenage pregnancy 4.59 269 Young people not in education, employment or training 24.90 252 Corruption -0.83 215 Tolerance and Inclusion 55.99 221 Impartiality of government services -1.22 242 Tolerance for immigrants* 256 Tolerance for minorities* 212 Attitudes toward people with disabilities 6.40 231 Tolerance for homosexuals* 235 Gender gap -4.10 16 Community safety net* 238 Access to Advanced Education 37.90 250 Tertiary education attainment 19.63 203 Tertiary enrolment 0.03 161 Lifelong learning 1.13 261 Yuzhen tsentralen Strengths and weaknesses are relative to 15 regions of similar GDP per capita: North Central Bulgaria; Northeast Romania; North West Bulgaria; North East Bulgaria; Southwest Oltenia; South East Bulgaria; Southeast Romania; Northern Hungary; South Muntenia; Northern Great Plain; Lublin Province; Podkarpacia; Northwest Romania; Southern Great Plain; Southern Transdanubia *Raw data cannot be shown for Gallup indicators Score/value Score/value Score/value Score/value Rank Rank Rank Rank Underperforming OverperformingLess than one point under neutral Less than one point over neutralNeutral Bulgaria
  • 27. EU Regional Social Progress Index 58.98 206/272 GDP PPP per capita (2011) €23,600 123/272 Basic Human Needs 69.41 213 Foundations of Wellbeing 52.50 240 Opportunity 55.70 181 Nutrition and Basic Medical Care 85.37 100 Mortality rate before age 65 0.09 4 Infant mortality 3.30 108 Unmet medical needs 4.10 213 Insufficient food 6.17 65 Water and Sanitation 63.11 255 Satisfaction with water quality* 229 Lack of toilet in dwelling 1.05 177 Uncollected sewage 38.33 266 Sewage treatment 39.35 181 Shelter 55.18 202 Burdensome cost of housing 73.87 271 Satisfaction with housing 27.82 171 Overcrowding 2.67 27 Lack of adequate heating 29.26 257 Personal Safety 75.93 174 Homicide rate 1.34 189 Safety at night* n/a Traffic deaths 64.84 166 Access to Basic Knowledge 58.15 234 Secondary enrolment rate n/a 271 Lower secondary completion only 22.97 136 Early school leaving 10.60 112 Access to Information and Communications 53.00 224 Internet at home 65.00 228 Broadband at home 64.00 214 Online interaction with public authorities 30.00 198 Health and Wellness 71.86 156 Life expectancy 81.15 112 General health status 76.47 29 Premature deaths from cancer 53.20 2 Premature deaths from heart disease 45.20 155 Unmet dental needs 7.63 234 Environmental Quality 31.36 255 Satisfaction with air quality* 226 Air pollution-pm10 33.77 256 Air pollution-pm2.5 21.62 241 Air pollution-ozone 115.58 154 Pollution, grime or other environmental problems 16.79 197 Protected land (Natura 2000) 21.26 103 Personal Rights 31.62 229 Trust in the political system 23.29 230 Trust in the legal system 13.06 212 Trust in the police 39.20 254 Quality and accountability of government services 0.06 168 Personal Freedom and Choice 67.31 181 Freedom over life choices* 203 Teenage pregnancy 0.59 53 Young people not in education, employment or training 16.43 207 Corruption 0.24 146 Tolerance and Inclusion 59.61 202 Impartiality of government services -0.23 172 Tolerance for immigrants* 211 Tolerance for minorities* 182 Attitudes toward people with disabilities 7.20 190 Tolerance for homosexuals* 218 Gender gap -10.90 177 Community safety net* 258 Access to Advanced Education 68.97 104 Tertiary education attainment 38.77 28 Tertiary enrolment 0.04 83 Lifelong learning 7.27 166 Kýpros Strengths and weaknesses are relative to 15 regions of similar GDP per capita: East Anglia; Castile and León; Cantabria; Pays de la Loire; Limburg (BE); Leicestershire, Rutland and Northamptonshire; West Yorkshire; Midi-Pyrénées; Aquitaine; Trier; South Aegean; Greater Manchester; Drenthe; Upper Normandy; Flevoland *Raw data cannot be shown for Gallup indicators Score/value Score/value Score/value Score/value Rank Rank Rank Rank Underperforming OverperformingLess than one point under neutral Less than one point over neutralNeutral Cyprus
  • 28. EU Regional Social Progress Index 65.85 159/272 GDP PPP per capita (2011) €42,900 9/272 Basic Human Needs 73.86 188 Foundations of Wellbeing 60.29 172 Opportunity 63.77 127 Nutrition and Basic Medical Care 86.41 74 Mortality rate before age 65 0.14 180 Infant mortality 1.75 5 Unmet medical needs 1.53 97 Insufficient food 8.28 147 Water and Sanitation 72.38 222 Satisfaction with water quality* 122 Lack of toilet in dwelling 0.95 169 Uncollected sewage 0.00 1 Sewage treatment 1.01 233 Shelter 63.09 176 Burdensome cost of housing 24.97 84 Satisfaction with housing 21.39 181 Overcrowding 26.43 216 Lack of adequate heating 4.57 52 Personal Safety 74.50 186 Homicide rate 1.46 208 Safety at night* 224 Traffic deaths 30.10 39 Access to Basic Knowledge 94.39 2 Secondary enrolment rate 0.98 37 Lower secondary completion only 3.47 2 Early school leaving 2.63 1 Access to Information and Communications 66.32 138 Internet at home 80.00 134 Broadband at home 79.00 104 Online interaction with public authorities 40.00 150 Health and Wellness 65.65 209 Life expectancy 79.70 202 General health status 65.26 177 Premature deaths from cancer 91.20 192 Premature deaths from heart disease 54.10 196 Unmet dental needs 2.10 75 Environmental Quality 25.98 264 Satisfaction with air quality* 248 Air pollution-pm10 25.29 204 Air pollution-pm2.5 19.00 216 Air pollution-ozone 113.74 137 Pollution, grime or other environmental problems 22.41 228 Protected land (Natura 2000) 1.87 256 Personal Rights 34.33 208 Trust in the political system 23.49 229 Trust in the legal system 26.33 151 Trust in the police 45.24 240 Quality and accountability of government services -0.44 192 Personal Freedom and Choice 72.57 126 Freedom over life choices* 166 Teenage pregnancy 0.64 66 Young people not in education, employment or training 3.47 1 Corruption -1.22 238 Tolerance and Inclusion 62.12 191 Impartiality of government services -0.13 164 Tolerance for immigrants* 169 Tolerance for minorities* 217 Attitudes toward people with disabilities 5.40 263 Tolerance for homosexuals* 101 Gender gap -16.47 237 Community safety net* 176 Access to Advanced Education 93.77 18 Tertiary education attainment 37.80 30 Tertiary enrolment 0.13 1 Lifelong learning 12.17 85 Praha Strengths and weaknesses are relative to 15 regions of similar GDP per capita: Stockholm; Groningen; Île de France; Bratislava Region; Vienna; Upper Bavaria; North Eastern Scotland; Darmstadt; Utrecht; Helsinki; Bremen; Capital Region of Denmark; North Holland; Bolzano; Salzburg *Raw data cannot be shown for Gallup indicators Score/value Score/value Score/value Score/value Rank Rank Rank Rank Underperforming OverperformingLess than one point under neutral Less than one point over neutralNeutral Czech Republic
  • 29. EU Regional Social Progress Index 59.09 204/272 GDP PPP per capita (2011) €18,200 202/272 Basic Human Needs 73.65 193 Foundations of Wellbeing 60.04 175 Opportunity 45.29 246 Nutrition and Basic Medical Care 83.73 142 Mortality rate before age 65 0.16 213 Infant mortality 2.15 17 Unmet medical needs 0.74 39 Insufficient food 11.57 206 Water and Sanitation 71.79 226 Satisfaction with water quality* 218 Lack of toilet in dwelling 0.66 157 Uncollected sewage 0.00 1 Sewage treatment 14.38 212 Shelter 66.56 163 Burdensome cost of housing 26.59 86 Satisfaction with housing 21.74 179 Overcrowding 15.13 180 Lack of adequate heating 6.27 103 Personal Safety 73.03 196 Homicide rate 1.12 144 Safety at night* 182 Traffic deaths 79.26 209 Access to Basic Knowledge 92.17 8 Secondary enrolment rate 0.98 37 Lower secondary completion only 6.70 10 Early school leaving 3.87 6 Access to Information and Communications 62.32 156 Internet at home 79.00 137 Broadband at home 76.00 135 Online interaction with public authorities 32.00 186 Health and Wellness 62.73 218 Life expectancy 77.95 222 General health status 61.71 228 Premature deaths from cancer 103.50 222 Premature deaths from heart disease 69.10 211 Unmet dental needs 1.50 30 Environmental Quality 31.11 256 Satisfaction with air quality* 230 Air pollution-pm10 22.10 165 Air pollution-pm2.5 17.06 187 Air pollution-ozone 115.42 152 Pollution, grime or other environmental problems 21.68 226 Protected land (Natura 2000) 6.58 222 Personal Rights 26.46 258 Trust in the political system 18.15 248 Trust in the legal system 18.42 178 Trust in the police 27.22 266 Quality and accountability of government services -0.45 195 Personal Freedom and Choice 66.86 184 Freedom over life choices* 206 Teenage pregnancy 0.99 141 Young people not in education, employment or training 7.23 48 Corruption -0.95 223 Tolerance and Inclusion 48.98 263 Impartiality of government services -0.25 174 Tolerance for immigrants* 255 Tolerance for minorities* 264 Attitudes toward people with disabilities 5.40 263 Tolerance for homosexuals* 211 Gender gap -16.60 239 Community safety net* 243 Access to Advanced Education 43.56 232 Tertiary education attainment 18.47 211 Tertiary enrolment 0.00 271 Lifelong learning 10.40 105 Strední Cechy Strengths and weaknesses are relative to 15 regions of similar GDP per capita: Alentejo; Basilicata; Southeast; Guadeloupe; Lincolnshire; Azores; Tees Valley and Durham; Eastern Slovenia; Southwest; Lower Silesia; Peloponnese; West Slovakia; Andalusia; North Aegean; Crete *Raw data cannot be shown for Gallup indicators Score/value Score/value Score/value Score/value Rank Rank Rank Rank Underperforming OverperformingLess than one point under neutral Less than one point over neutralNeutral Czech Republic
  • 30. EU Regional Social Progress Index 63.20 178/272 GDP PPP per capita (2011) €17,600 212/272 Basic Human Needs 73.90 187 Foundations of Wellbeing 63.62 143 Opportunity 52.94 196 Nutrition and Basic Medical Care 82.62 166 Mortality rate before age 65 0.15 202 Infant mortality 2.50 32 Unmet medical needs 2.17 151 Insufficient food 9.65 190 Water and Sanitation 76.85 195 Satisfaction with water quality* 125 Lack of toilet in dwelling 0.33 76 Uncollected sewage 0.00 1 Sewage treatment 18.49 204 Shelter 63.79 173 Burdensome cost of housing 24.49 83 Satisfaction with housing 17.14 202 Overcrowding 20.18 195 Lack of adequate heating 7.31 136 Personal Safety 72.99 197 Homicide rate 0.69 47 Safety at night* 165 Traffic deaths 101.55 248 Access to Basic Knowledge 88.98 20 Secondary enrolment rate 0.97 58 Lower secondary completion only 6.73 11 Early school leaving 5.53 20 Access to Information and Communications 54.99 207 Internet at home 71.00 198 Broadband at home 68.00 187 Online interaction with public authorities 26.00 215 Health and Wellness 65.67 208 Life expectancy 78.20 217 General health status 63.21 225 Premature deaths from cancer 100.00 210 Premature deaths from heart disease 71.30 212 Unmet dental needs 1.33 18 Environmental Quality 48.35 106 Satisfaction with air quality* 153 Air pollution-pm10 17.85 78 Air pollution-pm2.5 14.14 130 Air pollution-ozone 113.46 134 Pollution, grime or other environmental problems 13.19 169 Protected land (Natura 2000) 23.63 90 Personal Rights 31.84 228 Trust in the political system 25.14 223 Trust in the legal system 25.14 156 Trust in the police 32.92 259 Quality and accountability of government services -0.33 187 Personal Freedom and Choice 68.17 167 Freedom over life choices* 194 Teenage pregnancy 1.22 165 Young people not in education, employment or training 7.87 61 Corruption -0.79 209 Tolerance and Inclusion 53.98 231 Impartiality of government services -0.13 164 Tolerance for immigrants* 233 Tolerance for minorities* 241 Attitudes toward people with disabilities 5.40 263 Tolerance for homosexuals* 196 Gender gap -17.17 242 Community safety net* 217 Access to Advanced Education 61.75 139 Tertiary education attainment 16.70 231 Tertiary enrolment 0.03 123 Lifelong learning 11.37 91 Jihozápad Strengths and weaknesses are relative to 15 regions of similar GDP per capita: Eastern Slovenia; Lower Silesia; Peloponnese; West Slovakia; North Aegean; Cornwall and Isles of Scilly; Extremadura; Moravia- Silesia; Réunion; Basilicata; Alentejo; Central Macedonia; Central Bohemian Region; Silesia; Apulia *Raw data cannot be shown for Gallup indicators Score/value Score/value Score/value Score/value Rank Rank Rank Rank Underperforming OverperformingLess than one point under neutral Less than one point over neutralNeutral Czech Republic
  • 31. EU Regional Social Progress Index 56.52 232/272 GDP PPP per capita (2011) €15,700 230/272 Basic Human Needs 69.60 212 Foundations of Wellbeing 56.04 216 Opportunity 45.22 248 Nutrition and Basic Medical Care 73.07 222 Mortality rate before age 65 0.20 229 Infant mortality 4.40 211 Unmet medical needs 1.67 99 Insufficient food 18.15 240 Water and Sanitation 73.10 218 Satisfaction with water quality* 129 Lack of toilet in dwelling 0.23 54 Uncollected sewage 0.00 1 Sewage treatment 5.20 230 Shelter 61.70 180 Burdensome cost of housing 32.03 158 Satisfaction with housing 18.34 197 Overcrowding 19.84 192 Lack of adequate heating 9.85 184 Personal Safety 70.86 221 Homicide rate 1.27 173 Safety at night* 223 Traffic deaths 63.67 158 Access to Basic Knowledge 76.90 112 Secondary enrolment rate 0.93 156 Lower secondary completion only 13.67 53 Early school leaving 10.87 123 Access to Information and Communications 52.32 231 Internet at home 67.00 213 Broadband at home 62.00 229 Online interaction with public authorities 28.00 207 Health and Wellness 54.19 243 Life expectancy 76.40 242 General health status 59.42 235 Premature deaths from cancer 117.30 243 Premature deaths from heart disease 99.60 227 Unmet dental needs 2.73 121 Environmental Quality 43.29 157 Satisfaction with air quality* 251 Air pollution-pm10 21.40 146 Air pollution-pm2.5 16.05 171 Air pollution-ozone 116.09 169 Pollution, grime or other environmental problems 17.65 206 Protected land (Natura 2000) 25.86 79 Personal Rights 29.22 250 Trust in the political system 21.62 236 Trust in the legal system 23.46 157 Trust in the police 38.51 256 Quality and accountability of government services -0.98 233 Personal Freedom and Choice 59.18 221 Freedom over life choices* 168 Teenage pregnancy 2.14 234 Young people not in education, employment or training 15.73 201 Corruption -1.44 252 Tolerance and Inclusion 53.34 237 Impartiality of government services -0.67 212 Tolerance for immigrants* 216 Tolerance for minorities* 235 Attitudes toward people with disabilities 5.40 263 Tolerance for homosexuals* 199 Gender gap -18.23 246 Community safety net* 171 Access to Advanced Education 42.21 238 Tertiary education attainment 11.43 267 Tertiary enrolment 0.02 256 Lifelong learning 9.03 135 Severozápad Strengths and weaknesses are relative to 15 regions of similar GDP per capita: Campania; Western Greece; Northern Portugal; Western Transdanubia; Eastern Macedonia and Thrace; Central Moravia; Central Portugal; Estonia; Thessaly; West Wales and The Valleys; Calabria; Lithuania; Greater Poland; Northeast; Sicily *Raw data cannot be shown for Gallup indicators Score/value Score/value Score/value Score/value Rank Rank Rank Rank Underperforming OverperformingLess than one point under neutral Less than one point over neutralNeutral Czech Republic
  • 32. EU Regional Social Progress Index 61.54 186/272 GDP PPP per capita (2011) €16,700 219/272 Basic Human Needs 73.76 189 Foundations of Wellbeing 59.91 177 Opportunity 51.92 206 Nutrition and Basic Medical Care 83.00 157 Mortality rate before age 65 0.16 213 Infant mortality 3.00 76 Unmet medical needs 0.54 30 Insufficient food 10.94 199 Water and Sanitation 73.57 217 Satisfaction with water quality* 123 Lack of toilet in dwelling 1.15 188 Uncollected sewage 0.00 1 Sewage treatment 6.55 228 Shelter 64.25 172 Burdensome cost of housing 30.49 119 Satisfaction with housing 19.31 196 Overcrowding 17.66 188 Lack of adequate heating 5.43 97 Personal Safety 74.82 183 Homicide rate 0.71 51 Safety at night* 176 Traffic deaths 80.43 216 Access to Basic Knowledge 84.69 37 Secondary enrolment rate 0.95 115 Lower secondary completion only 7.90 17 Early school leaving 6.30 26 Access to Information and Communications 56.99 184 Internet at home 73.00 168 Broadband at home 67.00 190 Online interaction with public authorities 31.00 195 Health and Wellness 65.92 206 Life expectancy 78.25 216 General health status 58.83 239 Premature deaths from cancer 96.30 207 Premature deaths from heart disease 71.70 213 Unmet dental needs 1.30 17 Environmental Quality 37.09 227 Satisfaction with air quality* 126 Air pollution-pm10 22.15 166 Air pollution-pm2.5 17.27 189 Air pollution-ozone 120.32 206 Pollution, grime or other environmental problems 11.75 149 Protected land (Natura 2000) 14.46 162 Personal Rights 32.94 214 Trust in the political system 25.18 222 Trust in the legal system 22.32 165 Trust in the police 41.90 249 Quality and accountability of government services -0.44 192 Personal Freedom and Choice 69.81 153 Freedom over life choices* 164 Teenage pregnancy 1.07 151 Young people not in education, employment or training 8.63 75 Corruption -0.80 211 Tolerance and Inclusion 50.86 253 Impartiality of government services -0.15 166 Tolerance for immigrants* 260 Tolerance for minorities* 257 Attitudes toward people with disabilities 5.40 263 Tolerance for homosexuals* 219 Gender gap -15.87 233 Community safety net* 161 Access to Advanced Education 57.70 163 Tertiary education attainment 15.53 246 Tertiary enrolment 0.02 223 Lifelong learning 12.57 78 Severovýchod Strengths and weaknesses are relative to 15 regions of similar GDP per capita: Sicily; Greater Poland; Calabria; West Wales and The Valleys; Apulia; Estonia; Central Portugal; Central Moravia; Western Transdanubia; Silesia; Central Macedonia; Western Greece; Campania; Réunion; Northwest *Raw data cannot be shown for Gallup indicators Score/value Score/value Score/value Score/value Rank Rank Rank Rank Underperforming OverperformingLess than one point under neutral Less than one point over neutralNeutral Czech Republic
  • 33. EU Regional Social Progress Index 63.55 176/272 GDP PPP per capita (2011) €18,400 200/272 Basic Human Needs 74.43 185 Foundations of Wellbeing 59.96 176 Opportunity 56.92 173 Nutrition and Basic Medical Care 83.17 154 Mortality rate before age 65 0.15 202 Infant mortality 2.80 57 Unmet medical needs 0.60 33 Insufficient food 11.63 207 Water and Sanitation 72.62 220 Satisfaction with water quality* 161 Lack of toilet in dwelling 1.10 178 Uncollected sewage 0.00 1 Sewage treatment 9.44 224 Shelter 64.47 171 Burdensome cost of housing 25.09 85 Satisfaction with housing 20.37 192 Overcrowding 21.09 196 Lack of adequate heating 5.88 100 Personal Safety 78.13 157 Homicide rate 1.00 123 Safety at night* 137 Traffic deaths 64.96 167 Access to Basic Knowledge 92.48 5 Secondary enrolment rate 0.98 37 Lower secondary completion only 5.93 7 Early school leaving 3.67 4 Access to Information and Communications 56.99 184 Internet at home 73.00 168 Broadband at home 71.00 161 Online interaction with public authorities 27.00 212 Health and Wellness 66.13 205 Life expectancy 78.80 214 General health status 58.23 240 Premature deaths from cancer 92.10 198 Premature deaths from heart disease 66.70 210 Unmet dental needs 1.27 16 Environmental Quality 32.22 250 Satisfaction with air quality* 177 Air pollution-pm10 22.84 175 Air pollution-pm2.5 17.89 204 Air pollution-ozone 120.92 206 Pollution, grime or other environmental problems 13.50 173 Protected land (Natura 2000) 7.85 216 Personal Rights 35.50 196 Trust in the political system 26.36 214 Trust in the legal system 27.01 148 Trust in the police 44.88 241 Quality and accountability of government services -0.35 188 Personal Freedom and Choice 69.24 158 Freedom over life choices* 192 Teenage pregnancy 0.77 100 Young people not in education, employment or training 8.07 64 Corruption -0.80 211 Tolerance and Inclusion 53.23 240 Impartiality of government services 0.09 153 Tolerance for immigrants* 242 Tolerance for minorities* 248 Attitudes toward people with disabilities 5.40 263 Tolerance for homosexuals* 203 Gender gap -16.87 241 Community safety net* 198 Access to Advanced Education 73.98 91 Tertiary education attainment 20.87 194 Tertiary enrolment 0.06 1 Lifelong learning 9.20 128 Jihovýchod Strengths and weaknesses are relative to 15 regions of similar GDP per capita: Guadeloupe; Lincolnshire; Azores; Tees Valley and Durham; Central Bohemian Region; Alentejo; Basilicata; Andalusia; Crete; Martinique; South West Bulgaria; Eastern Slovenia; Southwest; Lower Silesia; Peloponnese *Raw data cannot be shown for Gallup indicators Score/value Score/value Score/value Score/value Rank Rank Rank Rank Underperforming OverperformingLess than one point under neutral Less than one point over neutralNeutral Czech Republic
  • 34. EU Regional Social Progress Index 61.41 187/272 GDP PPP per capita (2011) €16,500 222/272 Basic Human Needs 74.29 186 Foundations of Wellbeing 60.32 171 Opportunity 50.74 216 Nutrition and Basic Medical Care 81.71 185 Mortality rate before age 65 0.17 218 Infant mortality 2.70 50 Unmet medical needs 0.72 38 Insufficient food 11.40 205 Water and Sanitation 76.45 201 Satisfaction with water quality* 120 Lack of toilet in dwelling 1.33 192 Uncollected sewage 0.00 1 Sewage treatment 17.84 206 Shelter 63.07 177 Burdensome cost of housing 32.91 159 Satisfaction with housing 19.81 194 Overcrowding 19.17 190 Lack of adequate heating 5.98 101 Personal Safety 76.59 168 Homicide rate 1.14 155 Safety at night* 157 Traffic deaths 66.26 174 Access to Basic Knowledge 93.23 4 Secondary enrolment rate 1.00 1 Lower secondary completion only 7.77 15 Early school leaving 4.30 8 Access to Information and Communications 52.99 225 Internet at home 68.00 209 Broadband at home 66.00 202 Online interaction with public authorities 25.00 217 Health and Wellness 63.95 215 Life expectancy 78.05 220 General health status 55.25 256 Premature deaths from cancer 95.10 204 Premature deaths from heart disease 79.20 215 Unmet dental needs 1.37 19 Environmental Quality 37.62 222 Satisfaction with air quality* 158 Air pollution-pm10 27.38 231 Air pollution-pm2.5 21.82 245 Air pollution-ozone 120.42 206 Pollution, grime or other environmental problems 12.73 164 Protected land (Natura 2000) 28.84 56 Personal Rights 30.94 239 Trust in the political system 21.21 237 Trust in the legal system 19.94 173 Trust in the police 40.42 253 Quality and accountability of government services -0.44 192 Personal Freedom and Choice 68.49 164 Freedom over life choices* 189 Teenage pregnancy 0.82 107 Young people not in education, employment or training 8.73 76 Corruption -0.89 217 Tolerance and Inclusion 52.75 244 Impartiality of government services -0.23 172 Tolerance for immigrants* 248 Tolerance for minorities* 254 Attitudes toward people with disabilities 5.40 263 Tolerance for homosexuals* 204 Gender gap -15.73 232 Community safety net* 138 Access to Advanced Education 54.63 183 Tertiary education attainment 15.93 242 Tertiary enrolment 0.03 176 Lifelong learning 9.00 136 Strední Morava Strengths and weaknesses are relative to 15 regions of similar GDP per capita: Central Portugal; Estonia; West Wales and The Valleys; Western Transdanubia; Calabria; Greater Poland; Western Greece; Campania; Northeast; Northwest; Sicily; Apulia; Northern Portugal; Eastern Macedonia and Thrace; Silesia *Raw data cannot be shown for Gallup indicators Score/value Score/value Score/value Score/value Rank Rank Rank Rank Underperforming OverperformingLess than one point under neutral Less than one point over neutralNeutral Czech Republic
  • 35. EU Regional Social Progress Index 58.33 210/272 GDP PPP per capita (2011) €17,800 208/272 Basic Human Needs 68.83 217 Foundations of Wellbeing 53.70 235 Opportunity 53.12 195 Nutrition and Basic Medical Care 78.27 207 Mortality rate before age 65 0.20 229 Infant mortality 2.35 24 Unmet medical needs 0.80 42 Insufficient food 15.98 233 Water and Sanitation 70.06 234 Satisfaction with water quality* 189 Lack of toilet in dwelling 0.74 160 Uncollected sewage 0.00 1 Sewage treatment 0.49 235 Shelter 57.77 196 Burdensome cost of housing 33.97 162 Satisfaction with housing 16.04 220 Overcrowding 29.60 224 Lack of adequate heating 6.78 132 Personal Safety 70.03 228 Homicide rate 1.15 158 Safety at night* 231 Traffic deaths 63.38 156 Access to Basic Knowledge 90.23 16 Secondary enrolment rate 0.99 18 Lower secondary completion only 8.67 19 Early school leaving 5.60 21 Access to Information and Communications 52.32 231 Internet at home 68.00 209 Broadband at home 64.00 214 Online interaction with public authorities 25.00 217 Health and Wellness 54.00 245 Life expectancy 76.75 234 General health status 56.90 255 Premature deaths from cancer 105.20 224 Premature deaths from heart disease 94.30 223 Unmet dental needs 1.77 33 Environmental Quality 27.35 262 Satisfaction with air quality* 263 Air pollution-pm10 34.90 258 Air pollution-pm2.5 28.16 258 Air pollution-ozone 117.74 190 Pollution, grime or other environmental problems 19.52 211 Protected land (Natura 2000) 24.66 83 Personal Rights 35.85 195 Trust in the political system 27.58 210 Trust in the legal system 26.73 149 Trust in the police 44.87 242 Quality and accountability of government services -0.32 186 Personal Freedom and Choice 61.93 208 Freedom over life choices* 207 Teenage pregnancy 1.42 187 Young people not in education, employment or training 10.27 96 Corruption -1.36 245 Tolerance and Inclusion 52.99 243 Impartiality of government services -0.47 194 Tolerance for immigrants* 240 Tolerance for minorities* 245 Attitudes toward people with disabilities 5.40 263 Tolerance for homosexuals* 200 Gender gap -14.70 222 Community safety net* 236 Access to Advanced Education 64.28 123 Tertiary education attainment 16.40 236 Tertiary enrolment 0.04 80 Lifelong learning 11.23 93 Moravskoslezsko Strengths and weaknesses are relative to 15 regions of similar GDP per capita: Extremadura; Cornwall and Isles of Scilly; Réunion; North Aegean; Central Macedonia; Silesia; West Slovakia; Peloponnese; Lower Silesia; Apulia; Southwest; Eastern Slovenia; Sicily; Northeast; Greater Poland *Raw data cannot be shown for Gallup indicators Score/value Score/value Score/value Score/value Rank Rank Rank Rank Underperforming OverperformingLess than one point under neutral Less than one point over neutralNeutral Czech Republic
  • 36. EU Regional Social Progress Index 73.60 53/272 GDP PPP per capita (2011) €38,000 18/272 Basic Human Needs 85.85 39 Foundations of Wellbeing 66.84 72 Opportunity 68.83 80 Nutrition and Basic Medical Care 86.34 76 Mortality rate before age 65 0.10 17 Infant mortality 3.35 115 Unmet medical needs 1.77 102 Insufficient food 8.44 148 Water and Sanitation 97.61 50 Satisfaction with water quality* 76 Lack of toilet in dwelling 0.64 118 Uncollected sewage 0.00 1 Sewage treatment 97.42 60 Shelter 74.86 107 Burdensome cost of housing 19.06 41 Satisfaction with housing 33.54 124 Overcrowding 6.69 45 Lack of adequate heating 5.06 57 Personal Safety 85.37 35 Homicide rate 1.10 139 Safety at night* 24 Traffic deaths 37.65 61 Access to Basic Knowledge 83.91 47 Secondary enrolment rate 0.97 58 Lower secondary completion only 14.53 63 Early school leaving 9.10 80 Access to Information and Communications 72.50 83 Internet at home 87.00 74 Broadband at home 83.00 81 Online interaction with public authorities 47.00 109 Health and Wellness 76.89 41 Life expectancy 82.30 44 General health status 65.05 178 Premature deaths from cancer 67.20 34 Premature deaths from heart disease 35.50 87 Unmet dental needs 2.00 37 Environmental Quality 39.17 204 Satisfaction with air quality* 107 Air pollution-pm10 17.85 78 Air pollution-pm2.5 13.10 95 Air pollution-ozone 118.96 197 Pollution, grime or other environmental problems 22.65 229 Protected land (Natura 2000) 14.87 154 Personal Rights 55.03 41 Trust in the political system 49.52 86 Trust in the legal system 43.62 38 Trust in the police 65.22 106 Quality and accountability of government services 0.70 55 Personal Freedom and Choice 84.43 26 Freedom over life choices* 53 Teenage pregnancy 0.42 15 Young people not in education, employment or training 5.37 20 Corruption 1.04 36 Tolerance and Inclusion 74.80 103 Impartiality of government services 0.84 82 Tolerance for immigrants* 29 Tolerance for minorities* 65 Attitudes toward people with disabilities 7.60 128 Tolerance for homosexuals* 152 Gender gap -10.33 141 Community safety net* 91 Access to Advanced Education 62.90 132 Tertiary education attainment 31.70 84 Tertiary enrolment 0.03 142 Lifelong learning 8.97 137 Stuttgart Strengths and weaknesses are relative to 15 regions of similar GDP per capita: Southern and Eastern; Berkshire, Buckinghamshire and Oxfordshire; Åland; Salzburg; Bolzano; North Holland; Antwerp; Vorarlberg; Düsseldorf; Capital Region of Denmark; Lombardy; Aosta Valley; Bremen; Karlsruhe; Tyrol *Raw data cannot be shown for Gallup indicators Score/value Score/value Score/value Score/value Rank Rank Rank Rank Underperforming OverperformingLess than one point under neutral Less than one point over neutralNeutral Germany