More Related Content
Similar to Multifamily express pack report (8)
Multifamily express pack report
- 1. Multifamily Express Pack
Prepared by Todd Kuhlmann, CCIM
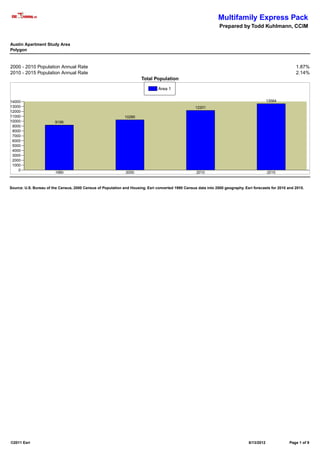
Austin Apartment Study Area
Polygon
2000 - 2010 Population Annual Rate 1.87%
2010 - 2015 Population Annual Rate 2.14%
Total Population
Area 1
14000 13564
13000 12201
12000
11000 10280
10000 9199
9000
8000
7000
6000
5000
4000
3000
2000
1000
0
1990 2000 2010 2015
Source: U.S. Bureau of the Census, 2000 Census of Population and Housing. Esri converted 1990 Census data into 2000 geography. Esri forecasts for 2010 and 2015.
©2011 Esri 8/13/2012 Page 1 of 9
- 2. Multifamily Express Pack
Prepared by Todd Kuhlmann, CCIM
Austin Apartment Study Area
Polygon
2000 Population by Sex
Males 52.5%
Females 47.5%
2010 Population by Sex
Males 52.7%
Females 47.3%
2015 Population by Sex
Males 52.9%
Females 47.1%
2010 Population by Race
Area 1
75.0
70.7
70.0
65.0
60.0
55.0
50.0
45.0
Percent
40.0
35.0
30.0
25.0
20.0 18.0
15.0
10.0
5.8
3.8
5.0 1.4 0.3
0.0
White Alone Black Alone Amer Indian Alone Asian/Pacific Alone Other Race Alone Two or More Races
2010 Hispanic Origin 13.3%
2010 Population 15+ by Marital Status
Total 12,142
Never Married 80.0%
Married 14.1%
Widowed 1.1%
Divorced 4.8%
2010 Population 25+ by Educational Attainment
Total 1,895
Less than 9th Grade 0.0%
9th - 12th Grade, No Diploma 2.7%
High School Graduate 7.1%
Some College, No Degree 16.7%
Associate Degree 2.8%
Bachelor's Degree 42.2%
Graduate/Professional Degree 28.5%
Data Note: Persons of Hispanic Origin may be of any race
Source: U.S. Bureau of the Census, 2000 Census of Population and Housing. Esri forecasts for 2010 and 2015.
©2011 Esri 8/13/2012 Page 2 of 9
- 3. Multifamily Express Pack
Prepared by Todd Kuhlmann, CCIM
Austin Apartment Study Area
Polygon
2000 Population by Age
Total 10,284
0-4 0.3%
5-9 0.1%
10 - 14 0.1%
15 - 19 23.9%
20 - 24 58.9%
25 - 34 11.2%
35 - 44 2.7%
45 - 54 1.4%
55 - 64 0.5%
65 - 74 0.4%
75 - 84 0.2%
85+ 0.1%
2010 Population by Age
Total 12,203
0-4 0.3%
5-9 0.1%
10 - 14 0.1%
15 - 19 21.7%
20 - 24 62.3%
25 - 34 10.5%
35 - 44 2.1%
45 - 54 1.4%
55 - 64 0.7%
65 - 74 0.4%
75 - 84 0.2%
85+ 0.2%
2015 Population by Age
Total 13,568
0-4 0.3%
5-9 0.1%
10 - 14 0.1%
15 - 19 19.9%
20 - 24 63.7%
25 - 34 10.9%
35 - 44 2.0%
45 - 54 1.3%
55 - 64 0.7%
65 - 74 0.5%
75 - 84 0.2%
85+ 0.2%
Median Age
2000 22.2
2010 22.2
2015 22.3
Source: U.S. Bureau of the Census, 2000 Census of Population and Housing. Esri forecasts for 2010 and 2015.
©2011 Esri 8/13/2012 Page 3 of 9
- 4. Multifamily Express Pack
Prepared by Todd Kuhlmann, CCIM
Austin Apartment Study Area
Polygon
2000 - 2010 Civilian Employed Population 16+ Annual 0.06%
Rate
2010 - 2015 Civilian Employed Population 16+ Annual 2.37%
Rate
Total Civilian Employed Population 16+
Area 1
5500 5265
5000 4658 4684
4500
4000
3500 3265
3000
2500
2000
1500
1000
500
0
1990 2000 2010 2015
Source: U.S. Bureau of the Census, 2000 Census of Population and Housing. Esri converted 1990 Census data into 2000 geography. Esri forecasts for 2010 and 2015.
©2011 Esri 8/13/2012 Page 4 of 9
- 5. Multifamily Express Pack
Prepared by Todd Kuhlmann, CCIM
Austin Apartment Study Area
Polygon
2010 Employed Civilian Population 16+ by Industry
Area 1
Percent
0.0 2.0 4.0 6.0 8.0 10.0 12.0 14.0 16.0 18.0 20.0 22.0 24.0
Agriculture, Forestry, Fishing, and Hunting 0.0
Mining 0.0
Construction 1.3
Manufacturing 3.2
Wholesale Trade 0.6
Retail Trade 11.7
Transportation/Warehousing 0.2
Utilities 0.1
Information 4.5
Finance/Insurance 2.4
Real Estate/Rental/Leasing 2.5
Professional, Scientific, and Technical Services 10.9
Management of Companies/Enterprises 0.0
Admin., Support, and Waste Mgmt. Services 1.2
Educational Services 23.0
Health Care/Social Assistance 7.1
Arts/Entertainment/Recreation 4.6
Accommodation/Food Services 20.4
Other Services 2.7
Public Administration 3.4
Data Note: Industry descriptions based on 2000 Census of Population and Housing definitions.
Source: Esri forecasts for 2010.
©2011 Esri 8/13/2012 Page 5 of 9
- 6. Multifamily Express Pack
Prepared by Todd Kuhlmann, CCIM
Austin Apartment Study Area
Polygon
2000 - 2010 Population by Industry Annual Rate
Area 1
Percent
-4.00 -3.00 -2.00 -1.00 0.00 1.00 2.00 3.00 4.00 5.00 6.00
Agriculture, Forestry, Fishing, and Hunting 0.00
Mining 0.00
Construction 0.57
Manufacturing -2.92
Wholesale Trade -1.34
Retail Trade -0.76
Transportation/Warehousing 5.01
Utilities -1.65
-4.39
Information
Finance/Insurance 0.60
Real Estate/Rental/Leasing 0.28
Professional, Scientific, and Technical Services -0.17
Management of Companies/Enterprises 0.00
Admin., Support, and Waste Mgmt. Services 2.70
Educational Services 0.04
Health Care/Social Assistance 1.78
Arts/Entertainment/Recreation 1.92
Accommodation/Food Services 1.33
Other Services -0.97
Public Administration 1.46
Data Note: Industry descriptions based on 2000 Census of Population and Housing definitions.
Source: Esri forecasts for 2010.
©2011 Esri 8/13/2012 Page 6 of 9
- 7. Multifamily Express Pack
Prepared by Todd Kuhlmann, CCIM
Austin Apartment Study Area
Polygon
2000 - 2010 Households Annual Rate 2.09%
2010 - 2015 Households Annual Rate 2.65%
Total Households
Area 1
6500 6348
6000 5569
5500
5000 4599
4500
4000 3893
3500
3000
2500
2000
1500
1000
500
0
1990 2000 2010 2015
Source: U.S. Bureau of the Census, 2000 Census of Population and Housing. Esri converted 1990 Census data into 2000 geography. Esri forecasts for 2010 and 2015.
©2011 Esri 8/13/2012 Page 7 of 9
- 8. Multifamily Express Pack
Prepared by Todd Kuhlmann, CCIM
Austin Apartment Study Area
Polygon
2010 Household Income
Area 1
Percent
0.0 5.0 10.0 15.0 20.0 25.0 30.0 35.0 40.0 45.0 50.0 55.0 60.0 65.0
<$15,000 61.6
$15,000 - $19,999 7.7
$20,000 - $24,999 6.6
$25,000 - $29,999 5.1
$30,000 - $34,999 2.6
$35,000 - $39,999 2.6
$40,000 - $44,999 2.4
$45,000 - $49,999 2.4
$50,000 - $59,999 2.5
$60,000 - $74,999 1.9
$75,000 - $99,999 1.5
$100,000 - $124,999 1.3
$125,000 - $149,999 0.6
$150,000 - $199,999 0.5
$200,000 - $249,999 0.5
$250,000 - $499,999 0.1
$500,000+ 0.0
Median Household Income
2000 $10,000
2010 $10,131
2015 $11,058
2000 - 2010 Median Household Income Annual Rate 0.14%
2010 - 2015 Median Household Income Annual Rate 1.77%
2010 Median Net Worth $8,057
Data Note: Detail may not sum to totals due to rounding. Income represents annual income for the preceding year. Income for 2010 and 2015 is expressed in current
dollars, including an adjustment for inflation.
Source: U.S. Bureau of the Census, 2000 Census of Population and Housing. Esri forecasts for 2010 and 2015.
©2011 Esri 8/13/2012 Page 8 of 9
- 9. Multifamily Express Pack
Prepared by Todd Kuhlmann, CCIM
Austin Apartment Study Area
Polygon
2000 Housing Units 4,734
Owner Occupied Housing Units 6.9%
Renter Occupied Housing Units 90.3%
Vacant Housing Units 2.9%
2010 Housing Units 6,002
Owner Occupied Housing Units 6.0%
Renter Occupied Housing Units 86.8%
Vacant Housing Units 7.2%
2015 Housing Units 6,911
Owner Occupied Housing Units 5.8%
Renter Occupied Housing Units 86.0%
Vacant Housing Units 8.1%
2010 Housing Units
Area 1
90.0 86.8
80.0
70.0
60.0
50.0
Percent
40.0
30.0
20.0
10.0 7.2
6.0
0.0
Owner Occupied Renter Occupied Vacant
Median Home Value
2000 $103,804
2010 $126,961
2015 $132,292
Data Note: Detail may not sum to totals due to rounding.
Source: U.S. Bureau of the Census, 2000 Census of Population and Housing. Esri forecasts for 2010 and 2015.
©2011 Esri 8/13/2012 Page 9 of 9