SAR Long & Short Volatility Strategy Factsheet 2011 10 31

SAR Long & Short Volatility SAR applies a quantitative intraday strategy that trades implied volatility of the S&P 500 Index. It takes directional long & short trades in VIX Futures and related ETN`s. The system is 100% systematic, price driven and its order execution is fully computer automated. Two redundant execution server are set up in two low latency professional server housings. Gross exposure is limited to 100% of NAV intraday and 0% overnight. There is a maximum of one long and one short trade per day. The system is designed to capture a positive roll yield in VX Future front month when term structure is in contango and to provide upside volatility during times of stock market stress and increasing S&P 500 Index downside volatility. The strategy is available via managed accounts only. Key strategy characteristics: • Directional Long & Short Implied U.S. S&P 500 Index Volatility ETFs • Quantitative intraday pattern recognition strategy • Not leveraged • Intraday only - 100% in cash overnight • Long volatility profile • Negatively correlated • Pure alpha returns • Daily liquidity • Full position transparency • Low funding level required with a notionally funded managed account
Recommended

Recommended
More Related Content
Featured
Featured (20)
SAR Long & Short Volatility Strategy Factsheet 2011 10 31
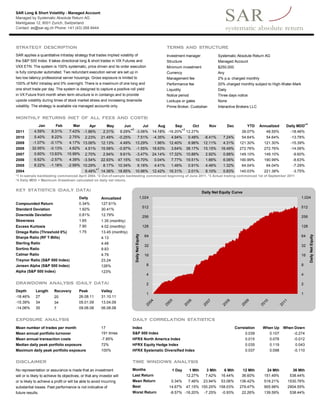
- 1. SAR Long & Short Volatility - Managed Account Managed by Systematic Absolute Return AG Marktgasse 12, 8001 Zurich, Switzerland Contact: as@sar-ag.ch Phone: +41 (43) 268 8444 STRATEGY DESCRIPTION TERMS AND STRUCTURE SAR applies a quantitative intraday strategy that trades implied volatility of Investment manager Systematic Absolute Return AG the S&P 500 Index. It takes directional long & short trades in VIX Futures and Structure Managed Account VXX ETN. The system is 100% systematic, price driven and its order execution Minimum investment $250,000 is fully computer automated. Two redundant execution server are set up in Currency Any two low latency professional server housings. Gross exposure is limited to Management fee 2% p.a. charged monthly 100% of NAV intraday and 0% overnight. There is a maximum of one long and Performance fee 20% charged monthly subject to High-Water-Mark one short trade per day. The system is designed to capture a positive roll yield Liquidity Daily in VX Future front month when term structure is in contango and to provide Notice period Three days notice upside volatility during times of stock market stress and increasing downside Lockups or gates None volatility. The strategy is available via managed accounts only. Prime Broker, Custodian Interactive Brokers LLC MONTHLY RETURNS (NET OF ALL FEES AND COSTS) 4 Jan Feb Mar Apr May Jun Jul Aug Sep Oct Nov Dec YTD Annualized Daily MDD* 2 3 2011 4.59% 8.31% 7.43% -1.86% 2.31% 9.29%* -3.06% 14.18% -16.20%* 12.27% 39.07% 48.55% -18.46% 2010 5.40% 8.22% 2.75% 2.23% 21.49% -0.25% 7.51% -4.35% 4.94% 0.48% -8.41% 7.24% 54.64% 54.64% -13.78% 2009 -1.07% -0.17% 4.17% 13.06% 12.13% 4.49% 13.29% 1.96% 12.40% 6.96% 12.11% 4.31% 121.30% 121.30% -15.39% 2008 32.95% -0.13% 4.62% 4.51% 15.58% -0.97% -1.55% 18.63% 3.64% 38.17% 15.15% 16.49% 272.76% 272.76% -14.06% 2007 0.60% 13.83% 15.99% 2.70% 2.94% 9.61% -3.47% 24.14% 17.32% 10.88% 2.92% 0.88% 149.10% 149.10% -9.60% 2006 6.62% -2.57% 4.39% -3.54% 22.93% 47.15% 10.70% 0.04% 7.77% 19.51% 1.66% 6.06% 190.99% 190.99% -8.63% 2005 8.22% -1.18% -2.99% 10.29% 8.17% 10.34% 6.16% 4.41% 1.46% 0.91% 4.46% 1.32% 64.04% 64.04% -7.29% 1 2004 9.48%* 14.36% 18.85% 10.96% 12.42% 16.31% 2.01% 8.10% 0.83% 140.03% 221.38% -3.75% *1 In-sample backtesting commenced April 2004. *2 Out-of-sample backtesting commenced beginning of June 2011. *3 Actual trading commenced 1st of September 2011 *4 Daily MDD = Maximum Drawdown calculated on daily net retuns. KEY STATISTICS (DAILY DATA) Daily Net Equity Curve Daily Annualized 1,024 1,024 Compounded Return 0.34% 127.61% 512 512 Standard Deviation 1.92% 30.41% Downside Deviation 0.81% 12.79% 256 256 Skewness 1.65 1.35 (monthly) Excess Kurtosis 7.90 4.02 (monthly) 128 128 Omega Ratio (Threshold 0%) 1.75 13.45 (monthly) Daily Net Equity Daily Net Equity Sharpe Ratio (RF T-Bills) 4.13 64 64 Sterling Ratio 4.48 32 32 Sortino Ratio 9.83 Calmar Ratio 4.79 16 16 Treynor Ratio (S&P 500 Index) 23.24 Jensen Alpha (S&P 500 Index) 126% 8 8 Alpha (S&P 500 Index) 123% 4 4 DRAWDOWN ANALYSIS (DAILY DATA) 2 2 Depth Length Recovery Peak Valley 1 1 -18.46% 27 20 26.08.11 31.10.11 -15.39% 34 34 05.01.09 13.04.09 -14.06% 35 7 09.06.08 06.08.08 EXPOSURE ANALYSIS DAILY CORRELATION STATISTICS Mean number of trades per month 17 Index Correlation When Up When Down Mean annual portfolio turnover 191 times S&P 500 Index 0.039 0.107 -0.274 Mean annual transaction costs -7.85% HFRX North America Index 0.015 0.078 -0.012 Median daily peak portfolio exposure 72% HFRX Equity Hedge Index 0.035 0.119 0.043 Maximum daily peak portfolio exposure 100% HFRX Systematic Diversified Index 0.037 0.098 -0.110 DISCLAIMER TIME WINDOWS ANALYSIS No representation or assurance is made that an investment Months 1 Day 1 Mth 3 Mth 6 Mth 12 Mth 24 Mth 36 Mth will or is likely to achieve its objectives, or that any investor will Last Return 12.27% 7.42% 16.44% 36.60% 151.49% 538.44% or is likely to achieve a profit or will be able to avoid incurring Mean Return 0.34% 7.46% 23.94% 53.06% 136.42% 518.21% 1530.76% substantial losses. Past performance is not indicative of Best 14.67% 47.15% 100.25% 158.03% 279.47% 905.98% 2904.55% future results. Worst Return -8.57% -16.20% -7.25% -0.93% 22.26% 139.59% 538.44%