Social Network Analysis Using Gephi
•Download as PPTX, PDF•
5 likes•6,137 views

The document discusses social network analysis using the Gephi software tool. It defines social networks and explains that social network analysis studies network structure and behavior. It also defines networks and graphs. The document then explains Gephi's functions for analyzing networks through measures like degree centrality, community detection algorithms, and network visualization capabilities. It provides steps for importing a network into Gephi and using functions like layout, ranking, filtering, and labeling to visualize communities and analyze the network.

Recommended
More Related Content
What's hot
What's hot (20)
Similar to Social Network Analysis Using Gephi
Similar to Social Network Analysis Using Gephi (20)
More from Goa App
More from Goa App (20)
Recently uploaded
Recently uploaded (20)
Social Network Analysis Using Gephi
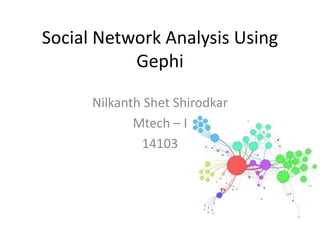
- 1. Social Network Analysis Using Gephi Nilkanth Shet Shirodkar Mtech – I 14103
- 2. Social Networks • A social network is a social structure of people, related (directly or indirectly) to each other through a common relation or interest • Social network analysis (SNA) is the study of social networks to understand their structure and behavior
- 3. Network or Graph ? • Network often refers to real systems Web, Socialnetwork, Metabolic network Language: Network, node, link • Graph is mathematical representation of a network Web graph, Social graph (Facebook or twitter) Language: Graph, vertex, edge
- 4. • Communication networks: Intrusion detection, fraud detection • Social networks: • Link prediction, friend recommendation • Social circle detection • Social recommendations • Identify the network of an individual • community detection
- 5. Graph types • Undirected graph – Facebook friendships • Directed graph – Twitter: follow and be followed
- 6. Gephi • Gephi is an open source tool designed for the interactive exploration and visualization of networks • Designed to facilitate the user’s exploratory process through real-time analysis and visualization • Visualization module uses a 3D render engine • Highly scalable can handle over 20,000 nodes
- 7. Graph measures • Degree – In-degree – Out-degree • Graph structure measures – Clustering (global and local) – Network diameter • Centrality Measures – Eigenvector centrality – PageRank • Community measures – Modularity
- 8. Degree Centrality • In-Degree : The number of edges entering the node. – Size of Node (Mention) • Out-Degree : The number of edges leaving the node. – Twitter User Mention other
- 9. Statistics Degree: Calculate the number of links has a node Degree weighted: Calculates the average number of links can have node. ( Degree Distribution, In-Degree Distribution, Out-Degree Distribution ) Diameter : is the longest distance between two network nodes. Closeness centrality: Measures the average distance between a node and all other nodes.
- 10. • Density : determines the percentage of network complementarity. • Modularity : identifying groupings to highlight the communities in a network • Eigenvector centrality: measures the importance of a node in the network according to its connections • Related Components: determines the number of connected components in the network
- 11. Gephi Processes • 1. Open • 2. Layout • 3. Ranking • 4. Statistics • 5. Rank (Modularity, Indegree and Outdegree) • 6. Layout (Size Adjust) • 7. Labels • 8. Community Detection • 9. Filter • 10. Label Adjust • 11. Preview • 12. Export
- 12. Gephi: Layout • From the Layout module on the left side, choose Force Atlas from the dropdown menu, then click Run • Force Atlas makes the connected nodes attracted to each other and pushes the unconnected nodes apart to create clusters of connections • Click Stop when it seems as if you have some distinct clusters of nodes
- 13. Force Atlas : Individual Nodes are Outside and Communities are coming to center
- 14. Gephi: Rank(Modularity) • Ranking in the top left module, and click Choose a rank parameter from the drop- down such as Modularity, Indegree and out degree. • Set Min Size to 10 and Max Size to 150 • Set Min Size to 5 and Max Size to 200 • Min and Max size depends on the nature of your network. • Click Apply to change the node sizes according to their Modularity
- 16. Gephi: Community Detection • Go back to the Statistics tab on the right and click Run next to Modularity • This creates a modularity class value for each node, which we’ll use to colorize the communities • Click Apply to colorize the detected communities
- 17. Gephi: Filter • Go to Filters in the top right module and open the Library Partition Count Modularity Class • Filter option basically removes the “leaves” in the network that are not connected to many other nodes
- 18. Gephi: Label Adjust • The Gephi recommended to run a final layout adjustment before the export that makes it easier to read the labels. • “Label Adjust” works much the same as the size adjustment, moving the nodes so the labels are readable
- 19. Visualized twitter network community clusters
- 20. Calculating Basic Network Metrics Basic network, node, and edge metrics can be calculated using the statistics window.
- 21. Laying out the Network in Gephi The network will load in a random cluster of nodes. The first step will be to choose a layout to make the network more visible. Choose layout option and select Force Atlas
- 22. • The Social Network Analysis is a useful and effective instrument for revealing the main specificity of the human's relationships of the social groups. • Software Gephi is the applicable tool for visualizing revealed people's interactions and the relational dimension of the communities inside the social groups.
- 23. REFERENCES • [1] M. Bastian, S. Heymann, and M. Jacomy. Gephi: An open source software for exploring and manipulating networks. In Proc. 3rd International Conference on Weblogs and Social Media (ICWSM09), pages 361-362. AAAI, 2009. • [2] S. Bickel and T. Scheffer. Multi-view clustering. In Proc. 4th IEEE International Conference on Data Mining (ICDM 04), pages 19-26, 2004. • [3] D. Cai, Z. Shao, X. He, X. Yan, and J. Han. Mining hidden community in heterogeneous social networks. In Proc. 3rd International Workshop on Link Discovery, pages 58-65, 2005. • [4] C. Ding and X. He. K-nearest-neighbor consistency in data clustering: Incor- porating local information into global optimization. In Proc. ACM Symposium on Applied Computing (SAC04), pages 584-589, 2004. • [5] D. Greene and P. Cunningham. Multi-view clustering for mining heterogeneous social network data. In Workshop on Information Retrieval over Social Networks, 31st European Conference on Information Retrieval (ECIR09), 2009.