SlideShare a Scribd company logo
1 of 87
Download to read offline
Intracardiac Electrograms (IEGM)
      and Catheter Positions


1
Unipolar Recording
                          V1 lead used for
                            the negative
                          (reference) pole
       -

           +


                          Catheter with the
                         positive electrode
                         placed in the heart


2
Bipolar Recording


3
Bipolar Electrograms


4
Bipolar Electrogram Construction
        Unipolar                                      Bipolar

Uni 1     -                                            -
                    -              =
Uni 2         +                                            +
                   Uni1 (+) – Uni2 (-) = Bipolar


                                          Bipole

                                        Uni-distal


                                       Uni-proximal
  5
Bipolar signal construction


                                       +
                                           Differential
                                            amplifier


  t1 t2 t3 t4 t5 t6 t7 t8 t9 t10 t11   -                  t1 t2 t3 t4 t5 t6 t7 t8 t9


(Signal 1 + Noise) – (Signal 2 + Noise) = Signal 1 – Signal 2

 6
Bipolar EGMs


    Bi

E1


E2


7
Electrophysiology of the cardiac muscle cell


8
Affect of the Direction of
   Activation on the Electrogram


9 http://www.vetgo.com/cardio/concepts/concsect.php?sectionkey=5&section=Electrocardiology
Direction of Activation and its Influence on
                      the Bipolar ECG
+– – – – – – – – – – – – – – – – – – – – – – – –
+– – – – – – – – – – – – – – – – – – – – – – – –
+– – – – – – – – – – – – – – – – – – – – – – – –
+– – – – – – – – – – + – – – – – – – – – – – – –
                     –         -

+– – – – – – – – – – – – – – – – – – – – – – – –
+– – – – – – – – – – – – – – – – – – – – – – – –
+– – – – – – – – – – – – – – – – – – – – – – – –
+– – – – – – – – – – – – – – – – – – – – – – – –
+– – – – – – – – – – – – – – – – – – – – – – – –
+– – – – – – – – – – – – – – – – – – – – – – – –
   10
Direction of Activation and its Influence on
                    the Bipolar ECG
–––––––––––––––––––––––+                     –
–––––––––––––––––––––––+                     –
–––––––––––––––––––––––+                     –
– – – – – – – – – –+ – – – – – – – – – – – – +
                   –          -              –
–––––––––––––––––––––––+                     –
–––––––––––––––––––––––+                     –
– – – – – – – – – – – – – – – – – – – – – – –+
                                             –
– – – – – – – – – – – – – – – – – – – – – – –+
                                             –
– – – – – – – – – – – – – – – – – – – – – – –+
                                             –
– – – – – – – – – – – – – – – – – – – – – – –+
 11
                                             –
Direction of Activation and its Influence on the Bipolar ECG


   –––––––––––––––––––––––––––––––––––
   –––––––––––––––––––––––––––––––––––
   –––––––––––––––––––––––––––––––––––
   –––––––––––––––––––––––––––––––––––
   –––––––––––––––––––––––––––––––––––
   – – – – – – – – – – – – – – + – – – – – – – –- – – – – – – – – – – – –
                               –
   –––––––––––––––––––––––––––––––––––
                              A       B       C
   –––––––––––––––––––––––––––––––––––
   –––––––––––––––––––––––––––––––––––
   –––––––––––––––––––––––––––––––––––
   –––––––––––––––––––––––––––––––––––
   –––––––––––––––––––––––––––––––––––
   –––––––––––––––––––––––––––––––––––
   –––––––––––––––––––––––––––––––––––
12 – – – – – – – – – – – – – – – – – – – – – – – – – – – – – – – – – – –
Unipolar Electrograms


13
Influence of individual cells on the
              Unipolar Electrogram
     The influence of any active cell upon the
     unipolar recording is inversely
     proportional to the distance between the
     cell and the electrode
     Because activation propagates from
     cell-to-cell, active cells are organized
     along a wave “front”
     Consequently, the unipolar electrogram        AP
     is a summation of membrane currents


                                                 unipolar


14
Unipolar versus Action Potential


15
Comparison of Bipolar versus
        Unipolar Recording


16
Comparison of Unipolar versus
         Bipolar Recording
                     E1      E2


      Unipolar recordings measure an amplified
       version of voltage at a single electrode (E1)
       and retain both near and far field signal
       components
      Bipolar recordings measure the amplified
       difference between two unipolar electrodes
       (E1 - E2), which reduces common-mode
       noise and far-field signal components
17
Unipolar versus Bipolar
                    E1      E2


      Bipolar recordings approximate a
       measure of the rate-of-change of the
       wavefront
      This measure is approximate because
       cardiac wavefronts do not propagate
       uniformly and the medium is not ideal


18
Propagating Activation
     Wavefront


19
Propagating Activation
     Wavefront
        Depol. toward positive electrode   Repol. toward positive electrode
                 Positive Signal                    Negative Signal


     Depol. away from positive electrode    Repol. Away from positive electrode
              Negative Signal                         Positive Signal
20
Comparison of the Filtered and unfiltered Unipolar and Bipolar
                         Recordings


  • Note the peak negative slope indicated by the arrow in the unfiltered
    unipolar recording corresponds to the indicated negative peak in the
21 highpass-filtered unipole, confirming the approximation to rate-of-change.
Comparison of the Filtered and unfiltered Unipolar and Bipolar
                         Recordings


 • Note the brief occurrence of the zero slope (arrow) in the unfiltered unipole
   which corresponds with the zero-crossing and phase-reversal of the
   highpass-filtered unipole. It also corresponds to the zero crossing of the
22 unfiltered bipole and the most positive peak of the filtered (32Hz) bipole.
Unipolar versus Bipolar Recording

      Physical basis of electrograms - Summary
       – The unipole records the perspective-view of the
         wavefront
           Wavefront = summation of the action potentials over space and time
           Action potential = generated by membrane ion currents

       – The bipole records the derivative (slope) of the unipole
       – Bipolar recording (spatial) and the highpass filter
         (temporal) are correlated, and have a lower sensitivity to
         low frequencies (slow conduction) and higher sensitivity
         to high frequencies (fast conduction)


23
24
25
26
Signal Filtering


                                 Noise


 Problems influencing the signal fidelity:
   – Signal to noise ratio
   – Distortion of the signal
 To limit these a properly designed amplification system with
27 filters is required
Filtering
                           The leads record the raw electrical potential data
                           and send it to the amplifier.


                           The Amplifier increases the amplitude of the signals
         Amplifier         (often up to a factor of 10000).


                           The high-pass filter removes any base line drift or
     High Pass Filter      physiologic noise by cutting off anything below a set
                           value.

                           An isolation amplifier isolates the circuit from the
     Isolation Amplifier   patient (this can be done by transmitting the signals
                           optically).

                           The low-pass filter removes any environmental noise
      Low Pass Filter      by cutting off anything above a certain value.


                           The resultant signal is either the surface EKG or
                           intracardiac signals of interest.

28
Filtering
      Surface ECG signals are concentrated in
       the bandwidth between 1Hz - 80Hz.
      Intracardiac ECG signals are
       concentrated in the bandwidth between
       15 - 60Hz
      High Resolution ECG signals are
       concentrated between a bandwidth of
       0.05Hz - 300Hz


29
Filtering


30
Filtering
                              ECG data filtered with 60Hz Notch Filter

                 0.35

                  0.3

                 0.25

                  0.2
     Magnitude


                                                                         unfiltered ECG
                 0.15
                                                                         filtered ECG
                  0.1

                 0.05

                    0
                         0   0.2   0.4   0.6      0.8    1   1.2   1.4
                 -0.05
                                         Frequency (f)


31
Filtering – Lowpass Filter
       Lowpass Filter


                 V                     Corner Frequency


                               (Passes LF)


                                     Pass-band              Stop-band
                                                                        f
                                                   cutoff frequency
                                                    (250 - 500 Hz)


A lowpass filter allows lower frequencies to pass through while reducing higher
frequencies, relative to an upper cutoff frequency. In conventional electrophysiology,
this cutoff (corner) frequency is typically in the range of 250 to 500 Hz.
32
Filtering
       Highpass Filter
       Highpass
       Lowpass Filter


               V               Corner Frequency


                    repol      (Passes LF) (Passes HF)
                                    depol


                        Stop-band               Pass-band
                              cutoff freq          cutoff freq
                                                                  f
                            cutoff frequency
                             (30 - 32 Hz)        (250 - 500 Hz)
                              (30 - 32 Hz)


The highpass filter is the exact opposite of the lowpass filter in which higher
frequencies are now allowed to pass through while reducing lower
frequencies, relative to a lower cutoff (corner) frequency, which is typically
33 Hz.
30
Bandpass Filtering
          Combined = Bandpass Filter (passes depolarization)


                               physiologic                    environmental
                    V


                           repol           depol


                                    Highpass                   Lowpass
                                    cutoff freq                cutoff freq           f
                                   (30 - 32 Hz)              (250 - 500 Hz)


•The highpass reduces signal components related to physiologic noise, i.e., repolarization.
Thus the intent of these filter settings is to allow signal components related to depolarization to
pass.
•The lowpass section of the bandpass filter is intended to reduce environmental noise.
 34
Filtering

          Subtle point about highpass section:


                      V


                                         32 Hz                                               f
                                ~16 Hz             ~64 Hz


• The bandpass filters actually exhibit a gradual response to frequency, as shown in the figure, rather than
  an idealized, straight-line response
• Frequencies below 16Hz (green), are reduced enough by the filter that they are essentially insignificant.
• At frequencies approximately twice the cutoff frequency (in this case 64 Hz) there is a range of frequencies
  above this point in which the response of the filter is fairly flat and the signal components are passed
 35
  through essentially unchanged.
Filtering
          Subtle point about highpass section:


                                  approximates the derivative
                    V


                                          Depolarization


                                                                                  f
                             ~16 Hz        ~64 Hz


• The red line shows a special filter response which computes the time-derivative of the signal.
• The gradual response of the highpass filter between 16 to 64 Hz is a reasonable approximation
  of the rate-of-change for signal components that fall into that range of frequencies.
• The majority of the signal energy related to depolarization falls between 15-60 Hz. Thus unipolar
  recordings made with a highpass filter set at 32 Hz are correlated with wavefront change. Note
  both the highpass filtered unipole and the unfiltered bipole are both correlated with wavefront
  36
  change.
Clinical use of Unipolar
            Recording


37
Expected Electrogram Progression

                    wavefront
                A                                                  “QS”
                    receding      Schematic Representation of RA


                             Stimulation of HRA portrays endocardial
                           breakthrough from the SA node network with
                                 typical waveform morphologies:
 50% – 50%
approaching &   B                       • early “QS”               “RS”
  receding
                                        • mid “RS”
                                        • late   “R”


                     wavefront
                C   approaching                                    “R”


38
Actual Electrogram Progression
Sinus Rhythm
                                                “QS
 SA Node                                        ”
                    A


                B


           C


 39
Actual Electrogram Progression
Sinus Rhythm
                                                “QS
                                                ”
                    A


                B       Mid Lateral             “RS”


           C


 40
Actual Electrogram Progression
Sinus Rhythm
                                                “QS
                                                ”
                    A


                B                               “RS”


           C

                        IVC Junction            “R”

 41
R Wave Amplitude is Dependent on the Amount
         of Myocardium Involved

        Large mass          Small mass
        myocardial          myocardial
        recruitment         recruitment


        Large mass or      Large mass or
       distance = Large   distance = Large
           amplitude          amplitude

42
Amplitude of the ECG is effected by the size of
               the Myocardium


43
Myocardial Characteristics and the Bipolar ECG

                           1. If the tissue is diseased
                             it will exhibit low-
                             frequency low amplitude
Healthy
                             electrograms, but if
                             healthy it will have high
                             frequency high-
                             amplitude electrograms
Disease
d                          2. With a set distance
                             between the two
                             electrodes of the bipolar
 Dead                        ECG, you can see the
                             activation time and thus
                             it tells you conduction
                             speed
44
R Wave Width is Dependent on the Conduction
                  Speed


         Wide R Wave               Narrow R Wave


        Slow conduction         Rapid conduction such as
       across diseased or      with myocardial recruitment
      deep tissue results in   post-exit results in a narrow
        a wide duration                   duration

45
Unipolar Recording: Circus Movement

                                         CL
                                     1
                1
                                                  CL Start
                                     2

      2                    4
                                     3

                3
                                     4

 The red loop represents one cycle   1
   length (CL) of the tachycardia
                                         CL End
46
Unipolar Recording: Circus Movement

                                          • The electrogram is a result of the
                   1                        activation from “A” and “B”
                                              • “A” = activation moving
                                                toward the electrode
                                              • “B” = activation moving away
                                                from the electrode
        B
                                          A
                                                      CL
                                                               CL End
                                          A

The red loop represents one cycle
  length (CL) of the tachycardia
                                                  B
                               CL Start
                                              1            1            1
   47
Q wave (qs-RS) pattern

                           • QS Pattern at the arrhythmia
                             focus site


                          • A qs-RS pattern can occur when:
                              • There is a preferential pathway from the
                                arrhythmia focus
                              • Activation proceeds from a low to high
                                current generating region
                              • There is myocardium exhibiting
                                anisotropic conduction


Normally an arrhythmia focus has a negative deflection resulting in a QS
Pattern, but that is not always true
48
Unipolar Recording: Within Small Conducting
                  Channel

 Preferential pathway
  from the arrhythmia
  focus
     – Two components of             Breakout site
       activation occur:
           Slow confined
            conduction
                               *     with large and
                                    rapid activation

           Rapid myocardial
            breakout
            conduction


49
Double Potentials


50
Double Potentials

 Barriers to
                                                 Turn around
 conduction
                                                    point


                              3


                              2


                              1

     *
                                      Bipolar ECG        Unipolar ECG

     Turn around point = end of a fixed or functional barrier such as scar
51
     tissue (fixed) or the crista terminalis (functional)
Double Potentials


52
Double Potentials

 Barriers to
 conduction                   Bipolar ECG   Unipolar ECG

                         3


                         2


                         1

     *
               Area of slow
               conduction

53
Flatline Between Double Potentials
          Slow conduction zone (SCZ)


                         *
         SCZ                           +
                                       +
                               *       +


                                           +
                                           +
          SCZ                              +


54
                                               *
Double Potentials
      Double potentials are indicative of a line of
       block
      Crista terminalis is an important anatomical
       and functional barrier in atrial flutter
      Lines of block are either fixed or functional
       (anisotropy)
      Atriotomy sites and the Eustachian ridge are
       examples of fixed lines of block
      Evidence exists that block in the region of the
       crista terminalis during atrial flutter is a form of
       functional conduction block
55
Anisotropic Myocardial Activation


56
Anisotropic Myocardial Activation


                      Results in a qs-RS Pattern
57
Utility of Unipolar Recording
      Allows the recording of detailed
       electrogram information from the distal
       electrode of the ablation catheter
       – Confirmation of the earliest activation site (QS
         pattern)
       – Analysis of the ST segment reveals the
         degree of tissue contact
       – Presence of ST elevation after ablation
         confirms the tissue has been ablated
           ST elevation: reflects myocardial tissue damage


58
Utility of Unipolar Recording
      Confirmation of the earliest activation site (QS pattern)


                               QS Pattern


                                 1
                                                        1-2
                                 2
                                 3
                                                        3-4
                                 4

                               rS Pattern


59
Unipolar versus Bipolar

               +     Endocardium


               *      Epicardium


60
Utility of Unipolar Recording


                                                 Analysis of the
                                                  ST segment
                                                  reveals the
                                                  degree of
          Pre-ablation: strong tissue contact     tissue contact
                                                      ST elevation:
                                                       reflects
                                                       myocardial
                                                       tissue
                                                       damage


61
     61
                         ST elevation
Utility of Unipolar Recording
     ST segment elevation post-ablation confirms the tissue has been damaged, thus the
     tissue has been ablated


      Pre-ablation                                                    Post-ablation
62
                     ST segment changes (elevation): Post-ablation
Unipolar Catheters

        SVC


              HEART
                 HRA


                         Ablation
                         catheter

                            Record unipolar recording between the distal
                   IVC
                            electrode of the ablation catheter (or the
                            electrodes on the CS catheter) and one of the
     Reference electrodes   reference electrodes in the IVC
63
Utility of Unipolar Electrogram Recording
     Utility for determining the best
      ablation site in WPW
           PQS Pattern;
           Recording multiple                     HIS
            simultaneous unipolar
            recordings


                                                         CS catheter with
                                                         electrodes all positive
                                                         (Uni 1-10)


64                        Reference electrode is
     64                   negative
Waveform during pacing & sinus rhythm


     Bi


     Uni


65                                           65
Peculiarities of Unipolar Recording
A                                           B


66 Soejima, et al., J Cardiovasc Electrophysiol, Vol. 16, pp. 1017-1022, September 2005
Catheter Positions and Their
             Recordings


67
Relationship of the Surface 12 lead Electrogram to the Activation
Sequence


                                              P-Wave


                                              P-R Interval


                                                QRS Complex )


 68
Relationship of the Intracardiac Electrogram to the Activation Sequence


                                                  A-Wave = HRA


                                                   His potential = His


                                                   V Wave = CS (LBB) &
                                                       RVa (RBB)


 69
Intracardiac Electrogram Recordings – Catheter
     Placement


                              HRA
                                                CS
                   His
HRA
                         CS

                                                 His


                                                RVA
                    RVA


70
Catheter Types
      Fixed Curve         Steerable


71
Intracardiac Electrograms –HRA Catheter


          ATRIAL DEPOLARIZATION


72
Intracardiac Electrograms –His Catheter


     A HV        A HV        A HV        A HV


               ATRIAL DEPOLARIZATION
             HIS BUNDLE DEPOLARIZATION
            VENTRICULAR DEPOLARIZATION


73
Intracardiac Electrograms –CS Catheter


     A V      A V         A V           A V
              ATRIAL DEPOLARIZATION
           VENTRICULAR DEPOLARIZATION


74
CS EGM


75
Special Uses of the CS: Catheter:
                    Bracketing Left-Sided Pathways


 1   Wider

                               Narrow


      Wider
The general location of a left sided AP can be located by bracketing the AP using the
CS electrograms.
    • Intervals between the “A” and “V” waves, or vice versa, is wide-narrow-wide
    • Determines the general location of the AP
 76 • In the case above that is CS2-3
Intracardiac Electrograms –RVA Catheter

       VENTRICULAR DEPOLARIZATION


        V                               V


               RVA catheter recording


77
Normal Activation Sequence as
       Seen from the Intracardiac
              Recordings


78
Electrogram Recordings - correlation with
     surface ECG


                         Between dashed lines = A wave
                         Between solid lines = V wave
                         Between dashed & solid lines = H
                          potential if from the His catheter


79
Normal Activation Sequence


                             Earliest
                             A wave


                             Earliest
                             v wave


80
Intracardiac EGM recordings – Catheter Placement


81
Baseline Electrogram Recording Measurements

         PR segment
                                               NORMAL RANGE
     P wave                     ST segment
                                             PA (IACT) - 20-60 msec
                                               AH - 50-130 msec
                                                His - 10-25 msec
                                                HV - 35-55 msec


              P-A         H-V


                    A-H


82
Display Sweep Speed


            50mm/sec                                200mm/sec

The EP doctor uses different paper speeds to analyze the data. The faster the
speed (100-200mm/sec), the more details he can see. The slower the speed
(25-50mm/sec), the easier to see the overall picture or induction of an
arrhythmia. The doctor will switch back and for between the various speeds.
The 12 lead uses 25 mm/second.
 83
Intracardiac recordings can reveal
         more than the Surface ECG


84
Intracardiac recordings can reveal
         more than the Surface ECG


85
Intracardiac recordings can reveal
         more than the Surface ECG


86
Intracardiac recordings can reveal
         more than the Surface ECG


87

More Related Content

What's hot

Coronary anatomy and angiographic views
Coronary anatomy and angiographic viewsCoronary anatomy and angiographic views
Coronary anatomy and angiographic viewsthanigai arasu
 
Understanding pacemakers
Understanding pacemakersUnderstanding pacemakers
Understanding pacemakersdibufolio
 
Basics of Electrophysiologic study, part 1 (2020)
Basics of Electrophysiologic study, part 1 (2020)Basics of Electrophysiologic study, part 1 (2020)
Basics of Electrophysiologic study, part 1 (2020)salah_atta
 
Echocardiographic Evaluation of Hypertrophic Cardiomyopathy
Echocardiographic Evaluation of Hypertrophic CardiomyopathyEchocardiographic Evaluation of Hypertrophic Cardiomyopathy
Echocardiographic Evaluation of Hypertrophic CardiomyopathyHatem Soliman Aboumarie
 
Assessment of prosthetic valve function
Assessment of prosthetic valve functionAssessment of prosthetic valve function
Assessment of prosthetic valve functionSwapnil Garde
 
Eps basics,part2(lecture)
Eps basics,part2(lecture)Eps basics,part2(lecture)
Eps basics,part2(lecture)salah_atta
 
Assessment of shunt by cardiac catheterization
Assessment of shunt by cardiac catheterizationAssessment of shunt by cardiac catheterization
Assessment of shunt by cardiac catheterizationRamachandra Barik
 
Echocardiographic evaluation of aortic regurgitation
Echocardiographic evaluation of aortic regurgitationEchocardiographic evaluation of aortic regurgitation
Echocardiographic evaluation of aortic regurgitationsruthiMeenaxshiSR
 
Localization of WPW( accessory Pathway) by surface ECG
Localization of WPW( accessory Pathway) by surface ECGLocalization of WPW( accessory Pathway) by surface ECG
Localization of WPW( accessory Pathway) by surface ECGRaghu Kishore Galla
 
Echo Mitral Stenosis
Echo Mitral StenosisEcho Mitral Stenosis
Echo Mitral StenosisMashiul Alam
 
Evaluation of prosthetic valve function and clinical utility.
Evaluation of prosthetic valve function and clinical utility.Evaluation of prosthetic valve function and clinical utility.
Evaluation of prosthetic valve function and clinical utility.Ramachandra Barik
 
Echocardiographic assesment of systolic and diastolic dysfunction
Echocardiographic assesment of systolic and diastolic dysfunctionEchocardiographic assesment of systolic and diastolic dysfunction
Echocardiographic assesment of systolic and diastolic dysfunctionMalleswara rao Dangeti
 
APPROACH TO WIDE QRS COMPLEXTACHYCARDIA.pptx
APPROACH TO WIDE QRS COMPLEXTACHYCARDIA.pptxAPPROACH TO WIDE QRS COMPLEXTACHYCARDIA.pptx
APPROACH TO WIDE QRS COMPLEXTACHYCARDIA.pptxPDT DM CARDIOLOGY
 
Stress echocardiography/Dobutamine stress echocardiography
Stress echocardiography/Dobutamine stress echocardiographyStress echocardiography/Dobutamine stress echocardiography
Stress echocardiography/Dobutamine stress echocardiographyDr. Md. Ahasanul Kabir Shahin
 
WPW EP evaluation
WPW EP evaluationWPW EP evaluation
WPW EP evaluationRohitWalse2
 

What's hot (20)

Echocardiography in mitral stenosis
Echocardiography in mitral stenosisEchocardiography in mitral stenosis
Echocardiography in mitral stenosis
 
TEE VIEWS
TEE VIEWSTEE VIEWS
TEE VIEWS
 
Coronary anatomy and angiographic views
Coronary anatomy and angiographic viewsCoronary anatomy and angiographic views
Coronary anatomy and angiographic views
 
Understanding pacemakers
Understanding pacemakersUnderstanding pacemakers
Understanding pacemakers
 
Echo assessment of mitral regurgitation
Echo assessment of mitral regurgitationEcho assessment of mitral regurgitation
Echo assessment of mitral regurgitation
 
Basics of Electrophysiologic study, part 1 (2020)
Basics of Electrophysiologic study, part 1 (2020)Basics of Electrophysiologic study, part 1 (2020)
Basics of Electrophysiologic study, part 1 (2020)
 
Echocardiographic Evaluation of Hypertrophic Cardiomyopathy
Echocardiographic Evaluation of Hypertrophic CardiomyopathyEchocardiographic Evaluation of Hypertrophic Cardiomyopathy
Echocardiographic Evaluation of Hypertrophic Cardiomyopathy
 
Assessment of prosthetic valve function
Assessment of prosthetic valve functionAssessment of prosthetic valve function
Assessment of prosthetic valve function
 
Eps basics,part2(lecture)
Eps basics,part2(lecture)Eps basics,part2(lecture)
Eps basics,part2(lecture)
 
ECHO ASSESSMENT OF ASD FOR DEVICE CLOSURE
ECHO ASSESSMENT OF ASD FOR DEVICE CLOSURE ECHO ASSESSMENT OF ASD FOR DEVICE CLOSURE
ECHO ASSESSMENT OF ASD FOR DEVICE CLOSURE
 
Assessment of shunt by cardiac catheterization
Assessment of shunt by cardiac catheterizationAssessment of shunt by cardiac catheterization
Assessment of shunt by cardiac catheterization
 
Echocardiographic evaluation of aortic regurgitation
Echocardiographic evaluation of aortic regurgitationEchocardiographic evaluation of aortic regurgitation
Echocardiographic evaluation of aortic regurgitation
 
Localization of WPW( accessory Pathway) by surface ECG
Localization of WPW( accessory Pathway) by surface ECGLocalization of WPW( accessory Pathway) by surface ECG
Localization of WPW( accessory Pathway) by surface ECG
 
Echo Mitral Stenosis
Echo Mitral StenosisEcho Mitral Stenosis
Echo Mitral Stenosis
 
Evaluation of prosthetic valve function and clinical utility.
Evaluation of prosthetic valve function and clinical utility.Evaluation of prosthetic valve function and clinical utility.
Evaluation of prosthetic valve function and clinical utility.
 
Echocardiographic assesment of systolic and diastolic dysfunction
Echocardiographic assesment of systolic and diastolic dysfunctionEchocardiographic assesment of systolic and diastolic dysfunction
Echocardiographic assesment of systolic and diastolic dysfunction
 
APPROACH TO WIDE QRS COMPLEXTACHYCARDIA.pptx
APPROACH TO WIDE QRS COMPLEXTACHYCARDIA.pptxAPPROACH TO WIDE QRS COMPLEXTACHYCARDIA.pptx
APPROACH TO WIDE QRS COMPLEXTACHYCARDIA.pptx
 
Stress echocardiography/Dobutamine stress echocardiography
Stress echocardiography/Dobutamine stress echocardiographyStress echocardiography/Dobutamine stress echocardiography
Stress echocardiography/Dobutamine stress echocardiography
 
FRACTIONAL FLOW RESERVE
FRACTIONAL FLOW RESERVEFRACTIONAL FLOW RESERVE
FRACTIONAL FLOW RESERVE
 
WPW EP evaluation
WPW EP evaluationWPW EP evaluation
WPW EP evaluation
 

Viewers also liked

Introduction To Electrophysiology
Introduction To ElectrophysiologyIntroduction To Electrophysiology
Introduction To Electrophysiologyjmlafroscia
 
Cardiac Electrophysiology
Cardiac ElectrophysiologyCardiac Electrophysiology
Cardiac ElectrophysiologyTeleClinEd
 
Electrophysiology basics,part1(lecture)
Electrophysiology basics,part1(lecture)Electrophysiology basics,part1(lecture)
Electrophysiology basics,part1(lecture)salah_atta
 
ELectrophysiology basics part4
ELectrophysiology basics part4ELectrophysiology basics part4
ELectrophysiology basics part4salah_atta
 
2014 advance clinical electrophysiology training course
2014 advance clinical electrophysiology training course2014 advance clinical electrophysiology training course
2014 advance clinical electrophysiology training courseTaiwan Heart Rhythm Society
 
How to perform and interpret entrainment pacing Basics
How to perform and interpret entrainment pacing BasicsHow to perform and interpret entrainment pacing Basics
How to perform and interpret entrainment pacing BasicsBenjamin Jacob, CEPS (IBHRE)
 
Cardiac arrhythmias and mapping techniques
Cardiac arrhythmias and mapping techniquesCardiac arrhythmias and mapping techniques
Cardiac arrhythmias and mapping techniquesSpringer
 
Cardiac electrophysiology
Cardiac electrophysiologyCardiac electrophysiology
Cardiac electrophysiologyKirtan Bhatt
 
Unknown ep tracing—meet the masters活動剪影
Unknown ep tracing—meet the masters活動剪影Unknown ep tracing—meet the masters活動剪影
Unknown ep tracing—meet the masters活動剪影Taiwan Heart Rhythm Society
 
Differentiation between AVNRT and AVRT_advanced lecture
Differentiation between AVNRT and AVRT_advanced lectureDifferentiation between AVNRT and AVRT_advanced lecture
Differentiation between AVNRT and AVRT_advanced lectureTaiwan Heart Rhythm Society
 
Medical emergency team
Medical emergency teamMedical emergency team
Medical emergency teamPolanest
 
Electrophysiologic basis part3
Electrophysiologic basis part3Electrophysiologic basis part3
Electrophysiologic basis part3salah_atta
 
Hcm 2013 congresso finale1
  Hcm 2013 congresso finale1  Hcm 2013 congresso finale1
Hcm 2013 congresso finale1Pietro Giuliano
 
Basic Cardiac Electrophysiology and ECG Concepts_20120916_南區
Basic Cardiac Electrophysiology and ECG Concepts_20120916_南區Basic Cardiac Electrophysiology and ECG Concepts_20120916_南區
Basic Cardiac Electrophysiology and ECG Concepts_20120916_南區Taiwan Heart Rhythm Society
 
2. 台灣心房顫動之流行病學現況與併發症;心房顫動之藥物及非藥物治療
2. 台灣心房顫動之流行病學現況與併發症;心房顫動之藥物及非藥物治療2. 台灣心房顫動之流行病學現況與併發症;心房顫動之藥物及非藥物治療
2. 台灣心房顫動之流行病學現況與併發症;心房顫動之藥物及非藥物治療Taiwan Heart Rhythm Society
 

Viewers also liked (20)

Introduction To Electrophysiology
Introduction To ElectrophysiologyIntroduction To Electrophysiology
Introduction To Electrophysiology
 
Cardiac Electrophysiology
Cardiac ElectrophysiologyCardiac Electrophysiology
Cardiac Electrophysiology
 
Electrophysiology basics,part1(lecture)
Electrophysiology basics,part1(lecture)Electrophysiology basics,part1(lecture)
Electrophysiology basics,part1(lecture)
 
ELectrophysiology basics part4
ELectrophysiology basics part4ELectrophysiology basics part4
ELectrophysiology basics part4
 
2014 advance clinical electrophysiology training course
2014 advance clinical electrophysiology training course2014 advance clinical electrophysiology training course
2014 advance clinical electrophysiology training course
 
How to perform and interpret entrainment pacing Basics
How to perform and interpret entrainment pacing BasicsHow to perform and interpret entrainment pacing Basics
How to perform and interpret entrainment pacing Basics
 
Cardiac arrhythmias and mapping techniques
Cardiac arrhythmias and mapping techniquesCardiac arrhythmias and mapping techniques
Cardiac arrhythmias and mapping techniques
 
Cardiac electrophysiology
Cardiac electrophysiologyCardiac electrophysiology
Cardiac electrophysiology
 
Unknown ep tracing—meet the masters活動剪影
Unknown ep tracing—meet the masters活動剪影Unknown ep tracing—meet the masters活動剪影
Unknown ep tracing—meet the masters活動剪影
 
Differentiation between AVNRT and AVRT_advanced lecture
Differentiation between AVNRT and AVRT_advanced lectureDifferentiation between AVNRT and AVRT_advanced lecture
Differentiation between AVNRT and AVRT_advanced lecture
 
Atrial tachycardia
Atrial tachycardiaAtrial tachycardia
Atrial tachycardia
 
11.atrial flutter for basic ep.final
11.atrial flutter for basic ep.final11.atrial flutter for basic ep.final
11.atrial flutter for basic ep.final
 
Wolff - Parkinson - White Syndrome
Wolff - Parkinson - White SyndromeWolff - Parkinson - White Syndrome
Wolff - Parkinson - White Syndrome
 
Medical emergency team
Medical emergency teamMedical emergency team
Medical emergency team
 
Electrophysiologic basis part3
Electrophysiologic basis part3Electrophysiologic basis part3
Electrophysiologic basis part3
 
Hcm 2013 congresso finale1
  Hcm 2013 congresso finale1  Hcm 2013 congresso finale1
Hcm 2013 congresso finale1
 
Case report_right atrial tachycardia
Case report_right atrial tachycardia Case report_right atrial tachycardia
Case report_right atrial tachycardia
 
Basic Cardiac Electrophysiology and ECG Concepts_20120916_南區
Basic Cardiac Electrophysiology and ECG Concepts_20120916_南區Basic Cardiac Electrophysiology and ECG Concepts_20120916_南區
Basic Cardiac Electrophysiology and ECG Concepts_20120916_南區
 
ECG: Coronary Sinus Rhythm
ECG: Coronary Sinus RhythmECG: Coronary Sinus Rhythm
ECG: Coronary Sinus Rhythm
 
2. 台灣心房顫動之流行病學現況與併發症;心房顫動之藥物及非藥物治療
2. 台灣心房顫動之流行病學現況與併發症;心房顫動之藥物及非藥物治療2. 台灣心房顫動之流行病學現況與併發症;心房顫動之藥物及非藥物治療
2. 台灣心房顫動之流行病學現況與併發症;心房顫動之藥物及非藥物治療
 

Similar to Intracardiac Electrograms

BME 311 Lecture Note 4-ECG Systems_11.pptx
BME 311  Lecture Note 4-ECG Systems_11.pptxBME 311  Lecture Note 4-ECG Systems_11.pptx
BME 311 Lecture Note 4-ECG Systems_11.pptxAbhishekAnand286155
 
November 21, 20131How a Diode WorksA diode is an electrica.docx
November 21, 20131How a Diode WorksA diode is an electrica.docxNovember 21, 20131How a Diode WorksA diode is an electrica.docx
November 21, 20131How a Diode WorksA diode is an electrica.docxhenrymartin15260
 
electro-pneumatics.pptx
electro-pneumatics.pptxelectro-pneumatics.pptx
electro-pneumatics.pptxMarkSanchez87
 
Integrated Circuit Applications
Integrated Circuit ApplicationsIntegrated Circuit Applications
Integrated Circuit ApplicationsUMAKANTH22
 
Log antilog amplifiers by ransher
Log antilog amplifiers by ransherLog antilog amplifiers by ransher
Log antilog amplifiers by ransherransherraj
 
RF Circuit Design - [Ch3-1] Microwave Network
RF Circuit Design - [Ch3-1] Microwave NetworkRF Circuit Design - [Ch3-1] Microwave Network
RF Circuit Design - [Ch3-1] Microwave NetworkSimen Li
 
STSN1132 Radiation Detection #3.pptx
STSN1132 Radiation Detection #3.pptxSTSN1132 Radiation Detection #3.pptx
STSN1132 Radiation Detection #3.pptxNurmaizatulAtikah
 
Senior Project Students' Presentation on ECG Monitoring
Senior Project Students' Presentation on ECG MonitoringSenior Project Students' Presentation on ECG Monitoring
Senior Project Students' Presentation on ECG MonitoringMd Kafiul Islam
 
RF Circuit Design - [Ch3-2] Power Waves and Power-Gain Expressions
RF Circuit Design - [Ch3-2] Power Waves and Power-Gain ExpressionsRF Circuit Design - [Ch3-2] Power Waves and Power-Gain Expressions
RF Circuit Design - [Ch3-2] Power Waves and Power-Gain ExpressionsSimen Li
 
Design and Implementation of Schmitt Trigger using Operational Amplifier
Design and Implementation of Schmitt Trigger using Operational AmplifierDesign and Implementation of Schmitt Trigger using Operational Amplifier
Design and Implementation of Schmitt Trigger using Operational AmplifierIJERA Editor
 
Week1&2 comm., for engineering technicians
Week1&2  comm.,  for engineering techniciansWeek1&2  comm.,  for engineering technicians
Week1&2 comm., for engineering techniciansTriza Kamel
 
Operational Amplifier, Differential Amplifier, Summing Amplifier
Operational Amplifier, Differential Amplifier, Summing Amplifier Operational Amplifier, Differential Amplifier, Summing Amplifier
Operational Amplifier, Differential Amplifier, Summing Amplifier OsamaMunawar1
 
Power semi conductor devices
Power semi conductor devicesPower semi conductor devices
Power semi conductor devicesDr.KARTHIKEYAN J
 

Similar to Intracardiac Electrograms (20)

BME 311 Lecture Note 4-ECG Systems_11.pptx
BME 311  Lecture Note 4-ECG Systems_11.pptxBME 311  Lecture Note 4-ECG Systems_11.pptx
BME 311 Lecture Note 4-ECG Systems_11.pptx
 
Lec-21.pdf
Lec-21.pdfLec-21.pdf
Lec-21.pdf
 
November 21, 20131How a Diode WorksA diode is an electrica.docx
November 21, 20131How a Diode WorksA diode is an electrica.docxNovember 21, 20131How a Diode WorksA diode is an electrica.docx
November 21, 20131How a Diode WorksA diode is an electrica.docx
 
electro-pneumatics.pptx
electro-pneumatics.pptxelectro-pneumatics.pptx
electro-pneumatics.pptx
 
Integrated Circuit Applications
Integrated Circuit ApplicationsIntegrated Circuit Applications
Integrated Circuit Applications
 
EC8353 ELECTRONIC DEVICES AND CIRCUITS Unit 2
EC8353 ELECTRONIC DEVICES AND CIRCUITS Unit 2EC8353 ELECTRONIC DEVICES AND CIRCUITS Unit 2
EC8353 ELECTRONIC DEVICES AND CIRCUITS Unit 2
 
Log antilog amplifiers by ransher
Log antilog amplifiers by ransherLog antilog amplifiers by ransher
Log antilog amplifiers by ransher
 
RF Circuit Design - [Ch3-1] Microwave Network
RF Circuit Design - [Ch3-1] Microwave NetworkRF Circuit Design - [Ch3-1] Microwave Network
RF Circuit Design - [Ch3-1] Microwave Network
 
EC6202 ELECTRONIC DEVICES AND CIRCUITS Unit 2
EC6202 ELECTRONIC DEVICES AND CIRCUITS Unit 2EC6202 ELECTRONIC DEVICES AND CIRCUITS Unit 2
EC6202 ELECTRONIC DEVICES AND CIRCUITS Unit 2
 
STSN1132 Radiation Detection #3.pptx
STSN1132 Radiation Detection #3.pptxSTSN1132 Radiation Detection #3.pptx
STSN1132 Radiation Detection #3.pptx
 
Senior Project Students' Presentation on ECG Monitoring
Senior Project Students' Presentation on ECG MonitoringSenior Project Students' Presentation on ECG Monitoring
Senior Project Students' Presentation on ECG Monitoring
 
RF Circuit Design - [Ch3-2] Power Waves and Power-Gain Expressions
RF Circuit Design - [Ch3-2] Power Waves and Power-Gain ExpressionsRF Circuit Design - [Ch3-2] Power Waves and Power-Gain Expressions
RF Circuit Design - [Ch3-2] Power Waves and Power-Gain Expressions
 
Simple cell phone jammer
Simple cell phone jammerSimple cell phone jammer
Simple cell phone jammer
 
Power Supply Management
Power Supply ManagementPower Supply Management
Power Supply Management
 
Design and Implementation of Schmitt Trigger using Operational Amplifier
Design and Implementation of Schmitt Trigger using Operational AmplifierDesign and Implementation of Schmitt Trigger using Operational Amplifier
Design and Implementation of Schmitt Trigger using Operational Amplifier
 
Week1&2 comm., for engineering technicians
Week1&2  comm.,  for engineering techniciansWeek1&2  comm.,  for engineering technicians
Week1&2 comm., for engineering technicians
 
Ch2- OpAmps.pdf
Ch2- OpAmps.pdfCh2- OpAmps.pdf
Ch2- OpAmps.pdf
 
Instrumentation amplifier in ECG
Instrumentation amplifier  in ECG Instrumentation amplifier  in ECG
Instrumentation amplifier in ECG
 
Operational Amplifier, Differential Amplifier, Summing Amplifier
Operational Amplifier, Differential Amplifier, Summing Amplifier Operational Amplifier, Differential Amplifier, Summing Amplifier
Operational Amplifier, Differential Amplifier, Summing Amplifier
 
Power semi conductor devices
Power semi conductor devicesPower semi conductor devices
Power semi conductor devices
 

More from Taiwan Heart Rhythm Society

The clinical application of intracardiac echocardiography in cardiac
The clinical application of intracardiac echocardiography in cardiacThe clinical application of intracardiac echocardiography in cardiac
The clinical application of intracardiac echocardiography in cardiacTaiwan Heart Rhythm Society
 
Oral anticoagulants in patients with atrial fibrillation
Oral anticoagulants in patients with atrial fibrillationOral anticoagulants in patients with atrial fibrillation
Oral anticoagulants in patients with atrial fibrillationTaiwan Heart Rhythm Society
 

More from Taiwan Heart Rhythm Society (20)

Arrhythmia news 045.pdf
Arrhythmia news 045.pdfArrhythmia news 045.pdf
Arrhythmia news 045.pdf
 
photo.pptx
photo.pptxphoto.pptx
photo.pptx
 
Arrhythmia news no.44
Arrhythmia news no.44Arrhythmia news no.44
Arrhythmia news no.44
 
Thrs arrhythmia news
Thrs arrhythmia newsThrs arrhythmia news
Thrs arrhythmia news
 
Arrhythmia news 042
Arrhythmia news 042Arrhythmia news 042
Arrhythmia news 042
 
Picture
PicturePicture
Picture
 
Arrhythmia news no.41
Arrhythmia news no.41Arrhythmia news no.41
Arrhythmia news no.41
 
Arrhythmia news no.40
Arrhythmia news no.40Arrhythmia news no.40
Arrhythmia news no.40
 
Arrhythmia news 039
Arrhythmia news 039Arrhythmia news 039
Arrhythmia news 039
 
Challenging and Unknown ECGs (2)
Challenging and Unknown ECGs (2)Challenging and Unknown ECGs (2)
Challenging and Unknown ECGs (2)
 
Arrhythmia news 038
Arrhythmia news 038Arrhythmia news 038
Arrhythmia news 038
 
Photos
PhotosPhotos
Photos
 
Arrhythmia news 037
Arrhythmia news 037Arrhythmia news 037
Arrhythmia news 037
 
Arrhythmia news no.36
Arrhythmia news no.36Arrhythmia news no.36
Arrhythmia news no.36
 
The clinical application of intracardiac echocardiography in cardiac
The clinical application of intracardiac echocardiography in cardiacThe clinical application of intracardiac echocardiography in cardiac
The clinical application of intracardiac echocardiography in cardiac
 
Comprehensive management
Comprehensive managementComprehensive management
Comprehensive management
 
Arrhythmia news 035
Arrhythmia news 035Arrhythmia news 035
Arrhythmia news 035
 
Oral anticoagulants in patients with atrial fibrillation
Oral anticoagulants in patients with atrial fibrillationOral anticoagulants in patients with atrial fibrillation
Oral anticoagulants in patients with atrial fibrillation
 
THRS allied professional training course
THRS allied professional training courseTHRS allied professional training course
THRS allied professional training course
 
Pictures
PicturesPictures
Pictures
 

Recently uploaded

Nutrition of OCD for my Nutritional Neuroscience Class
Nutrition of OCD for my Nutritional Neuroscience ClassNutrition of OCD for my Nutritional Neuroscience Class
Nutrition of OCD for my Nutritional Neuroscience Classmanuelazg2001
 
VarSeq 2.6.0: Advancing Pharmacogenomics and Genomic Analysis
VarSeq 2.6.0: Advancing Pharmacogenomics and Genomic AnalysisVarSeq 2.6.0: Advancing Pharmacogenomics and Genomic Analysis
VarSeq 2.6.0: Advancing Pharmacogenomics and Genomic AnalysisGolden Helix
 
Measurement of Radiation and Dosimetric Procedure.pptx
Measurement of Radiation and Dosimetric Procedure.pptxMeasurement of Radiation and Dosimetric Procedure.pptx
Measurement of Radiation and Dosimetric Procedure.pptxDr. Dheeraj Kumar
 
PNEUMOTHORAX AND ITS MANAGEMENTS.pdf
PNEUMOTHORAX   AND  ITS  MANAGEMENTS.pdfPNEUMOTHORAX   AND  ITS  MANAGEMENTS.pdf
PNEUMOTHORAX AND ITS MANAGEMENTS.pdfDolisha Warbi
 
97111 47426 Call Girls In Delhi MUNIRKAA
97111 47426 Call Girls In Delhi MUNIRKAA97111 47426 Call Girls In Delhi MUNIRKAA
97111 47426 Call Girls In Delhi MUNIRKAAjennyeacort
 
Hematology and Immunology - Leukocytes Functions
Hematology and Immunology - Leukocytes FunctionsHematology and Immunology - Leukocytes Functions
Hematology and Immunology - Leukocytes FunctionsMedicoseAcademics
 
METHODS OF ACQUIRING KNOWLEDGE IN NURSING.pptx by navdeep kaur
METHODS OF ACQUIRING KNOWLEDGE IN NURSING.pptx by navdeep kaurMETHODS OF ACQUIRING KNOWLEDGE IN NURSING.pptx by navdeep kaur
METHODS OF ACQUIRING KNOWLEDGE IN NURSING.pptx by navdeep kaurNavdeep Kaur
 
Giftedness: Understanding Everyday Neurobiology for Self-Knowledge
Giftedness: Understanding Everyday Neurobiology for Self-KnowledgeGiftedness: Understanding Everyday Neurobiology for Self-Knowledge
Giftedness: Understanding Everyday Neurobiology for Self-Knowledgeassessoriafabianodea
 
Statistical modeling in pharmaceutical research and development.
Statistical modeling in pharmaceutical research and development.Statistical modeling in pharmaceutical research and development.
Statistical modeling in pharmaceutical research and development.ANJALI
 
low cost antibiotic cement nail for infected non union.pptx
low cost antibiotic cement nail for infected non union.pptxlow cost antibiotic cement nail for infected non union.pptx
low cost antibiotic cement nail for infected non union.pptxdrashraf369
 
Tans femoral Amputee : Prosthetics Knee Joints.pptx
Tans femoral Amputee : Prosthetics Knee Joints.pptxTans femoral Amputee : Prosthetics Knee Joints.pptx
Tans femoral Amputee : Prosthetics Knee Joints.pptxKezaiah S
 
Radiation Dosimetry Parameters and Isodose Curves.pptx
Radiation Dosimetry Parameters and Isodose Curves.pptxRadiation Dosimetry Parameters and Isodose Curves.pptx
Radiation Dosimetry Parameters and Isodose Curves.pptxDr. Dheeraj Kumar
 
Informed Consent Empowering Healthcare Decision-Making.pptx
Informed Consent Empowering Healthcare Decision-Making.pptxInformed Consent Empowering Healthcare Decision-Making.pptx
Informed Consent Empowering Healthcare Decision-Making.pptxSasikiranMarri
 
Presentation on Parasympathetic Nervous System
Presentation on Parasympathetic Nervous SystemPresentation on Parasympathetic Nervous System
Presentation on Parasympathetic Nervous SystemPrerana Jadhav
 
maternal mortality and its causes and how to reduce maternal mortality
maternal mortality and its causes and how to reduce maternal mortalitymaternal mortality and its causes and how to reduce maternal mortality
maternal mortality and its causes and how to reduce maternal mortalityhardikdabas3
 
Clinical Pharmacotherapy of Scabies Disease
Clinical Pharmacotherapy of Scabies DiseaseClinical Pharmacotherapy of Scabies Disease
Clinical Pharmacotherapy of Scabies DiseaseSreenivasa Reddy Thalla
 
Big Data Analysis Suggests COVID Vaccination Increases Excess Mortality Of ...
Big Data Analysis Suggests COVID  Vaccination Increases Excess Mortality Of  ...Big Data Analysis Suggests COVID  Vaccination Increases Excess Mortality Of  ...
Big Data Analysis Suggests COVID Vaccination Increases Excess Mortality Of ...sdateam0
 
Introduction to Sports Injuries by- Dr. Anjali Rai
Introduction to Sports Injuries by- Dr. Anjali RaiIntroduction to Sports Injuries by- Dr. Anjali Rai
Introduction to Sports Injuries by- Dr. Anjali RaiGoogle
 
COVID-19 (NOVEL CORONA VIRUS DISEASE PANDEMIC ).pptx
COVID-19  (NOVEL CORONA  VIRUS DISEASE PANDEMIC ).pptxCOVID-19  (NOVEL CORONA  VIRUS DISEASE PANDEMIC ).pptx
COVID-19 (NOVEL CORONA VIRUS DISEASE PANDEMIC ).pptxBibekananda shah
 

Recently uploaded (20)

Nutrition of OCD for my Nutritional Neuroscience Class
Nutrition of OCD for my Nutritional Neuroscience ClassNutrition of OCD for my Nutritional Neuroscience Class
Nutrition of OCD for my Nutritional Neuroscience Class
 
VarSeq 2.6.0: Advancing Pharmacogenomics and Genomic Analysis
VarSeq 2.6.0: Advancing Pharmacogenomics and Genomic AnalysisVarSeq 2.6.0: Advancing Pharmacogenomics and Genomic Analysis
VarSeq 2.6.0: Advancing Pharmacogenomics and Genomic Analysis
 
Measurement of Radiation and Dosimetric Procedure.pptx
Measurement of Radiation and Dosimetric Procedure.pptxMeasurement of Radiation and Dosimetric Procedure.pptx
Measurement of Radiation and Dosimetric Procedure.pptx
 
PNEUMOTHORAX AND ITS MANAGEMENTS.pdf
PNEUMOTHORAX   AND  ITS  MANAGEMENTS.pdfPNEUMOTHORAX   AND  ITS  MANAGEMENTS.pdf
PNEUMOTHORAX AND ITS MANAGEMENTS.pdf
 
97111 47426 Call Girls In Delhi MUNIRKAA
97111 47426 Call Girls In Delhi MUNIRKAA97111 47426 Call Girls In Delhi MUNIRKAA
97111 47426 Call Girls In Delhi MUNIRKAA
 
Hematology and Immunology - Leukocytes Functions
Hematology and Immunology - Leukocytes FunctionsHematology and Immunology - Leukocytes Functions
Hematology and Immunology - Leukocytes Functions
 
METHODS OF ACQUIRING KNOWLEDGE IN NURSING.pptx by navdeep kaur
METHODS OF ACQUIRING KNOWLEDGE IN NURSING.pptx by navdeep kaurMETHODS OF ACQUIRING KNOWLEDGE IN NURSING.pptx by navdeep kaur
METHODS OF ACQUIRING KNOWLEDGE IN NURSING.pptx by navdeep kaur
 
Giftedness: Understanding Everyday Neurobiology for Self-Knowledge
Giftedness: Understanding Everyday Neurobiology for Self-KnowledgeGiftedness: Understanding Everyday Neurobiology for Self-Knowledge
Giftedness: Understanding Everyday Neurobiology for Self-Knowledge
 
Statistical modeling in pharmaceutical research and development.
Statistical modeling in pharmaceutical research and development.Statistical modeling in pharmaceutical research and development.
Statistical modeling in pharmaceutical research and development.
 
low cost antibiotic cement nail for infected non union.pptx
low cost antibiotic cement nail for infected non union.pptxlow cost antibiotic cement nail for infected non union.pptx
low cost antibiotic cement nail for infected non union.pptx
 
Tans femoral Amputee : Prosthetics Knee Joints.pptx
Tans femoral Amputee : Prosthetics Knee Joints.pptxTans femoral Amputee : Prosthetics Knee Joints.pptx
Tans femoral Amputee : Prosthetics Knee Joints.pptx
 
Radiation Dosimetry Parameters and Isodose Curves.pptx
Radiation Dosimetry Parameters and Isodose Curves.pptxRadiation Dosimetry Parameters and Isodose Curves.pptx
Radiation Dosimetry Parameters and Isodose Curves.pptx
 
Informed Consent Empowering Healthcare Decision-Making.pptx
Informed Consent Empowering Healthcare Decision-Making.pptxInformed Consent Empowering Healthcare Decision-Making.pptx
Informed Consent Empowering Healthcare Decision-Making.pptx
 
Presentation on Parasympathetic Nervous System
Presentation on Parasympathetic Nervous SystemPresentation on Parasympathetic Nervous System
Presentation on Parasympathetic Nervous System
 
maternal mortality and its causes and how to reduce maternal mortality
maternal mortality and its causes and how to reduce maternal mortalitymaternal mortality and its causes and how to reduce maternal mortality
maternal mortality and its causes and how to reduce maternal mortality
 
Epilepsy
EpilepsyEpilepsy
Epilepsy
 
Clinical Pharmacotherapy of Scabies Disease
Clinical Pharmacotherapy of Scabies DiseaseClinical Pharmacotherapy of Scabies Disease
Clinical Pharmacotherapy of Scabies Disease
 
Big Data Analysis Suggests COVID Vaccination Increases Excess Mortality Of ...
Big Data Analysis Suggests COVID  Vaccination Increases Excess Mortality Of  ...Big Data Analysis Suggests COVID  Vaccination Increases Excess Mortality Of  ...
Big Data Analysis Suggests COVID Vaccination Increases Excess Mortality Of ...
 
Introduction to Sports Injuries by- Dr. Anjali Rai
Introduction to Sports Injuries by- Dr. Anjali RaiIntroduction to Sports Injuries by- Dr. Anjali Rai
Introduction to Sports Injuries by- Dr. Anjali Rai
 
COVID-19 (NOVEL CORONA VIRUS DISEASE PANDEMIC ).pptx
COVID-19  (NOVEL CORONA  VIRUS DISEASE PANDEMIC ).pptxCOVID-19  (NOVEL CORONA  VIRUS DISEASE PANDEMIC ).pptx
COVID-19 (NOVEL CORONA VIRUS DISEASE PANDEMIC ).pptx
 

Intracardiac Electrograms

  • 1. Intracardiac Electrograms (IEGM) and Catheter Positions 1
  • 2. Unipolar Recording V1 lead used for the negative (reference) pole - + Catheter with the positive electrode placed in the heart 2
  • 5. Bipolar Electrogram Construction Unipolar Bipolar Uni 1 - - - = Uni 2 + + Uni1 (+) – Uni2 (-) = Bipolar Bipole Uni-distal Uni-proximal 5
  • 6. Bipolar signal construction + Differential amplifier t1 t2 t3 t4 t5 t6 t7 t8 t9 t10 t11 - t1 t2 t3 t4 t5 t6 t7 t8 t9 (Signal 1 + Noise) – (Signal 2 + Noise) = Signal 1 – Signal 2 6
  • 7. Bipolar EGMs Bi E1 E2 7
  • 8. Electrophysiology of the cardiac muscle cell 8
  • 9. Affect of the Direction of Activation on the Electrogram 9 http://www.vetgo.com/cardio/concepts/concsect.php?sectionkey=5&section=Electrocardiology
  • 10. Direction of Activation and its Influence on the Bipolar ECG +– – – – – – – – – – – – – – – – – – – – – – – – +– – – – – – – – – – – – – – – – – – – – – – – – +– – – – – – – – – – – – – – – – – – – – – – – – +– – – – – – – – – – + – – – – – – – – – – – – – – - +– – – – – – – – – – – – – – – – – – – – – – – – +– – – – – – – – – – – – – – – – – – – – – – – – +– – – – – – – – – – – – – – – – – – – – – – – – +– – – – – – – – – – – – – – – – – – – – – – – – +– – – – – – – – – – – – – – – – – – – – – – – – +– – – – – – – – – – – – – – – – – – – – – – – – 10
  • 11. Direction of Activation and its Influence on the Bipolar ECG –––––––––––––––––––––––+ – –––––––––––––––––––––––+ – –––––––––––––––––––––––+ – – – – – – – – – – –+ – – – – – – – – – – – – + – - – –––––––––––––––––––––––+ – –––––––––––––––––––––––+ – – – – – – – – – – – – – – – – – – – – – – – –+ – – – – – – – – – – – – – – – – – – – – – – – –+ – – – – – – – – – – – – – – – – – – – – – – – –+ – – – – – – – – – – – – – – – – – – – – – – – –+ 11 –
  • 12. Direction of Activation and its Influence on the Bipolar ECG ––––––––––––––––––––––––––––––––––– ––––––––––––––––––––––––––––––––––– ––––––––––––––––––––––––––––––––––– ––––––––––––––––––––––––––––––––––– ––––––––––––––––––––––––––––––––––– – – – – – – – – – – – – – – + – – – – – – – –- – – – – – – – – – – – – – ––––––––––––––––––––––––––––––––––– A B C ––––––––––––––––––––––––––––––––––– ––––––––––––––––––––––––––––––––––– ––––––––––––––––––––––––––––––––––– ––––––––––––––––––––––––––––––––––– ––––––––––––––––––––––––––––––––––– ––––––––––––––––––––––––––––––––––– ––––––––––––––––––––––––––––––––––– 12 – – – – – – – – – – – – – – – – – – – – – – – – – – – – – – – – – – –
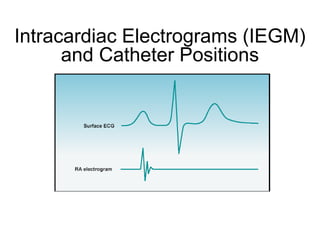
  • 14. Influence of individual cells on the Unipolar Electrogram The influence of any active cell upon the unipolar recording is inversely proportional to the distance between the cell and the electrode Because activation propagates from cell-to-cell, active cells are organized along a wave “front” Consequently, the unipolar electrogram AP is a summation of membrane currents unipolar 14
  • 15. Unipolar versus Action Potential 15
  • 16. Comparison of Bipolar versus Unipolar Recording 16
  • 17. Comparison of Unipolar versus Bipolar Recording E1 E2  Unipolar recordings measure an amplified version of voltage at a single electrode (E1) and retain both near and far field signal components  Bipolar recordings measure the amplified difference between two unipolar electrodes (E1 - E2), which reduces common-mode noise and far-field signal components 17
  • 18. Unipolar versus Bipolar E1 E2  Bipolar recordings approximate a measure of the rate-of-change of the wavefront  This measure is approximate because cardiac wavefronts do not propagate uniformly and the medium is not ideal 18
  • 19. Propagating Activation Wavefront 19
  • 20. Propagating Activation Wavefront Depol. toward positive electrode Repol. toward positive electrode Positive Signal Negative Signal Depol. away from positive electrode Repol. Away from positive electrode Negative Signal Positive Signal 20
  • 21. Comparison of the Filtered and unfiltered Unipolar and Bipolar Recordings • Note the peak negative slope indicated by the arrow in the unfiltered unipolar recording corresponds to the indicated negative peak in the 21 highpass-filtered unipole, confirming the approximation to rate-of-change.
  • 22. Comparison of the Filtered and unfiltered Unipolar and Bipolar Recordings • Note the brief occurrence of the zero slope (arrow) in the unfiltered unipole which corresponds with the zero-crossing and phase-reversal of the highpass-filtered unipole. It also corresponds to the zero crossing of the 22 unfiltered bipole and the most positive peak of the filtered (32Hz) bipole.
  • 23. Unipolar versus Bipolar Recording  Physical basis of electrograms - Summary – The unipole records the perspective-view of the wavefront  Wavefront = summation of the action potentials over space and time  Action potential = generated by membrane ion currents – The bipole records the derivative (slope) of the unipole – Bipolar recording (spatial) and the highpass filter (temporal) are correlated, and have a lower sensitivity to low frequencies (slow conduction) and higher sensitivity to high frequencies (fast conduction) 23
  • 24. 24
  • 25. 25
  • 26. 26
  • 27. Signal Filtering Noise  Problems influencing the signal fidelity: – Signal to noise ratio – Distortion of the signal  To limit these a properly designed amplification system with 27 filters is required
  • 28. Filtering The leads record the raw electrical potential data and send it to the amplifier. The Amplifier increases the amplitude of the signals Amplifier (often up to a factor of 10000). The high-pass filter removes any base line drift or High Pass Filter physiologic noise by cutting off anything below a set value. An isolation amplifier isolates the circuit from the Isolation Amplifier patient (this can be done by transmitting the signals optically). The low-pass filter removes any environmental noise Low Pass Filter by cutting off anything above a certain value. The resultant signal is either the surface EKG or intracardiac signals of interest. 28
  • 29. Filtering  Surface ECG signals are concentrated in the bandwidth between 1Hz - 80Hz.  Intracardiac ECG signals are concentrated in the bandwidth between 15 - 60Hz  High Resolution ECG signals are concentrated between a bandwidth of 0.05Hz - 300Hz 29
  • 31. Filtering ECG data filtered with 60Hz Notch Filter 0.35 0.3 0.25 0.2 Magnitude unfiltered ECG 0.15 filtered ECG 0.1 0.05 0 0 0.2 0.4 0.6 0.8 1 1.2 1.4 -0.05 Frequency (f) 31
  • 32. Filtering – Lowpass Filter Lowpass Filter V Corner Frequency (Passes LF) Pass-band Stop-band f cutoff frequency (250 - 500 Hz) A lowpass filter allows lower frequencies to pass through while reducing higher frequencies, relative to an upper cutoff frequency. In conventional electrophysiology, this cutoff (corner) frequency is typically in the range of 250 to 500 Hz. 32
  • 33. Filtering Highpass Filter Highpass Lowpass Filter V Corner Frequency repol (Passes LF) (Passes HF) depol Stop-band Pass-band cutoff freq cutoff freq f cutoff frequency (30 - 32 Hz) (250 - 500 Hz) (30 - 32 Hz) The highpass filter is the exact opposite of the lowpass filter in which higher frequencies are now allowed to pass through while reducing lower frequencies, relative to a lower cutoff (corner) frequency, which is typically 33 Hz. 30
  • 34. Bandpass Filtering Combined = Bandpass Filter (passes depolarization) physiologic environmental V repol depol Highpass Lowpass cutoff freq cutoff freq f (30 - 32 Hz) (250 - 500 Hz) •The highpass reduces signal components related to physiologic noise, i.e., repolarization. Thus the intent of these filter settings is to allow signal components related to depolarization to pass. •The lowpass section of the bandpass filter is intended to reduce environmental noise. 34
  • 35. Filtering Subtle point about highpass section: V 32 Hz f ~16 Hz ~64 Hz • The bandpass filters actually exhibit a gradual response to frequency, as shown in the figure, rather than an idealized, straight-line response • Frequencies below 16Hz (green), are reduced enough by the filter that they are essentially insignificant. • At frequencies approximately twice the cutoff frequency (in this case 64 Hz) there is a range of frequencies above this point in which the response of the filter is fairly flat and the signal components are passed 35 through essentially unchanged.
  • 36. Filtering Subtle point about highpass section: approximates the derivative V Depolarization f ~16 Hz ~64 Hz • The red line shows a special filter response which computes the time-derivative of the signal. • The gradual response of the highpass filter between 16 to 64 Hz is a reasonable approximation of the rate-of-change for signal components that fall into that range of frequencies. • The majority of the signal energy related to depolarization falls between 15-60 Hz. Thus unipolar recordings made with a highpass filter set at 32 Hz are correlated with wavefront change. Note both the highpass filtered unipole and the unfiltered bipole are both correlated with wavefront 36 change.
  • 37. Clinical use of Unipolar Recording 37
  • 38. Expected Electrogram Progression wavefront A “QS” receding Schematic Representation of RA Stimulation of HRA portrays endocardial breakthrough from the SA node network with typical waveform morphologies: 50% – 50% approaching & B • early “QS” “RS” receding • mid “RS” • late “R” wavefront C approaching “R” 38
  • 39. Actual Electrogram Progression Sinus Rhythm “QS SA Node ” A B C 39
  • 40. Actual Electrogram Progression Sinus Rhythm “QS ” A B Mid Lateral “RS” C 40
  • 41. Actual Electrogram Progression Sinus Rhythm “QS ” A B “RS” C IVC Junction “R” 41
  • 42. R Wave Amplitude is Dependent on the Amount of Myocardium Involved Large mass Small mass myocardial myocardial recruitment recruitment Large mass or Large mass or distance = Large distance = Large amplitude amplitude 42
  • 43. Amplitude of the ECG is effected by the size of the Myocardium 43
  • 44. Myocardial Characteristics and the Bipolar ECG 1. If the tissue is diseased it will exhibit low- frequency low amplitude Healthy electrograms, but if healthy it will have high frequency high- amplitude electrograms Disease d 2. With a set distance between the two electrodes of the bipolar Dead ECG, you can see the activation time and thus it tells you conduction speed 44
  • 45. R Wave Width is Dependent on the Conduction Speed Wide R Wave Narrow R Wave Slow conduction Rapid conduction such as across diseased or with myocardial recruitment deep tissue results in post-exit results in a narrow a wide duration duration 45
  • 46. Unipolar Recording: Circus Movement CL 1 1 CL Start 2 2 4 3 3 4 The red loop represents one cycle 1 length (CL) of the tachycardia CL End 46
  • 47. Unipolar Recording: Circus Movement • The electrogram is a result of the 1 activation from “A” and “B” • “A” = activation moving toward the electrode • “B” = activation moving away from the electrode B A CL CL End A The red loop represents one cycle length (CL) of the tachycardia B CL Start 1 1 1 47
  • 48. Q wave (qs-RS) pattern • QS Pattern at the arrhythmia focus site • A qs-RS pattern can occur when: • There is a preferential pathway from the arrhythmia focus • Activation proceeds from a low to high current generating region • There is myocardium exhibiting anisotropic conduction Normally an arrhythmia focus has a negative deflection resulting in a QS Pattern, but that is not always true 48
  • 49. Unipolar Recording: Within Small Conducting Channel  Preferential pathway from the arrhythmia focus – Two components of Breakout site activation occur:  Slow confined conduction * with large and rapid activation  Rapid myocardial breakout conduction 49
  • 51. Double Potentials Barriers to Turn around conduction point 3 2 1 * Bipolar ECG Unipolar ECG Turn around point = end of a fixed or functional barrier such as scar 51 tissue (fixed) or the crista terminalis (functional)
  • 53. Double Potentials Barriers to conduction Bipolar ECG Unipolar ECG 3 2 1 * Area of slow conduction 53
  • 54. Flatline Between Double Potentials Slow conduction zone (SCZ) * SCZ + + * + + + SCZ + 54 *
  • 55. Double Potentials  Double potentials are indicative of a line of block  Crista terminalis is an important anatomical and functional barrier in atrial flutter  Lines of block are either fixed or functional (anisotropy)  Atriotomy sites and the Eustachian ridge are examples of fixed lines of block  Evidence exists that block in the region of the crista terminalis during atrial flutter is a form of functional conduction block 55
  • 57. Anisotropic Myocardial Activation Results in a qs-RS Pattern 57
  • 58. Utility of Unipolar Recording  Allows the recording of detailed electrogram information from the distal electrode of the ablation catheter – Confirmation of the earliest activation site (QS pattern) – Analysis of the ST segment reveals the degree of tissue contact – Presence of ST elevation after ablation confirms the tissue has been ablated  ST elevation: reflects myocardial tissue damage 58
  • 59. Utility of Unipolar Recording  Confirmation of the earliest activation site (QS pattern) QS Pattern 1 1-2 2 3 3-4 4 rS Pattern 59
  • 60. Unipolar versus Bipolar + Endocardium * Epicardium 60
  • 61. Utility of Unipolar Recording  Analysis of the ST segment reveals the degree of Pre-ablation: strong tissue contact tissue contact  ST elevation: reflects myocardial tissue damage 61 61 ST elevation
  • 62. Utility of Unipolar Recording ST segment elevation post-ablation confirms the tissue has been damaged, thus the tissue has been ablated Pre-ablation Post-ablation 62 ST segment changes (elevation): Post-ablation
  • 63. Unipolar Catheters SVC HEART HRA Ablation catheter Record unipolar recording between the distal IVC electrode of the ablation catheter (or the electrodes on the CS catheter) and one of the Reference electrodes reference electrodes in the IVC 63
  • 64. Utility of Unipolar Electrogram Recording Utility for determining the best ablation site in WPW  PQS Pattern;  Recording multiple HIS simultaneous unipolar recordings CS catheter with electrodes all positive (Uni 1-10) 64 Reference electrode is 64 negative
  • 65. Waveform during pacing & sinus rhythm Bi Uni 65 65
  • 66. Peculiarities of Unipolar Recording A B 66 Soejima, et al., J Cardiovasc Electrophysiol, Vol. 16, pp. 1017-1022, September 2005
  • 67. Catheter Positions and Their Recordings 67
  • 68. Relationship of the Surface 12 lead Electrogram to the Activation Sequence P-Wave P-R Interval QRS Complex ) 68
  • 69. Relationship of the Intracardiac Electrogram to the Activation Sequence A-Wave = HRA His potential = His V Wave = CS (LBB) & RVa (RBB) 69
  • 70. Intracardiac Electrogram Recordings – Catheter Placement HRA CS His HRA CS His RVA RVA 70
  • 71. Catheter Types  Fixed Curve  Steerable 71
  • 72. Intracardiac Electrograms –HRA Catheter ATRIAL DEPOLARIZATION 72
  • 73. Intracardiac Electrograms –His Catheter A HV A HV A HV A HV ATRIAL DEPOLARIZATION HIS BUNDLE DEPOLARIZATION VENTRICULAR DEPOLARIZATION 73
  • 74. Intracardiac Electrograms –CS Catheter A V A V A V A V ATRIAL DEPOLARIZATION VENTRICULAR DEPOLARIZATION 74
  • 76. Special Uses of the CS: Catheter: Bracketing Left-Sided Pathways 1 Wider Narrow Wider The general location of a left sided AP can be located by bracketing the AP using the CS electrograms. • Intervals between the “A” and “V” waves, or vice versa, is wide-narrow-wide • Determines the general location of the AP 76 • In the case above that is CS2-3
  • 77. Intracardiac Electrograms –RVA Catheter VENTRICULAR DEPOLARIZATION V V RVA catheter recording 77
  • 78. Normal Activation Sequence as Seen from the Intracardiac Recordings 78
  • 79. Electrogram Recordings - correlation with surface ECG  Between dashed lines = A wave  Between solid lines = V wave  Between dashed & solid lines = H potential if from the His catheter 79
  • 80. Normal Activation Sequence Earliest A wave Earliest v wave 80
  • 81. Intracardiac EGM recordings – Catheter Placement 81
  • 82. Baseline Electrogram Recording Measurements PR segment NORMAL RANGE P wave ST segment PA (IACT) - 20-60 msec AH - 50-130 msec His - 10-25 msec HV - 35-55 msec P-A H-V A-H 82
  • 83. Display Sweep Speed 50mm/sec 200mm/sec The EP doctor uses different paper speeds to analyze the data. The faster the speed (100-200mm/sec), the more details he can see. The slower the speed (25-50mm/sec), the easier to see the overall picture or induction of an arrhythmia. The doctor will switch back and for between the various speeds. The 12 lead uses 25 mm/second. 83
  • 84. Intracardiac recordings can reveal more than the Surface ECG 84
  • 85. Intracardiac recordings can reveal more than the Surface ECG 85
  • 86. Intracardiac recordings can reveal more than the Surface ECG 86
  • 87. Intracardiac recordings can reveal more than the Surface ECG 87