SlideShare a Scribd company logo
1 of 10
Download to read offline
ECONOMICS, BARRIERS, AND RISKS OF OIL SHALE DEVELOPMENT IN THE UNITED 
STATES 
Khosrow Biglarbigi, President, INTEK Incorporated, 2300 Clarendon Boulevard Ste. 310, Arlington VA 22201, 
Phone 703-465-2200, Email: kbiglari@inteki.com 
Marshall Carolus, Associate, INTEK Incorporated 
Peter Crawford, Senior Manager, INTEK Incorporated 
Hitesh Mohan, Vice President, INTEK Incorporated 
Abstract 
World oil prices have nearly doubled in 2008, and have risen by 400% since 2004. Crude oil prices reached more than $145 
per barrel before pulling back significantly. High oil prices, and the national security issues associated with the United 
States’ reliance on unstable foreign sources of crude oil, have reignited interest in America’s enormous domestic oil shale 
resources. 
Oil shale is one of the world’s largest known fossil fuel resources. Global resources well exceed 10 trillion barrels. More 
than 1.8 trillion barrels of oil are trapped in shale in Federal lands in the western United States in the states of Colorado, Utah 
and Wyoming, of which 800 billion is considered recoverable. This amounts to three times the proven reserves of Saudi 
Arabia. 
During the past decade, much attention has been given to advancing various extraction technologies to make oil shale 
economically feasible. This paper describes many of these technologies and recent and ongoing advances. The objective of 
this paper is to quantify the costs and benefits of oil shale industry development and consider the hurdles to such 
development. 
Petroleum 
120 
100 
80 
60 
40 
20 
0 
2006 
2007 
2008 
2009 
2010 
2011 
2012 
2013 
2014 
2015 
2016 
2017 
2018 
2019 
2020 
2021 
2022 
2023 
2024 
2025 
2026 
2027 
2028 
2029 
2030 
Year 
MMBbl/d 
35 Production Capacity 
1990 
1991 
1992 
1993 
1994 
1995 
1996 
1997 
1998 
1999 
2000 
2001 
2002 
2003 
33 
31 
29 
27 
25 
23 
19 
17 
15 
2004 
2005 
21 
` 
Detailed economic analysis has been conducted on the 
potential development of oil shale. This paper will describe the 
four representative production technologies being considered by 
companies for oil shale development. The paper will provide 
details of various components of capital and operating costs for 
each of these technologies and the price at which each of these 
technologies will be economic. In addition to presenting an 
evaluation of the economic viability of an oil shale industry, this 
paper also describes the costs and benefits of such an industry to 
local, state, and Federal governments. Measures such as jobs 
created contribution to Gross Domestic Product, and imports 
avoided will be described. 
Introduction 
The United States, along with the rest of the world, faces significant challenges to meet future demand for liquid fuels. These 
challenges are caused by rising demand for oil and other petroleum products. The world demand for petroleum is expected to 
continue to increase over the next twenty five years, from 
approximately 85 million barrels to nearly 115 million barrels per 
day (MMBbl/d) by 2025 (Fig. 1). 
The question is where the increased supply will come from to 
meet the additional demand? In the past, the Organization of 
Petroleum Exporting Countries (OPEC) served as the world’s 
swing oil producer. However, over the past decade, OPEC’s excess 
production capacity has not kept pace with actual production (Fig. 
2). By 2005, OPEC excess productive capacity fell to 
approximately one MMBbl/d. The growth in demand and the 
tightness of the supply has contributed to increasingly high and 
volatile world oil prices. 
If left unaddressed, these increasing prices and tightness of 
supply will significantly impact the United States. The U.S. 
economy is highly dependent on petroleum consumption. In 2007, 
petroleum accounted for 39% of the Nation’s energy demand2, 
Figure 1: Increased World Oil Demand1 
Figure 2: OPEC Excess Capacity14
Figure 3: U.S. Energy Consumption2 
Oil 
39% 
Coal 
22% 
Natural Gas 
23% 
Nuclear 
8% 
Other 
7% 
30 
25 
20 
15 
10 
5 
Figure 4: Projected U.S. Supply and Consumption1 
U.S. Consumption 21.14 
Imports 
27.65 
9.65 
8.58 
largely to support the transportation sector (Fig. 3). The United States now faces increasing competition for world oil 
supplies from rapidly growing economies. This increased competition raises concern over the future reliability of liquid fuels 
for both military and civilian uses. In 2007, the United States consumed 21.14 MMBbl/d of petroleum and petroleum 
products, 12.5 MMBbl/d of which was imported. By 2030, U.S. oil consumption is forecast to grow to 27.65 MMBbl/d, of 
which 18 MMBbl/d will be imported (Fig. 4). 
The percentage of U.S. consumption met by imports will increase from 59% to 65% by 2030. The challenge facing the 
United States is to locate and develop domestic sources of liquid fuels that will meet demand increases and offset the growth 
in imports. 
Rising world oil prices, combined with the increased need for secure alternative liquid fuel sources have spurred 
considerable interest in alternative fuels resources, including renewables, alternatives, and unconventional fossil fuels 
(including: oil shale, tar sands, coal–to–liquids, and heavy oil), as well as enhanced oil recovery. While all of these resources 
can contribute to U.S. liquid fuel supply, the focus of this paper is on the massive resources and significant potential of the 
U.S. oil shale deposits, particularly in the Western states. 
Oil Shale Resources 
U.S. oil shale is carbonate rock, generally marlstone that is very rich in organic sedimentary material called “kerogen.” Oil 
shales are “younger” in geologic age than crude oil-bearing formations; natural forces of pressure and temperature have not 
yet converted the sediments to crude oil. Kerogen can be used to create superior quality jet fuel, #2 diesel, naphtha, and other 
high value by-products. The amount of kerogen in “oil shale” ore can range from 10 to 60 or more gallons per ton3 of shale. 
The most concentrated hydrocarbon deposits on earth are found in America’s western oil shale resources. It is estimated that 
the total amount of oil shale resource in the United States is over 6 trillion barrels of oil equivalent3. This resource has already 
been identified and extensively characterized. Table 1 displays the richness of the various oil shale deposits in the United 
States. Yields greater than 25 gallons per ton (gal/ton) are generally viewed as the most economically attractive, and hence, 
Figure 5: Principal Oil Shale Deposits in the Western United States4 
Deposits Richness (Gallons/ton) 
Location 5 - 10 10 - 25 25 - 100 
Colorado, 
Wyoming & 
Utah (Green 
4,000 2,800 1,200 
River) 
Central & 
Eastern 
States 
2,000 1,000 NA 
Alaska Large 200 250 
Total 6,000+ 4,000 2,000+ 
0 
1975 1980 1985 1990 1995 2000 2005 2010 2015 2020 2025 2030 
65% 
59% 
U.S. Production 
MMBbl/d 
Table 1: U.S. Oil Shale Resources in Place – 
Billion Bbls3
the most favorable for initial development. Of the 6 trillion barrels of resource in place, over 2.0 trillion barrels have yields 
greater than 25 gal/ton3. The majority of this high-quality resource, 1.2 trillion barrels, is located in the Green River 
Formation. This region underlies 17,000 square miles or 11 million acres in the Piceance (CO), Uinta (UT), Green River, 
Washakie (WY), and Sand Wash (CO) Basins (Fig. 5). 
About 73 percent of the lands that contain significant oil shale deposits in the west are owned and managed by the U.S. 
Government. These lands contain about 80 percent of the known recoverable resource in Colorado, Utah, and Wyoming. 
Private company ownership of oil shale lands totaled about 21% of the Piceance Basin (Colorado), 9% of the Uinta Basin 
(Utah), 24% of the Green River Basin (Wyoming), and 10% of the Washakie Basin (Wyoming)3 as of 1978. 
Oil Shale Technology 
Oil shale rock must be heated to temperatures between 400 
and 500 degrees centigrade (650-750 degrees fahrenheit). 
This heating process is necessary to convert the embedded 
sediments to kerogen oil and combustible gases. Over the past 
60 years, energy companies and petroleum researchers have 
developed, tested, enhanced, and in many cases, demonstrated 
a variety of technologies for recovering shale oil from oil 
shale and processing it to produce fuels and byproducts. Both 
surface processing and in-situ technologies have been 
examined. Generally, surface processing consists of three 
major steps: (1) oil shale mining and ore preparation, (2) 
pyrolysis of oil shale to produce 
kerogen oil, and (3) processing 
kerogen oil to produce refinery 
feedstock and high-value 
chemicals. This sequence is 
illustrated in Figure 6-A. For 
deeper, thicker deposits, not as 
amenable to surface or deep-mining 
methods, the kerogen oil 
can be produced by in-situ 
technology. In-situ processes 
minimize, or in the case of true in-situ, 
eliminate the need for mining 
and surface pyrolysis, by heating 
the resource in its natural 
depositional setting. This sequence 
is illustrated in Figure 6-B4. 
The U.S. Department of 
Figure 6: Oil Shale Recovery Processes5 
A - Surface Process 
Ore Resource Mining Retorting Oil Upgrading 
Premium 
Refinery 
Feed 
B - In-Situ Process 
Resource In-Situ Conversion Oil Upgrading 
Premium 
Refinery 
Feed 
Figure 7: Companies with Oil Shale Technologies5 
Energy, Office of Naval Petroleum 
and Oil Shale Reserves (NPOSR), 
has recently published a 
comprehensive report detailing oil 
shale conversion technologies5. 
This report describes the 
technologies being pursued by 27 different companies in the United States. Figure 7 provides a listing of the companies 
currently pursuing oil shale technology in the design phase, laboratory, or pilot testing. 
RD&D Leasing Program 
In response to the President’s National Energy Policy in 2003, the Department of the Interior’s Bureau of Land Management 
(BLM) prepared a report6 and a plan to address access to unconventional resources (such as oil shale) on public lands. The 
report also included a plan for addressing impediments to oil shale development on public lands, industry interest in research 
and development and commercial development opportunities on public lands, and, options to capitalize on those 
opportunities. 
On November 22, 2004, the BLM published a proposed oil shale lease form and request for information in the Federal 
Register7 to solicit comments about the design of an oil shale program. Based on its findings and responses to the Federal
Register notice, the BLM determined that offering Research, Development, and Demonstration (RD&D) leases prior to 
issuing commercial leases would facilitate economic and technology demonstration, provide an opportunity to better 
understand the environmental impacts, and then gauge the effectiveness of mitigation measures. The BLM RD&D lease 
program allows tracts of up to 160 acres to be used to test or 
demonstrate the economic feasibility of technologies over a 
lease term of 10 years, with an option for up to a 5-year 
extension. The payment of royalties is waived during the 
RD&D lease and the rental fee is waived for the first 5 years. 
Lessees that demonstrate successful technology may reserve 
an additional contiguous 4,960 acres for a preference right 
commercial lease. 
The BLM received 19 nominations in response to its June, 
2005 oil shale RD&D lease announcement. On December 15, 
2006, Chevron Shale Oil Company, EGL Resources, Inc., and 
Shell Frontier Oil & Gas were awarded leases (three to Shell). 
A sixth lease was later granted to Oil Shale Exploration, LLC 
(OSEC). The Chevron, EGL, and Shell leases are located on 
BLM lands in Colorado, while the OSEC lease involves 
Figure 8: Location of Oil Shale RD&D Leases15 
parcels in Utah. Five of the projects selected involve in-situ retorting (Fig. 8). A brief description of these technologies is 
provided below8. 
ƒ Chevron Oil Shale Company, USA. Chevron’s technology for the 
recovery and upgrading of oil from shale (CRUSH) process is an in-situ 
conversion process. This process involves the application of a 
series of fracturing technologies which rubblize the formation, 
thereby increasing the surface area of the exposed kerogen (Fig. 9). 
This exposed kerogen in the fractured formation is then converted 
through a chemical process resulting in the kerogen changing from a 
solid material to a liquid and gas. The hydrocarbon fluids are then 
recovered and improved to refinery feedstock specs5. 
ƒ American Shale Oil, LLC (AMSO). AMSO has developed a new 
process for in-situ retorting of Green River oil shale. The AMSO Oil 
Shale Process (patent applied for) involves the use of proven oil field 
drilling and completion practices coupled with AMSO’s unique 
heating and recovery technology (Fig. 10). The AMSO approach is a 
closed loop in-situ retorting process with advantages of energy 
efficiency and manageable environmental impacts. The oil shale is 
heated with superheated steam or other heat transfer medium 
through a series of pipes placed below the oil shale bed to be 
Figure 9: Chevron’s CRUSH Technology5 
Chevron’s Technology Schematic 
Figure 10: AMSO Resources Process5 
retorted. Shale oil 
and gas are produced 
through wells drilled 
vertically from the 
surface and 
“spidered” to provide 
a connection 
between the heating 
wells and production 
system. Convection 
and refluxing are 
mechanisms that 
improve heat transfer 
to retort the oil shale. 
After initial start-up, the process uses the gas produced from retorting to 
supply all the heat required to extract the shale oil and gas from the 
deposit. Surface disturbance is minimized with this process by heating 
through lateral piping. Energy efficiency is optimized by recovery of 
heat from the shale rock after retorting is completed5. 
Figure 11: Shell’s ICP Process5
ƒ Shell Frontier Oil & Gas Inc. Shell’s innovative In-situ Conversion Process generates more oil and gas from a smaller 
surface pad area than previous oil shale processes (Fig. 11). Shell’s Conversion Process does not involve surface mining. 
Rather, heaters are inserted underground to convert kerogen in oil shale into high quality transportation fuels. In the 
Shell ICP process: 5: Electric heaters gradually heat shale beneath the surface at target depths typically from 1,000 to 
2,000 feet; the rock formation is heated slowly over time to 650 to 750° F, changing the kerogen in oil shale into oil and 
gas; products are pumped to the surface using traditional methods. The process produces approximately one third gas and 
two thirds light oil. Fewer processing steps are required than in surface processes to produce high quality fuels. 
ƒ Oil Shale Exploration Company, LLC. OSEC has tested the Alberta Taciuk Process (ATP), a horizontal rotating kiln 
process, for development of Utah 
oil shale. OSEC has arranged for 
Figure 12: Oil Shale Exploration’s Alberta Taciuk Process (ATP) Retort5 
an exclusive right from AECOM, 
a worldwide engineering firm, to 
license the ATP Process for 
purposes of research, 
development and demonstration 
on the BLM lease at the White 
River Mine south of Vernal, Utah. 
The ATP Process is a unique 
thermal processing technology, 
applicable to numerous industrial 
uses, for vaporizing and 
recovering organic constituents 
that exist in a large range of feedstock materials (Fig. 12). Developed in 1976, the ATP Process was originally designed 
for treating Alberta oil sands and was later refined for use in oil shale and contaminated waste treatment options. 
According to OSEC, the ATP Process has been successfully used in a project in Stuart, Australia which produced more 
than 1.5 million barrels of shale oil. OSEC believes that the ATP Process is a proven, environmentally-sound, economic 
and efficient process for extracting oil from oil shale and oil sands5. OSEC has also recently entered into agreements to 
test Petrobras’s PetroSix vertical Gas Combustion Retort technology. 
In addition to the technologies being 
Figure 13: EcoShale’s In-Capsule Process16 
tested as part of the RD&D program, an 
additional technology is currently being field 
tested. The EcoShale In-Capsule Process is 
an innovative new approach to oil shale 
processing that is being developed and tested 
COOL GAS 
by Red Leaf Resources, Inc. in the State of 
Utah. Red Leaf’s Eco-Shale is a hybrid 
HOT GAS 
approach that integrates surface mining with a 
lower-temperature, “roasting” method that 
occurs in an impoundment that is constructed 
in the void space created by the shale mining 
excavation (Fig. 13). When filled with shale, 
the capsule is heated using pipes circulating 
hot gases derived from burning natural gas or 
its own produced gases. By using an impoundment engineered with an impermeable barrier, RedLeaf expects tailings to be 
sequestered and ground water to be protected. To maximize energy efficiency, the process heat used in one capsule can be 
recovered by circulating lower temperature gases which transfer remaining heat into adjacent capsules. External energy 
inputs are limited to process initiation, thereafter produced gases supply most of the energy for shale heating. The EcoShale 
In-Capsule process’s lower-temperature, slower “roasting” approach also minimizes CO2 emissions and is amenable to 
carbon capture and sequestration. The unique impoundment approach allows for rapid reclamation and approximate 
restoration of the topography. 
Oil Shale Development Economics 
The potential for oil shale production and the resulting benefits to the national economy are discussed in the section. The 
results presented are not intended to be a forecast of what will occur. Rather, they represent estimates of potential under 
certain economic, technological, and market assumptions and constraints.
Analytical Approach 
The U.S. Department of Energy (DOE) has developed a new National 
Oil Shale Model9. This analytical system was developed to evaluate 
potential U.S. oil shale development under different economic and 
public policy regimes. This model has the capability to perform 
sensitivity analyses relative to price, tax, royalty and incentives, perform 
cash flow analyses under alternative leasing options and evaluate costs 
and benefits of various public policy options to stimulate oil shale 
project investment. (Figure 14 ). The model consists of three parts: a 
detailed resource module, technology screening module, and a detailed 
economic module. 
ƒ The Resource Module contains detailed petrophysical and 
Figure 14: DOE’s National Oil Shale Model9,10 
geological characterestics for 25 development tracts in the states of 
Colorado, Utah, and Wyoming. Seventy billion barrels of resource 
in place are collectively found in these tracts. Characteristics of 
these 25 tracts were studied in detail as part of the 1973 Department 
of Interior Prototype Oil Shale Leasing Program. Because of prior industry nomination, it is assumed that these tracts 
represent locations of commercial interests. These nominated tracts therefore provide a solid technical basis for the 
present analysis. 
ƒ Screening Module: Screening criteria for various technologies were developed based on the geological characteristics 
such as depth, dip angle, yield and thickness of the resource. The technologies considered are: 1) Surface mining with 
surface retorting, 2) Underground mining and surface retorting, 3) Modified In-Situ (MIS), and 4) True In-Situ (TIS) 
similar to Shell’s ICP process. Each of these 25 tracts was screened for each of the above technology options. Each tract 
was then assigned the most appropriate technology and evaluated under the specific process. Each tract was also 
assigned a specific development schedule based on the type of technology applied. 
ƒ Economic Module: The production forecasts, predicted for each tract (based on its development schedule), are used in 
the economic model for cash flow analysis. The economic model estimates annual and cumulative cash flow before and 
after taxes, capital costs, operating cost, transfer payments (royalties), revenues, and profits. The tracts that meet the 
economic hurdles are then carried forward and results are aggregated to national total. The economic model has average 
capital and operating costs based on technology and development schedule over the life of the project. The different 
technologies used for mining, retorting, and upgrading were considered in the components of the costs. 
In addition to estimating benefits at the national level, the model also estimates a number of economic benefits at state 
levels. The benefits to local, state, and Federal treasuries are attributed to the implementation of economically feasible 
projects over the next 25 years. These benefits include: 1) Direct Federal Revenues; defined as the sum of business taxes as 
well as one-half of royalty payments on oil shale production from Federal lands, 2) Direct State Revenues; defined as the sum 
of business taxes, production taxes, as well as one-half of royalty payments on oil shale production from Federal lands, and 
3) Direct Public Sector Revenues; defined as the sum of the Direct Federal and Direct State Revenues. 
Oil shale production can benefit the nation as a whole on many levels. For example, each additional barrel of domestic 
production can replace a barrel of oil imports. and reduce the trade deficit by the cost of that barrel. To estimate the direct 
effects on the GDP (excluding the multiplier effect and potential negative impacts on other domestic export industries), the 
model uses the gross revenue from the potential oil shale production, inclusive of oil, natural gas, and ammonia. Similarly, 
the value of potential production is used to measure the impact on the trade deficit. The model also estimates potential 
employment associated with the oil shale projects. Labor costs (wages and fringe benefits) are calculated by isolating the 
labor component of all major cost elements. Labor costs are then converted into estimated annual employment using average 
wages (including benefits) for comparable industries as reported by the U.S. Department of Labor. 
Project Costs 
Oil shale projects, on a commercial scale, could range in size from 10,000 to 100,000 barrels per day (Bbl/d) for a surface 
retort to as much as 300,000 Bbl/d for full-scale in-situ projects. The capital and operating costs will vary depending on the 
process technology and the quality of the resource. The model estimates the operating costs to be in the range of $12 to $20 
per barrel ($/Bbl) of shale oil produced. The capital costs are estimated to range from $40,000 to $55,000 per stream day 
barrel of daily capacity10. Mining (or drilling), retorting, and upgrading are also included in these costs. It is important to 
note that these costs pertain to fully operational first generation projects; They will change with time as technologies matures. 
Minimum Economic Price 
The minimum economic price is defined as the world crude oil price needed to yield a 15% rate of return (ROR) on the
project. The 15% ROR is to cover the cost of capital and the technical and financial risk on the project. Depending on the 
technology used, and the quality of the resource, the minimum economic price for oil shale projects is variable. Under the 
assumptions utilized in this analysis, the model estimates that for a mature 100,000 Bbl/d capacity plant, the average 
minimum economic prices are $38/Bbl for True In-Situ, $47/Bbl for Surface Mining, $57/Bbl for Underground Mining, and 
$62/Bbl for Modified In-situ. While these estimates are 
highly sensitive to both technological and economic 
assumptions, discussions with industry have proven these 
estimates reasonable. A rationale for these estimates is 
provided in Reference 10. 
Potential Shale Oil Production 
The production potential of the 25 tracts (70 billion barrels of 
resource in place) was measured in three development 
scenarios. These scenarios are: 1) Business as usual scenario 
(BAU) -- assumes no changes to current law and that future oil 
prices remain in the range of high $40s to $60/Bbl as predicted 
by the Energy Information Administration (EIA) in its 2006 
Annual Energy Outlook (Reference Price Track)1, 2) The Tax 
incentive scenario, assumes targeted tax incentives are 
available until project payback to encourage investments. 
Examples are price guarantees and production tax credit, and 
3) The RD&D scenario assumes limited public support for 
R&D and field demonstration projects at commercially viable 
scale to reduce project risk. These scenarios were selected for 
sensitivity analysis purposes, and are not intended to be policy 
recommendations. 
Under the BAU scenario, shale oil production could reach 
500,000 Bbl/d by 2020 and would remain steady through 2035 
(Fig. 15). With targeted tax incentives, shale oil production 
could reach 1.5 MMBbl/d by 2035 as shown in Fig. 15. Risk 
reduction through RD&D could have a significant positive 
impact on future shale oil development in the United States. 
RD&D projects would work to accelerate the rate of oil shale 
development. With successful RD&D, it is estimated that the 
oil shale production could reach 2.4 MMBbl/d by 2025. It is 
important to note that because oil shale project development 
requires long lead times, no significant production is 
expected until 2015 under any of the three analyzed 
scenarios. 
In addition to shale oil, a significant quantity of 
hydrocarbon gas could also be produced. Gas production 
varies as a percentage of total production depending on the 
surface retorting or in-situ technology; however, gas 
production could reach as much as 3.2 billion cubic feet per 
day (BCF/d). Although a significant quantity of produced 
gas could be consumed within oil shale facilities for process 
heat, power generation, or other process requirements. 
Alternatively, much of this gas could be upgraded to 
pipeline quality and contribute to meeting regional and 
national natural gas demands (Fig. 16). 
Economic Benefits 
The potential economic benefits associated with the oil shale 
development activities for the three analyzed scenarios are 
summarized in Table 2. These estimates reflect the benefits 
cumulated over the next 30 years. Cumulative shale oil 
production could reach 12.8 billion barrels. This level of 
2,500 
2,000 
1,500 
1,000 
500 
Figure 15: Potential Shale Oil Production9 
Figure 16: Associated Natural Gas with Shale Oil Production9 
4,000 
3,500 
3,000 
2,500 
2,000 
1,500 
1,000 
500 
Item Unit Business 
as Usual 
RD&D 
Targeted Incentives 
RD&D 
With 
Targeted 
Tax 
Incentive 
With 
RD&D 
Production Billion Bbls 3.2 7.4 12.8 
Direct 
Federal 
Billion $ 15 27 48 
Revenues 
Direct 
Local/State 
Revenues 
Billion $ 10 21 37 
Direct 
Public 
Sector 
Revenues 
Billion $ 25 48 85 
Contribution 
to GDP Billion $ 310 770 1300 
Value of 
Imports 
Billion $ 70 170 325 
Avoided 
New Jobs FTE 
(Thousand) 60 190 300 
0 
2005 2010 2015 2020 2025 2030 2035 
Year 
MMBbl/d 
Business as Usual 
0 
2005 2010 2015 2020 2025 2030 2035 
Year 
MMiillliloionn S SCCFF/d/d 
Targeted Incentives 
Business as Usual 
Table 2: Example Benefits of Oil Shale Development 
(Cumulative Over 30 Years)9
production could generate an additional $15 billion to $48 billion of Direct Revenues to the Federal treasury. Direct State 
Revenues could increase by as much as $37 billion across the analyzed scenarios. The contribution to GDP is estimated to be 
between $310 billion and $1.3 trillion. The value of imports avoided due to domestic production could reach $325 billion 
over the next 30 years. The impact on employment is also significant. It is estimated that up to 300,000 new high paying jobs 
could be generated in support of oil shale development. 
Oil Shale and the Environment 
Land Use and Surface Impacts 
The technology that will be used to mine and produce oil shale is dependent on depth, thickness, richness, and accessibility of 
the deposit. Deeper and thicker beds will likely be produced in-situ. A combination of approaches will likely be used in the 
western U.S. basins. Various land impacts are associated with each type of oil shale processing. Open-Pit (surface) mining 
involves significant surface disturbance and can impact surface-water runoff patterns and subsurface water quality. 
Experience in coal mining and other mining industries has demonstrated that impacted lands can be very effectively 
reclaimed with minimal long-term effect. 
In 1972, the Department of the Interior estimated the cumulative surface area impacted by a domestic oil shale industry, 
over a 40 year period, would be approximately 31 square miles per million barrels of daily shale oil production capacity. The 
Department of Interior has also estimated that the cumulative surface area impacted by a domestic oil shale industry, over the 
same 40 year period, would be approximately 21 square miles per 1.5 MMBbl/d capacity for an In-situ processes. In total, a 
2.5 MMBbl/d industry would impact approximately 0.5% of the surface area overlaying the Green River Formation12. 
Air Quality Impact 
Oil shale is a carbonate rock that, when heated to 450 to 500 degrees centigrade, creates kerogen oil and hydrocarbon gases 
along with a slate of other gases, that may include: (1) oxides of sulfur and nitrogen, (2) carbon dioxide, (3) particulate 
matter, and (4) water vapor. Commercially available stack gas clean-up technologies that are currently in use in electric 
power generation and petroleum refining facilities have improved over the years and should be effective in controlling oxides 
and particulates emissions from oil shale projects. Carbon dioxide (CO2) will also be produced in large quantities and may 
need to be captured for use in other commercial applications (such as enhanced oil recovery or coalbed methane operations), 
or otherwise sequestered. Depleted oil and gas reservoirs in the region provide potentially effective sequestration targets12. 
Water Requirements 
The water required for oil shale retorting is estimated at one to three barrels of water per barrel of shale oil. Still, some 
processes may be net producers of water. For an oil shale industry producing 2.5 MMBbl/d, this equates to between 105 and 
315 million gallons of water per day (MGD). A 2.5 MMBbl/d oil shale industry would require 0.18 million to 0.42 million 
acre feet of water per year, depending on location and processes used. 
In the West, water will be drawn from local and regional sources. The major water source is the Colorado River Basin, 
including the Colorado, Green, and White Rivers. The Colorado River flows between 10 and 22 million acre feet per year. 
Water may also be purchased from other existing reservoirs. In addition, transfers may be possible from other water basins, 
including the Upper Missouri. Another water source will come from western oil shale itself, which has high water content. 
Oil shale typically holds 2-5 gallons of water per ton, though some oil shale can contain as much as 30-40 gallons of water 
per ton. Much of this connate water can be recovered during processing and used to support mining, disposal, or reclamation 
operations. Though this produced water will contain organic and inorganic substances, the impurities can be removed with 
conventional water treatment technologies. Recycling and re-use of process water will help to reduce water requirements13. 
Produced water from other conventional and unconventional oil and gas operations may also provide a water source. 
Limitation of the Economic Analysis 
The economic analysis presented in this paper has important limitations that should be considered before using its results. 
These limitations include: 
ƒ The results pertain only to the 25 Federal tracts analyzed. These tracts collectively account for about 70 billion barrels of 
oil shale resource in the states of Colorado, Utah, and Wyoming. No extrapolation was attempted to include the balance 
of the resource in these three states. The analysis makes the assumption that these tracts are accessible for development. 
ƒ The analysis assumes that current technologies are successfully demonstrated to be viable at commercial scale over the 
next five to ten years. To the extent that this is not achieved, the development of the resource will be impeded. 
ƒ The analysis assumes that the environmental permitting process for the oil shale projects could be completed within three 
to five years. To the extent that the permitting process is not streamlined, and additional time is required, the timing of the 
oil shale production will be impacted.
ƒ The analysis is based on the AEO 2006 oil price projection (Reference Price Track) over the next 25 years. To the extent 
that the prevailing oil prices over this period are different from the AEO projections, the estimated benefits will be 
different from the level shown in this paper. Moreover, the BAU case analysis assumes an average minimum rate of 
return of 15 percent by operators. To the extent that different operators may require differing return on their investments, 
the potential benefits in this analysis may be overestimated or understated. 
ƒ The economics are based on the use of average costing algorithms. Although developed from the best available data and 
explicitly adjusted for variations in energy costs, they do not reflect site-specific cost variations applicable to specific 
operators. To the extent that the average costs (used) understate or overstate the true project costs, the actual results will 
be impacted accordingly. 
ƒ The estimates of potential contribution to GDP, values of imports avoided, and employment do not take into account 
potential impacts to other sectors of the U.S. economy from altering trade patterns. It is possible that reduction in 
petroleum imports, depending on where the petroleum was coming from, could reduce the quantity being exported of 
some other good. It is likely, however, that such effects would be small. 
ƒ The analysis assumes that operators have access to capital to start and sustain the oil shale projects. The oil shale projects 
are typically characterized as “capital intensive” and have longer payback period relative to oil and gas development 
projects. To the extent that capital is constrained, then the potential benefit estimated in this report is overestimated. 
None of the above limitations, however, invalidate the results in this analysis if they are viewed for what they are 
intended for, which is an estimate of upside potential. Given the uncertainty of the size and combinations of the optimistic 
and pessimistic biases introduced by these limitations, it is assumed that the approach is valid, and the estimates are 
reasonable, again for what they are intended. 
Conclusions 
The U.S. oil shale resources are the most concentrated hydrocarbon deposits on earth, with over two trillion barrels of high 
quality resource in place. Rapidly advancing conversion technologies, high oil prices, rising world demand for liquid 
hydrocarbons, and the continued decline of U.S. conventional oil production, have all recently attracted significant attention 
to the development of the oil shale resource. Currently, twenty seven companies are actively pursuing the development of oil 
shale conversion technologies with significant progress. The development of this resource could have a significant positive 
impact on the local, state, and national economy by means of revenues, royalties, contributions to GDP, the value of avoided 
oil imports, and a possible production rate of about 2.4 MMBbl/d. Collaborative efforts are needed among local, state, and 
Federal Governments, along with the private sector to encourage the development of this very important strategic resource. 
Acknowledgements 
The authors wish to thank the DOE, Office of Naval Petroleum and Oil Shale Reserves for permission to use its data and 
model and other information critical to completing this manuscript. Also, the authors thank the staff of INTEK, Inc. for their 
immense efforts in preparing this manuscript. The staff includes Mr. Jeffrey Stone (Research Assistant), and Mr. Harry 
Johnson (Principal Petroleum Engineer). While acknowledging the significant contribution of these individuals, any errors of 
fact or inconsistencies remain the responsibility of the principal author. 
References 
1. Energy Information Administration, Annual Energy Outlook (2008), Washington, D.C. 
2. Energy Information Administration, Annual Energy Review (2008), Washington, D.C. 
3. U.S. Department of Energy, Office of Petroleum Reserves – Strategic Unconventional Fuels, Fact Sheet: U.S. Oil 
Shale Resources (September, 2006), Washington, D.C. 
4. U.S. Department of Energy, Office of Petroleum Reserves Office of Naval Petroleum and Oil Shale Reserves, 
Strategic Significance of America’s Oil Shale Resource: Volume 2 – Oil Shale Resources Technology and 
Economics (March 2004), Washington, D.C. 
5. U.S. Department of Energy, Office of Petroleum Reserves, Office of Naval Petroleum and Oil Shale Reserves, 
Secure Fuels from Domestic Resources, The Continuing Evolution of America’s Oil Shale and Tar Sands 
Industries: Profiles of Companies Engaged in Domestic Oil Shale and Tar Sands Resource and Technology 
Development (June, 2007) 
6. Chad Calvent, Deputy Assistant Secretary for Land and Minerals Management, US Department of the Interior, 
Testimony before the Committee on Resources, Subcommittee on Energy and Mineral Resources, U.S. House of
Representatives, The Vase North American Resource Potential of Oil Shale, Oil Sands, and Heavy Oil – Part 2 ( 
June 30, 2005). 
7. Department of the Interior, Bureau of Land Management, Potential for Oil Shale Leasing, Federal Register, Vol. 
69, No. 224, pp. 67935 (November 22, 2004). 
http://a257.g.akamaitech.net/7/257/2422/06jun20041800/edocket.access.gpo.gov/2004/pdf/04-25761.pdf 
8. Oil Shale and Tar Sands Leasing Programmatic EIS Information Center. http://ostseis.anl.gov/index.cfm 
9. U.S. Department of Energy, Office of Petroleum Reserves, Office of Naval Petroleum and Oil Shale Reserves, 
National Oil Shale Model, A Decision Support System, (June 2005) 
10. Biglarbigi, Khosrow, INTEK Inc., Oil Shale Development Economics, Presented at the EFI Heavy Resources 
Conference (May 16th, 2007), Edmonton, Canada 
11. Energy Information Administration, Annual Energy Review (2005), Washington, D.C. 
12. U.S. Department of Energy, Office of Petroleum Reserves, Fact Sheet: Oil Shale and the Environment 
(September, 2006), Washington, D.C. 
13. U.S. Department of Energy, Office of Petroleum Reserves, Fact Sheet: Oil Shale Water Resources (September, 
2006), Washington, D.C. 
14. Energy Information Administration, International Energy Outlook (2005), Washington, D.C. 
15. Biglarbigi, Khosrow, INTEK Inc., Potential Development of United States Oil Shale Resrouces, Presented at the 
2007 EIA Energy Outlook Conference (March 28th, 2007), Washington, D.C. 
16. Crawford, Peter, INTEK Inc., Advances in World Oil Shale Production, Presented at the 2008 Society of 
Petroleum Engineers Annual Technical Conference and Expo (September 22nd, 2008), Denver, Colorado.

More Related Content

What's hot

Is Deep Water Oil Drilling a National Security Issue
Is Deep Water Oil Drilling a National Security IssueIs Deep Water Oil Drilling a National Security Issue
Is Deep Water Oil Drilling a National Security IssueZiad K Abdelnour
 
ARMY ENERGY STRATEGY FOR THE END OF CHEAP OIL
ARMY ENERGY STRATEGY FOR THE END OF CHEAP OILARMY ENERGY STRATEGY FOR THE END OF CHEAP OIL
ARMY ENERGY STRATEGY FOR THE END OF CHEAP OILLex Pit
 
Geopolitics in oil and gas market
Geopolitics in oil and gas marketGeopolitics in oil and gas market
Geopolitics in oil and gas marketAdjei Sephen
 
Commodity markets outlook
Commodity markets outlookCommodity markets outlook
Commodity markets outlookDr Lendy Spires
 
Crude Oil Fundamentals Explained
Crude Oil Fundamentals ExplainedCrude Oil Fundamentals Explained
Crude Oil Fundamentals ExplainedRISHABH SURANA
 
Economy of Oil Price
Economy of Oil PriceEconomy of Oil Price
Economy of Oil PricePrasant Patro
 
U.S. Petrochemical Industry Future - Upstream - Crude Oil - Logic Versus Fai...
U.S. Petrochemical Industry Future -  Upstream - Crude Oil - Logic Versus Fai...U.S. Petrochemical Industry Future -  Upstream - Crude Oil - Logic Versus Fai...
U.S. Petrochemical Industry Future - Upstream - Crude Oil - Logic Versus Fai...Bruce LaCour
 
MLA_Impacts of low oil prices on American unconventional and offshore oil pro...
MLA_Impacts of low oil prices on American unconventional and offshore oil pro...MLA_Impacts of low oil prices on American unconventional and offshore oil pro...
MLA_Impacts of low oil prices on American unconventional and offshore oil pro...Mohamed Lahjibi
 
Oil price - Demand or supply factors at work
Oil price - Demand or supply factors at workOil price - Demand or supply factors at work
Oil price - Demand or supply factors at workradhikaburman
 
The Economics of Oil
The Economics of Oil The Economics of Oil
The Economics of Oil michaelpopove
 
TD Securities Calgary Energy Conference 2014
TD Securities Calgary Energy Conference 2014TD Securities Calgary Energy Conference 2014
TD Securities Calgary Energy Conference 2014Enbridge Inc.
 
How The Global Automobile & Airline Industries Are Impacting The Global E...
How The Global Automobile & Airline Industries Are Impacting The Global E...How The Global Automobile & Airline Industries Are Impacting The Global E...
How The Global Automobile & Airline Industries Are Impacting The Global E...Vincent J. Lentini
 
Markets for oil, gas, coal, electricity and renewable energy resources...
Markets  for  oil,  gas,  coal,  electricity  and  renewable energy resources...Markets  for  oil,  gas,  coal,  electricity  and  renewable energy resources...
Markets for oil, gas, coal, electricity and renewable energy resources...Sidharth Gautam
 

What's hot (20)

Is Deep Water Oil Drilling a National Security Issue
Is Deep Water Oil Drilling a National Security IssueIs Deep Water Oil Drilling a National Security Issue
Is Deep Water Oil Drilling a National Security Issue
 
WORLD PETROLEUM RESERVES
WORLD PETROLEUM RESERVESWORLD PETROLEUM RESERVES
WORLD PETROLEUM RESERVES
 
ARMY ENERGY STRATEGY FOR THE END OF CHEAP OIL
ARMY ENERGY STRATEGY FOR THE END OF CHEAP OILARMY ENERGY STRATEGY FOR THE END OF CHEAP OIL
ARMY ENERGY STRATEGY FOR THE END OF CHEAP OIL
 
Geopolitics in oil and gas market
Geopolitics in oil and gas marketGeopolitics in oil and gas market
Geopolitics in oil and gas market
 
Factors affecting demand and supply of oil
Factors affecting demand and supply of oilFactors affecting demand and supply of oil
Factors affecting demand and supply of oil
 
Commodity markets outlook
Commodity markets outlookCommodity markets outlook
Commodity markets outlook
 
Crude Oil Fundamentals Explained
Crude Oil Fundamentals ExplainedCrude Oil Fundamentals Explained
Crude Oil Fundamentals Explained
 
Crude Oil Price Formation
Crude Oil Price FormationCrude Oil Price Formation
Crude Oil Price Formation
 
Economy of Oil Price
Economy of Oil PriceEconomy of Oil Price
Economy of Oil Price
 
U.S. Petrochemical Industry Future - Upstream - Crude Oil - Logic Versus Fai...
U.S. Petrochemical Industry Future -  Upstream - Crude Oil - Logic Versus Fai...U.S. Petrochemical Industry Future -  Upstream - Crude Oil - Logic Versus Fai...
U.S. Petrochemical Industry Future - Upstream - Crude Oil - Logic Versus Fai...
 
MLA_Impacts of low oil prices on American unconventional and offshore oil pro...
MLA_Impacts of low oil prices on American unconventional and offshore oil pro...MLA_Impacts of low oil prices on American unconventional and offshore oil pro...
MLA_Impacts of low oil prices on American unconventional and offshore oil pro...
 
Oil price - Demand or supply factors at work
Oil price - Demand or supply factors at workOil price - Demand or supply factors at work
Oil price - Demand or supply factors at work
 
Oil: History & Outlook
Oil: History & OutlookOil: History & Outlook
Oil: History & Outlook
 
The Economics of Oil
The Economics of Oil The Economics of Oil
The Economics of Oil
 
TD Securities Calgary Energy Conference 2014
TD Securities Calgary Energy Conference 2014TD Securities Calgary Energy Conference 2014
TD Securities Calgary Energy Conference 2014
 
Natural gas outlook ppt
Natural gas outlook pptNatural gas outlook ppt
Natural gas outlook ppt
 
2015 UPDATE: PEAK OIL
2015 UPDATE: PEAK OIL 2015 UPDATE: PEAK OIL
2015 UPDATE: PEAK OIL
 
How The Global Automobile & Airline Industries Are Impacting The Global E...
How The Global Automobile & Airline Industries Are Impacting The Global E...How The Global Automobile & Airline Industries Are Impacting The Global E...
How The Global Automobile & Airline Industries Are Impacting The Global E...
 
Oil Report
Oil ReportOil Report
Oil Report
 
Markets for oil, gas, coal, electricity and renewable energy resources...
Markets  for  oil,  gas,  coal,  electricity  and  renewable energy resources...Markets  for  oil,  gas,  coal,  electricity  and  renewable energy resources...
Markets for oil, gas, coal, electricity and renewable energy resources...
 

Viewers also liked

Presentaciones Digitales.
Presentaciones Digitales. Presentaciones Digitales.
Presentaciones Digitales. OrianaRod
 
Presentaciones Digitales
Presentaciones DigitalesPresentaciones Digitales
Presentaciones Digitalesalf3600
 
PRESENTACIÓN DIGITAL
PRESENTACIÓN DIGITALPRESENTACIÓN DIGITAL
PRESENTACIÓN DIGITALbeads09
 
Presentaciones digitales
Presentaciones digitalesPresentaciones digitales
Presentaciones digitalespekozita
 
A crime so monstrous
A crime so monstrousA crime so monstrous
A crime so monstrousMissing Link
 
Sample slides by Garr Reynolds
Sample slides by Garr ReynoldsSample slides by Garr Reynolds
Sample slides by Garr Reynoldsgarr
 
Eco-nomics, The hidden costs of consumption
Eco-nomics, The hidden costs of consumptionEco-nomics, The hidden costs of consumption
Eco-nomics, The hidden costs of consumptionJosh Beatty
 
Healthcare Napkins All
Healthcare Napkins AllHealthcare Napkins All
Healthcare Napkins AllDan Roam
 

Viewers also liked (16)

Presentaciones Digitales.
Presentaciones Digitales. Presentaciones Digitales.
Presentaciones Digitales.
 
1 Qué es una presentación digital
1 Qué es una presentación digital1 Qué es una presentación digital
1 Qué es una presentación digital
 
Presentaciones Digitales
Presentaciones DigitalesPresentaciones Digitales
Presentaciones Digitales
 
PRESENTACIÓN DIGITAL
PRESENTACIÓN DIGITALPRESENTACIÓN DIGITAL
PRESENTACIÓN DIGITAL
 
Presentaciones digitales
Presentaciones digitalesPresentaciones digitales
Presentaciones digitales
 
Diapositivas del facebook
Diapositivas del facebookDiapositivas del facebook
Diapositivas del facebook
 
Presentaciones digitales
Presentaciones digitalesPresentaciones digitales
Presentaciones digitales
 
Diapositivas de word[1]
Diapositivas de word[1]Diapositivas de word[1]
Diapositivas de word[1]
 
A crime so monstrous
A crime so monstrousA crime so monstrous
A crime so monstrous
 
Simplicity
SimplicitySimplicity
Simplicity
 
Why most presentations suck
Why most presentations suckWhy most presentations suck
Why most presentations suck
 
Feels Bad On The Back
Feels Bad On The BackFeels Bad On The Back
Feels Bad On The Back
 
Sheltering Wings
Sheltering WingsSheltering Wings
Sheltering Wings
 
Sample slides by Garr Reynolds
Sample slides by Garr ReynoldsSample slides by Garr Reynolds
Sample slides by Garr Reynolds
 
Eco-nomics, The hidden costs of consumption
Eco-nomics, The hidden costs of consumptionEco-nomics, The hidden costs of consumption
Eco-nomics, The hidden costs of consumption
 
Healthcare Napkins All
Healthcare Napkins AllHealthcare Napkins All
Healthcare Napkins All
 

Similar to Oil Shale Economics

The evaluation and management of unconventional reservoir system
The evaluation and management of unconventional reservoir systemThe evaluation and management of unconventional reservoir system
The evaluation and management of unconventional reservoir systemGregory Tarteh
 
129285129 oraganizational-study
129285129 oraganizational-study129285129 oraganizational-study
129285129 oraganizational-studyhomeworkping8
 
Qnb group the US could become energy independent by 2030
Qnb group the US could become energy independent by 2030Qnb group the US could become energy independent by 2030
Qnb group the US could become energy independent by 2030QNB Group
 
Usa gulf coast ports
Usa gulf coast ports Usa gulf coast ports
Usa gulf coast ports Arjun Aarzoo
 
Research Paper: How much oil remains for the world to produce? Comparing asse...
Research Paper: How much oil remains for the world to produce? Comparing asse...Research Paper: How much oil remains for the world to produce? Comparing asse...
Research Paper: How much oil remains for the world to produce? Comparing asse...Energy for One World
 
Haggi IAbdullah HaggiENGLISH 2O1OShannon Branfield.docx
Haggi IAbdullah HaggiENGLISH 2O1OShannon Branfield.docxHaggi IAbdullah HaggiENGLISH 2O1OShannon Branfield.docx
Haggi IAbdullah HaggiENGLISH 2O1OShannon Branfield.docxwhittemorelucilla
 
150512 | Industrie & Energie | Is Saudi Arabia still ruling the OPEC? | Prese...
150512 | Industrie & Energie | Is Saudi Arabia still ruling the OPEC? | Prese...150512 | Industrie & Energie | Is Saudi Arabia still ruling the OPEC? | Prese...
150512 | Industrie & Energie | Is Saudi Arabia still ruling the OPEC? | Prese...Flevum
 
U.S. Petrochemical Industry Future - Upstream - Crude Oil - Logic Versus Fai...
U.S. Petrochemical Industry Future -  Upstream - Crude Oil - Logic Versus Fai...U.S. Petrochemical Industry Future -  Upstream - Crude Oil - Logic Versus Fai...
U.S. Petrochemical Industry Future - Upstream - Crude Oil - Logic Versus Fai...Bruce LaCour
 
Keystone XL Pipeline Update with Notes
Keystone XL Pipeline Update with NotesKeystone XL Pipeline Update with Notes
Keystone XL Pipeline Update with NotesPorts-To-Plains Blog
 
Heavy oil article final_AKG 30 Dec 2013
Heavy oil article final_AKG 30 Dec 2013Heavy oil article final_AKG 30 Dec 2013
Heavy oil article final_AKG 30 Dec 2013ASIM KUMAR GHOSH
 
Peak Oil and Climate Change
Peak Oil and Climate ChangePeak Oil and Climate Change
Peak Oil and Climate Changemcgarciavallejo
 
Carbon Bubble - Making Sense of a "Fossil Market"
Carbon Bubble - Making Sense of a "Fossil Market"Carbon Bubble - Making Sense of a "Fossil Market"
Carbon Bubble - Making Sense of a "Fossil Market"Timon Henze
 
ase for critical thinkingScenarioplanningatRoyalDu.docx
ase for critical thinkingScenarioplanningatRoyalDu.docxase for critical thinkingScenarioplanningatRoyalDu.docx
ase for critical thinkingScenarioplanningatRoyalDu.docxwildmandelorse
 
Case for critical thinkingScenarioplanningatRoyalD.docx
Case for critical thinkingScenarioplanningatRoyalD.docxCase for critical thinkingScenarioplanningatRoyalD.docx
Case for critical thinkingScenarioplanningatRoyalD.docxcowinhelen
 
Understanding the oil business PSO
Understanding the oil business PSOUnderstanding the oil business PSO
Understanding the oil business PSONyssa Razzak
 

Similar to Oil Shale Economics (20)

Lesson7oil
Lesson7oilLesson7oil
Lesson7oil
 
The evaluation and management of unconventional reservoir system
The evaluation and management of unconventional reservoir systemThe evaluation and management of unconventional reservoir system
The evaluation and management of unconventional reservoir system
 
129285129 oraganizational-study
129285129 oraganizational-study129285129 oraganizational-study
129285129 oraganizational-study
 
Qnb group the US could become energy independent by 2030
Qnb group the US could become energy independent by 2030Qnb group the US could become energy independent by 2030
Qnb group the US could become energy independent by 2030
 
Usa gulf coast ports
Usa gulf coast ports Usa gulf coast ports
Usa gulf coast ports
 
Research Paper: How much oil remains for the world to produce? Comparing asse...
Research Paper: How much oil remains for the world to produce? Comparing asse...Research Paper: How much oil remains for the world to produce? Comparing asse...
Research Paper: How much oil remains for the world to produce? Comparing asse...
 
Us shale Gas boom
Us shale Gas boomUs shale Gas boom
Us shale Gas boom
 
Haggi IAbdullah HaggiENGLISH 2O1OShannon Branfield.docx
Haggi IAbdullah HaggiENGLISH 2O1OShannon Branfield.docxHaggi IAbdullah HaggiENGLISH 2O1OShannon Branfield.docx
Haggi IAbdullah HaggiENGLISH 2O1OShannon Branfield.docx
 
Oil industry report
Oil industry reportOil industry report
Oil industry report
 
150512 | Industrie & Energie | Is Saudi Arabia still ruling the OPEC? | Prese...
150512 | Industrie & Energie | Is Saudi Arabia still ruling the OPEC? | Prese...150512 | Industrie & Energie | Is Saudi Arabia still ruling the OPEC? | Prese...
150512 | Industrie & Energie | Is Saudi Arabia still ruling the OPEC? | Prese...
 
U.S. Petrochemical Industry Future - Upstream - Crude Oil - Logic Versus Fai...
U.S. Petrochemical Industry Future -  Upstream - Crude Oil - Logic Versus Fai...U.S. Petrochemical Industry Future -  Upstream - Crude Oil - Logic Versus Fai...
U.S. Petrochemical Industry Future - Upstream - Crude Oil - Logic Versus Fai...
 
Keystone XL Pipeline Update with Notes
Keystone XL Pipeline Update with NotesKeystone XL Pipeline Update with Notes
Keystone XL Pipeline Update with Notes
 
Shale gas
Shale gasShale gas
Shale gas
 
Heavy oil article final_AKG 30 Dec 2013
Heavy oil article final_AKG 30 Dec 2013Heavy oil article final_AKG 30 Dec 2013
Heavy oil article final_AKG 30 Dec 2013
 
Peak Oil and Climate Change
Peak Oil and Climate ChangePeak Oil and Climate Change
Peak Oil and Climate Change
 
Carbon Bubble - Making Sense of a "Fossil Market"
Carbon Bubble - Making Sense of a "Fossil Market"Carbon Bubble - Making Sense of a "Fossil Market"
Carbon Bubble - Making Sense of a "Fossil Market"
 
ase for critical thinkingScenarioplanningatRoyalDu.docx
ase for critical thinkingScenarioplanningatRoyalDu.docxase for critical thinkingScenarioplanningatRoyalDu.docx
ase for critical thinkingScenarioplanningatRoyalDu.docx
 
Assignment on FoPE
Assignment on FoPEAssignment on FoPE
Assignment on FoPE
 
Case for critical thinkingScenarioplanningatRoyalD.docx
Case for critical thinkingScenarioplanningatRoyalD.docxCase for critical thinkingScenarioplanningatRoyalD.docx
Case for critical thinkingScenarioplanningatRoyalD.docx
 
Understanding the oil business PSO
Understanding the oil business PSOUnderstanding the oil business PSO
Understanding the oil business PSO
 

More from Dmitry Tseitlin

Ton Tlegram Open Network
Ton Tlegram Open NetworkTon Tlegram Open Network
Ton Tlegram Open NetworkDmitry Tseitlin
 
State of innovation Thomson Reuters 2016
State of innovation Thomson Reuters 2016 State of innovation Thomson Reuters 2016
State of innovation Thomson Reuters 2016 Dmitry Tseitlin
 
Clarity from above PWC 2016
Clarity from above PWC 2016Clarity from above PWC 2016
Clarity from above PWC 2016Dmitry Tseitlin
 
Отчет Фонд Сколково 25 апреля 2011
Отчет Фонд Сколково 25 апреля 2011Отчет Фонд Сколково 25 апреля 2011
Отчет Фонд Сколково 25 апреля 2011Dmitry Tseitlin
 
Technology roadmap highlights_report 2015
Technology roadmap highlights_report 2015Technology roadmap highlights_report 2015
Technology roadmap highlights_report 2015Dmitry Tseitlin
 
IGS Low cost access to space April 2016
IGS Low cost access to space April 2016IGS Low cost access to space April 2016
IGS Low cost access to space April 2016Dmitry Tseitlin
 
Satellite technologies in UK agriculture 2015
Satellite technologies in UK agriculture 2015Satellite technologies in UK agriculture 2015
Satellite technologies in UK agriculture 2015Dmitry Tseitlin
 
A Roadmap to Interstellar Flight Philip Lubin Physics Dept, UC Santa Barbara ...
A Roadmap to Interstellar Flight Philip Lubin Physics Dept, UC Santa Barbara ...A Roadmap to Interstellar Flight Philip Lubin Physics Dept, UC Santa Barbara ...
A Roadmap to Interstellar Flight Philip Lubin Physics Dept, UC Santa Barbara ...Dmitry Tseitlin
 
Постановление Правительства "О реализации национальной технологической иниц...
Постановление Правительства "О реализации национальной технологической иниц...Постановление Правительства "О реализации национальной технологической иниц...
Постановление Правительства "О реализации национальной технологической иниц...Dmitry Tseitlin
 
ESA - 2013 space transportation
ESA - 2013 space transportation ESA - 2013 space transportation
ESA - 2013 space transportation Dmitry Tseitlin
 
Результаты РФФИ 2015
Результаты РФФИ 2015 Результаты РФФИ 2015
Результаты РФФИ 2015 Dmitry Tseitlin
 
Cоздание сверхтяжелых РН для исследования и освоения Луны и Марса - прошлое, ...
Cоздание сверхтяжелых РН для исследования и освоения Луны и Марса - прошлое, ...Cоздание сверхтяжелых РН для исследования и освоения Луны и Марса - прошлое, ...
Cоздание сверхтяжелых РН для исследования и освоения Луны и Марса - прошлое, ...Dmitry Tseitlin
 
Ракета космического назначения «Зенит 3SL» для программы «Морской Старт» В.М...
Ракета космического назначения «Зенит 3SL» для программы «Морской Старт» В.М...Ракета космического назначения «Зенит 3SL» для программы «Морской Старт» В.М...
Ракета космического назначения «Зенит 3SL» для программы «Морской Старт» В.М...Dmitry Tseitlin
 
Space Works Nano Microsatellite Market forecast 2016
Space Works Nano Microsatellite Market forecast 2016Space Works Nano Microsatellite Market forecast 2016
Space Works Nano Microsatellite Market forecast 2016Dmitry Tseitlin
 
WIPO Global Innovation Index 2015
WIPO Global Innovation Index 2015WIPO Global Innovation Index 2015
WIPO Global Innovation Index 2015Dmitry Tseitlin
 
Agritech Funder Investing report 2015
Agritech Funder Investing report 2015Agritech Funder Investing report 2015
Agritech Funder Investing report 2015Dmitry Tseitlin
 
High technology entrepreneurs and the patent system. 2008 Berkeley
High technology entrepreneurs and the patent system. 2008 BerkeleyHigh technology entrepreneurs and the patent system. 2008 Berkeley
High technology entrepreneurs and the patent system. 2008 BerkeleyDmitry Tseitlin
 
Start-up Space Tauri Group 2016 -
Start-up Space Tauri Group 2016 -Start-up Space Tauri Group 2016 -
Start-up Space Tauri Group 2016 -Dmitry Tseitlin
 
NASA_CCO_status-2013 update
NASA_CCO_status-2013 updateNASA_CCO_status-2013 update
NASA_CCO_status-2013 updateDmitry Tseitlin
 

More from Dmitry Tseitlin (20)

Ton Tlegram Open Network
Ton Tlegram Open NetworkTon Tlegram Open Network
Ton Tlegram Open Network
 
Marinet en 2017
Marinet en 2017Marinet en 2017
Marinet en 2017
 
State of innovation Thomson Reuters 2016
State of innovation Thomson Reuters 2016 State of innovation Thomson Reuters 2016
State of innovation Thomson Reuters 2016
 
Clarity from above PWC 2016
Clarity from above PWC 2016Clarity from above PWC 2016
Clarity from above PWC 2016
 
Отчет Фонд Сколково 25 апреля 2011
Отчет Фонд Сколково 25 апреля 2011Отчет Фонд Сколково 25 апреля 2011
Отчет Фонд Сколково 25 апреля 2011
 
Technology roadmap highlights_report 2015
Technology roadmap highlights_report 2015Technology roadmap highlights_report 2015
Technology roadmap highlights_report 2015
 
IGS Low cost access to space April 2016
IGS Low cost access to space April 2016IGS Low cost access to space April 2016
IGS Low cost access to space April 2016
 
Satellite technologies in UK agriculture 2015
Satellite technologies in UK agriculture 2015Satellite technologies in UK agriculture 2015
Satellite technologies in UK agriculture 2015
 
A Roadmap to Interstellar Flight Philip Lubin Physics Dept, UC Santa Barbara ...
A Roadmap to Interstellar Flight Philip Lubin Physics Dept, UC Santa Barbara ...A Roadmap to Interstellar Flight Philip Lubin Physics Dept, UC Santa Barbara ...
A Roadmap to Interstellar Flight Philip Lubin Physics Dept, UC Santa Barbara ...
 
Постановление Правительства "О реализации национальной технологической иниц...
Постановление Правительства "О реализации национальной технологической иниц...Постановление Правительства "О реализации национальной технологической иниц...
Постановление Правительства "О реализации национальной технологической иниц...
 
ESA - 2013 space transportation
ESA - 2013 space transportation ESA - 2013 space transportation
ESA - 2013 space transportation
 
Результаты РФФИ 2015
Результаты РФФИ 2015 Результаты РФФИ 2015
Результаты РФФИ 2015
 
Cоздание сверхтяжелых РН для исследования и освоения Луны и Марса - прошлое, ...
Cоздание сверхтяжелых РН для исследования и освоения Луны и Марса - прошлое, ...Cоздание сверхтяжелых РН для исследования и освоения Луны и Марса - прошлое, ...
Cоздание сверхтяжелых РН для исследования и освоения Луны и Марса - прошлое, ...
 
Ракета космического назначения «Зенит 3SL» для программы «Морской Старт» В.М...
Ракета космического назначения «Зенит 3SL» для программы «Морской Старт» В.М...Ракета космического назначения «Зенит 3SL» для программы «Морской Старт» В.М...
Ракета космического назначения «Зенит 3SL» для программы «Морской Старт» В.М...
 
Space Works Nano Microsatellite Market forecast 2016
Space Works Nano Microsatellite Market forecast 2016Space Works Nano Microsatellite Market forecast 2016
Space Works Nano Microsatellite Market forecast 2016
 
WIPO Global Innovation Index 2015
WIPO Global Innovation Index 2015WIPO Global Innovation Index 2015
WIPO Global Innovation Index 2015
 
Agritech Funder Investing report 2015
Agritech Funder Investing report 2015Agritech Funder Investing report 2015
Agritech Funder Investing report 2015
 
High technology entrepreneurs and the patent system. 2008 Berkeley
High technology entrepreneurs and the patent system. 2008 BerkeleyHigh technology entrepreneurs and the patent system. 2008 Berkeley
High technology entrepreneurs and the patent system. 2008 Berkeley
 
Start-up Space Tauri Group 2016 -
Start-up Space Tauri Group 2016 -Start-up Space Tauri Group 2016 -
Start-up Space Tauri Group 2016 -
 
NASA_CCO_status-2013 update
NASA_CCO_status-2013 updateNASA_CCO_status-2013 update
NASA_CCO_status-2013 update
 

Recently uploaded

Decarbonising Buildings: Making a net-zero built environment a reality
Decarbonising Buildings: Making a net-zero built environment a realityDecarbonising Buildings: Making a net-zero built environment a reality
Decarbonising Buildings: Making a net-zero built environment a realityIES VE
 
Connecting the Dots for Information Discovery.pdf
Connecting the Dots for Information Discovery.pdfConnecting the Dots for Information Discovery.pdf
Connecting the Dots for Information Discovery.pdfNeo4j
 
Genislab builds better products and faster go-to-market with Lean project man...
Genislab builds better products and faster go-to-market with Lean project man...Genislab builds better products and faster go-to-market with Lean project man...
Genislab builds better products and faster go-to-market with Lean project man...Farhan Tariq
 
So einfach geht modernes Roaming fuer Notes und Nomad.pdf
So einfach geht modernes Roaming fuer Notes und Nomad.pdfSo einfach geht modernes Roaming fuer Notes und Nomad.pdf
So einfach geht modernes Roaming fuer Notes und Nomad.pdfpanagenda
 
The State of Passkeys with FIDO Alliance.pptx
The State of Passkeys with FIDO Alliance.pptxThe State of Passkeys with FIDO Alliance.pptx
The State of Passkeys with FIDO Alliance.pptxLoriGlavin3
 
Enhancing User Experience - Exploring the Latest Features of Tallyman Axis Lo...
Enhancing User Experience - Exploring the Latest Features of Tallyman Axis Lo...Enhancing User Experience - Exploring the Latest Features of Tallyman Axis Lo...
Enhancing User Experience - Exploring the Latest Features of Tallyman Axis Lo...Scott Andery
 
Data governance with Unity Catalog Presentation
Data governance with Unity Catalog PresentationData governance with Unity Catalog Presentation
Data governance with Unity Catalog PresentationKnoldus Inc.
 
TeamStation AI System Report LATAM IT Salaries 2024
TeamStation AI System Report LATAM IT Salaries 2024TeamStation AI System Report LATAM IT Salaries 2024
TeamStation AI System Report LATAM IT Salaries 2024Lonnie McRorey
 
Time Series Foundation Models - current state and future directions
Time Series Foundation Models - current state and future directionsTime Series Foundation Models - current state and future directions
Time Series Foundation Models - current state and future directionsNathaniel Shimoni
 
How to Effectively Monitor SD-WAN and SASE Environments with ThousandEyes
How to Effectively Monitor SD-WAN and SASE Environments with ThousandEyesHow to Effectively Monitor SD-WAN and SASE Environments with ThousandEyes
How to Effectively Monitor SD-WAN and SASE Environments with ThousandEyesThousandEyes
 
Modern Roaming for Notes and Nomad – Cheaper Faster Better Stronger
Modern Roaming for Notes and Nomad – Cheaper Faster Better StrongerModern Roaming for Notes and Nomad – Cheaper Faster Better Stronger
Modern Roaming for Notes and Nomad – Cheaper Faster Better Strongerpanagenda
 
Rise of the Machines: Known As Drones...
Rise of the Machines: Known As Drones...Rise of the Machines: Known As Drones...
Rise of the Machines: Known As Drones...Rick Flair
 
Unleashing Real-time Insights with ClickHouse_ Navigating the Landscape in 20...
Unleashing Real-time Insights with ClickHouse_ Navigating the Landscape in 20...Unleashing Real-time Insights with ClickHouse_ Navigating the Landscape in 20...
Unleashing Real-time Insights with ClickHouse_ Navigating the Landscape in 20...Alkin Tezuysal
 
Transcript: New from BookNet Canada for 2024: Loan Stars - Tech Forum 2024
Transcript: New from BookNet Canada for 2024: Loan Stars - Tech Forum 2024Transcript: New from BookNet Canada for 2024: Loan Stars - Tech Forum 2024
Transcript: New from BookNet Canada for 2024: Loan Stars - Tech Forum 2024BookNet Canada
 
[Webinar] SpiraTest - Setting New Standards in Quality Assurance
[Webinar] SpiraTest - Setting New Standards in Quality Assurance[Webinar] SpiraTest - Setting New Standards in Quality Assurance
[Webinar] SpiraTest - Setting New Standards in Quality AssuranceInflectra
 
Sample pptx for embedding into website for demo
Sample pptx for embedding into website for demoSample pptx for embedding into website for demo
Sample pptx for embedding into website for demoHarshalMandlekar2
 
A Journey Into the Emotions of Software Developers
A Journey Into the Emotions of Software DevelopersA Journey Into the Emotions of Software Developers
A Journey Into the Emotions of Software DevelopersNicole Novielli
 
Moving Beyond Passwords: FIDO Paris Seminar.pdf
Moving Beyond Passwords: FIDO Paris Seminar.pdfMoving Beyond Passwords: FIDO Paris Seminar.pdf
Moving Beyond Passwords: FIDO Paris Seminar.pdfLoriGlavin3
 
The Ultimate Guide to Choosing WordPress Pros and Cons
The Ultimate Guide to Choosing WordPress Pros and ConsThe Ultimate Guide to Choosing WordPress Pros and Cons
The Ultimate Guide to Choosing WordPress Pros and ConsPixlogix Infotech
 
Emixa Mendix Meetup 11 April 2024 about Mendix Native development
Emixa Mendix Meetup 11 April 2024 about Mendix Native developmentEmixa Mendix Meetup 11 April 2024 about Mendix Native development
Emixa Mendix Meetup 11 April 2024 about Mendix Native developmentPim van der Noll
 

Recently uploaded (20)

Decarbonising Buildings: Making a net-zero built environment a reality
Decarbonising Buildings: Making a net-zero built environment a realityDecarbonising Buildings: Making a net-zero built environment a reality
Decarbonising Buildings: Making a net-zero built environment a reality
 
Connecting the Dots for Information Discovery.pdf
Connecting the Dots for Information Discovery.pdfConnecting the Dots for Information Discovery.pdf
Connecting the Dots for Information Discovery.pdf
 
Genislab builds better products and faster go-to-market with Lean project man...
Genislab builds better products and faster go-to-market with Lean project man...Genislab builds better products and faster go-to-market with Lean project man...
Genislab builds better products and faster go-to-market with Lean project man...
 
So einfach geht modernes Roaming fuer Notes und Nomad.pdf
So einfach geht modernes Roaming fuer Notes und Nomad.pdfSo einfach geht modernes Roaming fuer Notes und Nomad.pdf
So einfach geht modernes Roaming fuer Notes und Nomad.pdf
 
The State of Passkeys with FIDO Alliance.pptx
The State of Passkeys with FIDO Alliance.pptxThe State of Passkeys with FIDO Alliance.pptx
The State of Passkeys with FIDO Alliance.pptx
 
Enhancing User Experience - Exploring the Latest Features of Tallyman Axis Lo...
Enhancing User Experience - Exploring the Latest Features of Tallyman Axis Lo...Enhancing User Experience - Exploring the Latest Features of Tallyman Axis Lo...
Enhancing User Experience - Exploring the Latest Features of Tallyman Axis Lo...
 
Data governance with Unity Catalog Presentation
Data governance with Unity Catalog PresentationData governance with Unity Catalog Presentation
Data governance with Unity Catalog Presentation
 
TeamStation AI System Report LATAM IT Salaries 2024
TeamStation AI System Report LATAM IT Salaries 2024TeamStation AI System Report LATAM IT Salaries 2024
TeamStation AI System Report LATAM IT Salaries 2024
 
Time Series Foundation Models - current state and future directions
Time Series Foundation Models - current state and future directionsTime Series Foundation Models - current state and future directions
Time Series Foundation Models - current state and future directions
 
How to Effectively Monitor SD-WAN and SASE Environments with ThousandEyes
How to Effectively Monitor SD-WAN and SASE Environments with ThousandEyesHow to Effectively Monitor SD-WAN and SASE Environments with ThousandEyes
How to Effectively Monitor SD-WAN and SASE Environments with ThousandEyes
 
Modern Roaming for Notes and Nomad – Cheaper Faster Better Stronger
Modern Roaming for Notes and Nomad – Cheaper Faster Better StrongerModern Roaming for Notes and Nomad – Cheaper Faster Better Stronger
Modern Roaming for Notes and Nomad – Cheaper Faster Better Stronger
 
Rise of the Machines: Known As Drones...
Rise of the Machines: Known As Drones...Rise of the Machines: Known As Drones...
Rise of the Machines: Known As Drones...
 
Unleashing Real-time Insights with ClickHouse_ Navigating the Landscape in 20...
Unleashing Real-time Insights with ClickHouse_ Navigating the Landscape in 20...Unleashing Real-time Insights with ClickHouse_ Navigating the Landscape in 20...
Unleashing Real-time Insights with ClickHouse_ Navigating the Landscape in 20...
 
Transcript: New from BookNet Canada for 2024: Loan Stars - Tech Forum 2024
Transcript: New from BookNet Canada for 2024: Loan Stars - Tech Forum 2024Transcript: New from BookNet Canada for 2024: Loan Stars - Tech Forum 2024
Transcript: New from BookNet Canada for 2024: Loan Stars - Tech Forum 2024
 
[Webinar] SpiraTest - Setting New Standards in Quality Assurance
[Webinar] SpiraTest - Setting New Standards in Quality Assurance[Webinar] SpiraTest - Setting New Standards in Quality Assurance
[Webinar] SpiraTest - Setting New Standards in Quality Assurance
 
Sample pptx for embedding into website for demo
Sample pptx for embedding into website for demoSample pptx for embedding into website for demo
Sample pptx for embedding into website for demo
 
A Journey Into the Emotions of Software Developers
A Journey Into the Emotions of Software DevelopersA Journey Into the Emotions of Software Developers
A Journey Into the Emotions of Software Developers
 
Moving Beyond Passwords: FIDO Paris Seminar.pdf
Moving Beyond Passwords: FIDO Paris Seminar.pdfMoving Beyond Passwords: FIDO Paris Seminar.pdf
Moving Beyond Passwords: FIDO Paris Seminar.pdf
 
The Ultimate Guide to Choosing WordPress Pros and Cons
The Ultimate Guide to Choosing WordPress Pros and ConsThe Ultimate Guide to Choosing WordPress Pros and Cons
The Ultimate Guide to Choosing WordPress Pros and Cons
 
Emixa Mendix Meetup 11 April 2024 about Mendix Native development
Emixa Mendix Meetup 11 April 2024 about Mendix Native developmentEmixa Mendix Meetup 11 April 2024 about Mendix Native development
Emixa Mendix Meetup 11 April 2024 about Mendix Native development
 

Oil Shale Economics

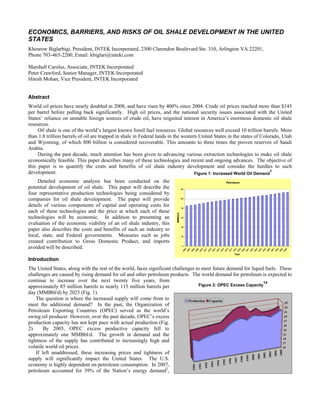
  • 1. ECONOMICS, BARRIERS, AND RISKS OF OIL SHALE DEVELOPMENT IN THE UNITED STATES Khosrow Biglarbigi, President, INTEK Incorporated, 2300 Clarendon Boulevard Ste. 310, Arlington VA 22201, Phone 703-465-2200, Email: kbiglari@inteki.com Marshall Carolus, Associate, INTEK Incorporated Peter Crawford, Senior Manager, INTEK Incorporated Hitesh Mohan, Vice President, INTEK Incorporated Abstract World oil prices have nearly doubled in 2008, and have risen by 400% since 2004. Crude oil prices reached more than $145 per barrel before pulling back significantly. High oil prices, and the national security issues associated with the United States’ reliance on unstable foreign sources of crude oil, have reignited interest in America’s enormous domestic oil shale resources. Oil shale is one of the world’s largest known fossil fuel resources. Global resources well exceed 10 trillion barrels. More than 1.8 trillion barrels of oil are trapped in shale in Federal lands in the western United States in the states of Colorado, Utah and Wyoming, of which 800 billion is considered recoverable. This amounts to three times the proven reserves of Saudi Arabia. During the past decade, much attention has been given to advancing various extraction technologies to make oil shale economically feasible. This paper describes many of these technologies and recent and ongoing advances. The objective of this paper is to quantify the costs and benefits of oil shale industry development and consider the hurdles to such development. Petroleum 120 100 80 60 40 20 0 2006 2007 2008 2009 2010 2011 2012 2013 2014 2015 2016 2017 2018 2019 2020 2021 2022 2023 2024 2025 2026 2027 2028 2029 2030 Year MMBbl/d 35 Production Capacity 1990 1991 1992 1993 1994 1995 1996 1997 1998 1999 2000 2001 2002 2003 33 31 29 27 25 23 19 17 15 2004 2005 21 ` Detailed economic analysis has been conducted on the potential development of oil shale. This paper will describe the four representative production technologies being considered by companies for oil shale development. The paper will provide details of various components of capital and operating costs for each of these technologies and the price at which each of these technologies will be economic. In addition to presenting an evaluation of the economic viability of an oil shale industry, this paper also describes the costs and benefits of such an industry to local, state, and Federal governments. Measures such as jobs created contribution to Gross Domestic Product, and imports avoided will be described. Introduction The United States, along with the rest of the world, faces significant challenges to meet future demand for liquid fuels. These challenges are caused by rising demand for oil and other petroleum products. The world demand for petroleum is expected to continue to increase over the next twenty five years, from approximately 85 million barrels to nearly 115 million barrels per day (MMBbl/d) by 2025 (Fig. 1). The question is where the increased supply will come from to meet the additional demand? In the past, the Organization of Petroleum Exporting Countries (OPEC) served as the world’s swing oil producer. However, over the past decade, OPEC’s excess production capacity has not kept pace with actual production (Fig. 2). By 2005, OPEC excess productive capacity fell to approximately one MMBbl/d. The growth in demand and the tightness of the supply has contributed to increasingly high and volatile world oil prices. If left unaddressed, these increasing prices and tightness of supply will significantly impact the United States. The U.S. economy is highly dependent on petroleum consumption. In 2007, petroleum accounted for 39% of the Nation’s energy demand2, Figure 1: Increased World Oil Demand1 Figure 2: OPEC Excess Capacity14
  • 2. Figure 3: U.S. Energy Consumption2 Oil 39% Coal 22% Natural Gas 23% Nuclear 8% Other 7% 30 25 20 15 10 5 Figure 4: Projected U.S. Supply and Consumption1 U.S. Consumption 21.14 Imports 27.65 9.65 8.58 largely to support the transportation sector (Fig. 3). The United States now faces increasing competition for world oil supplies from rapidly growing economies. This increased competition raises concern over the future reliability of liquid fuels for both military and civilian uses. In 2007, the United States consumed 21.14 MMBbl/d of petroleum and petroleum products, 12.5 MMBbl/d of which was imported. By 2030, U.S. oil consumption is forecast to grow to 27.65 MMBbl/d, of which 18 MMBbl/d will be imported (Fig. 4). The percentage of U.S. consumption met by imports will increase from 59% to 65% by 2030. The challenge facing the United States is to locate and develop domestic sources of liquid fuels that will meet demand increases and offset the growth in imports. Rising world oil prices, combined with the increased need for secure alternative liquid fuel sources have spurred considerable interest in alternative fuels resources, including renewables, alternatives, and unconventional fossil fuels (including: oil shale, tar sands, coal–to–liquids, and heavy oil), as well as enhanced oil recovery. While all of these resources can contribute to U.S. liquid fuel supply, the focus of this paper is on the massive resources and significant potential of the U.S. oil shale deposits, particularly in the Western states. Oil Shale Resources U.S. oil shale is carbonate rock, generally marlstone that is very rich in organic sedimentary material called “kerogen.” Oil shales are “younger” in geologic age than crude oil-bearing formations; natural forces of pressure and temperature have not yet converted the sediments to crude oil. Kerogen can be used to create superior quality jet fuel, #2 diesel, naphtha, and other high value by-products. The amount of kerogen in “oil shale” ore can range from 10 to 60 or more gallons per ton3 of shale. The most concentrated hydrocarbon deposits on earth are found in America’s western oil shale resources. It is estimated that the total amount of oil shale resource in the United States is over 6 trillion barrels of oil equivalent3. This resource has already been identified and extensively characterized. Table 1 displays the richness of the various oil shale deposits in the United States. Yields greater than 25 gallons per ton (gal/ton) are generally viewed as the most economically attractive, and hence, Figure 5: Principal Oil Shale Deposits in the Western United States4 Deposits Richness (Gallons/ton) Location 5 - 10 10 - 25 25 - 100 Colorado, Wyoming & Utah (Green 4,000 2,800 1,200 River) Central & Eastern States 2,000 1,000 NA Alaska Large 200 250 Total 6,000+ 4,000 2,000+ 0 1975 1980 1985 1990 1995 2000 2005 2010 2015 2020 2025 2030 65% 59% U.S. Production MMBbl/d Table 1: U.S. Oil Shale Resources in Place – Billion Bbls3
  • 3. the most favorable for initial development. Of the 6 trillion barrels of resource in place, over 2.0 trillion barrels have yields greater than 25 gal/ton3. The majority of this high-quality resource, 1.2 trillion barrels, is located in the Green River Formation. This region underlies 17,000 square miles or 11 million acres in the Piceance (CO), Uinta (UT), Green River, Washakie (WY), and Sand Wash (CO) Basins (Fig. 5). About 73 percent of the lands that contain significant oil shale deposits in the west are owned and managed by the U.S. Government. These lands contain about 80 percent of the known recoverable resource in Colorado, Utah, and Wyoming. Private company ownership of oil shale lands totaled about 21% of the Piceance Basin (Colorado), 9% of the Uinta Basin (Utah), 24% of the Green River Basin (Wyoming), and 10% of the Washakie Basin (Wyoming)3 as of 1978. Oil Shale Technology Oil shale rock must be heated to temperatures between 400 and 500 degrees centigrade (650-750 degrees fahrenheit). This heating process is necessary to convert the embedded sediments to kerogen oil and combustible gases. Over the past 60 years, energy companies and petroleum researchers have developed, tested, enhanced, and in many cases, demonstrated a variety of technologies for recovering shale oil from oil shale and processing it to produce fuels and byproducts. Both surface processing and in-situ technologies have been examined. Generally, surface processing consists of three major steps: (1) oil shale mining and ore preparation, (2) pyrolysis of oil shale to produce kerogen oil, and (3) processing kerogen oil to produce refinery feedstock and high-value chemicals. This sequence is illustrated in Figure 6-A. For deeper, thicker deposits, not as amenable to surface or deep-mining methods, the kerogen oil can be produced by in-situ technology. In-situ processes minimize, or in the case of true in-situ, eliminate the need for mining and surface pyrolysis, by heating the resource in its natural depositional setting. This sequence is illustrated in Figure 6-B4. The U.S. Department of Figure 6: Oil Shale Recovery Processes5 A - Surface Process Ore Resource Mining Retorting Oil Upgrading Premium Refinery Feed B - In-Situ Process Resource In-Situ Conversion Oil Upgrading Premium Refinery Feed Figure 7: Companies with Oil Shale Technologies5 Energy, Office of Naval Petroleum and Oil Shale Reserves (NPOSR), has recently published a comprehensive report detailing oil shale conversion technologies5. This report describes the technologies being pursued by 27 different companies in the United States. Figure 7 provides a listing of the companies currently pursuing oil shale technology in the design phase, laboratory, or pilot testing. RD&D Leasing Program In response to the President’s National Energy Policy in 2003, the Department of the Interior’s Bureau of Land Management (BLM) prepared a report6 and a plan to address access to unconventional resources (such as oil shale) on public lands. The report also included a plan for addressing impediments to oil shale development on public lands, industry interest in research and development and commercial development opportunities on public lands, and, options to capitalize on those opportunities. On November 22, 2004, the BLM published a proposed oil shale lease form and request for information in the Federal Register7 to solicit comments about the design of an oil shale program. Based on its findings and responses to the Federal
  • 4. Register notice, the BLM determined that offering Research, Development, and Demonstration (RD&D) leases prior to issuing commercial leases would facilitate economic and technology demonstration, provide an opportunity to better understand the environmental impacts, and then gauge the effectiveness of mitigation measures. The BLM RD&D lease program allows tracts of up to 160 acres to be used to test or demonstrate the economic feasibility of technologies over a lease term of 10 years, with an option for up to a 5-year extension. The payment of royalties is waived during the RD&D lease and the rental fee is waived for the first 5 years. Lessees that demonstrate successful technology may reserve an additional contiguous 4,960 acres for a preference right commercial lease. The BLM received 19 nominations in response to its June, 2005 oil shale RD&D lease announcement. On December 15, 2006, Chevron Shale Oil Company, EGL Resources, Inc., and Shell Frontier Oil & Gas were awarded leases (three to Shell). A sixth lease was later granted to Oil Shale Exploration, LLC (OSEC). The Chevron, EGL, and Shell leases are located on BLM lands in Colorado, while the OSEC lease involves Figure 8: Location of Oil Shale RD&D Leases15 parcels in Utah. Five of the projects selected involve in-situ retorting (Fig. 8). A brief description of these technologies is provided below8. ƒ Chevron Oil Shale Company, USA. Chevron’s technology for the recovery and upgrading of oil from shale (CRUSH) process is an in-situ conversion process. This process involves the application of a series of fracturing technologies which rubblize the formation, thereby increasing the surface area of the exposed kerogen (Fig. 9). This exposed kerogen in the fractured formation is then converted through a chemical process resulting in the kerogen changing from a solid material to a liquid and gas. The hydrocarbon fluids are then recovered and improved to refinery feedstock specs5. ƒ American Shale Oil, LLC (AMSO). AMSO has developed a new process for in-situ retorting of Green River oil shale. The AMSO Oil Shale Process (patent applied for) involves the use of proven oil field drilling and completion practices coupled with AMSO’s unique heating and recovery technology (Fig. 10). The AMSO approach is a closed loop in-situ retorting process with advantages of energy efficiency and manageable environmental impacts. The oil shale is heated with superheated steam or other heat transfer medium through a series of pipes placed below the oil shale bed to be Figure 9: Chevron’s CRUSH Technology5 Chevron’s Technology Schematic Figure 10: AMSO Resources Process5 retorted. Shale oil and gas are produced through wells drilled vertically from the surface and “spidered” to provide a connection between the heating wells and production system. Convection and refluxing are mechanisms that improve heat transfer to retort the oil shale. After initial start-up, the process uses the gas produced from retorting to supply all the heat required to extract the shale oil and gas from the deposit. Surface disturbance is minimized with this process by heating through lateral piping. Energy efficiency is optimized by recovery of heat from the shale rock after retorting is completed5. Figure 11: Shell’s ICP Process5
  • 5. ƒ Shell Frontier Oil & Gas Inc. Shell’s innovative In-situ Conversion Process generates more oil and gas from a smaller surface pad area than previous oil shale processes (Fig. 11). Shell’s Conversion Process does not involve surface mining. Rather, heaters are inserted underground to convert kerogen in oil shale into high quality transportation fuels. In the Shell ICP process: 5: Electric heaters gradually heat shale beneath the surface at target depths typically from 1,000 to 2,000 feet; the rock formation is heated slowly over time to 650 to 750° F, changing the kerogen in oil shale into oil and gas; products are pumped to the surface using traditional methods. The process produces approximately one third gas and two thirds light oil. Fewer processing steps are required than in surface processes to produce high quality fuels. ƒ Oil Shale Exploration Company, LLC. OSEC has tested the Alberta Taciuk Process (ATP), a horizontal rotating kiln process, for development of Utah oil shale. OSEC has arranged for Figure 12: Oil Shale Exploration’s Alberta Taciuk Process (ATP) Retort5 an exclusive right from AECOM, a worldwide engineering firm, to license the ATP Process for purposes of research, development and demonstration on the BLM lease at the White River Mine south of Vernal, Utah. The ATP Process is a unique thermal processing technology, applicable to numerous industrial uses, for vaporizing and recovering organic constituents that exist in a large range of feedstock materials (Fig. 12). Developed in 1976, the ATP Process was originally designed for treating Alberta oil sands and was later refined for use in oil shale and contaminated waste treatment options. According to OSEC, the ATP Process has been successfully used in a project in Stuart, Australia which produced more than 1.5 million barrels of shale oil. OSEC believes that the ATP Process is a proven, environmentally-sound, economic and efficient process for extracting oil from oil shale and oil sands5. OSEC has also recently entered into agreements to test Petrobras’s PetroSix vertical Gas Combustion Retort technology. In addition to the technologies being Figure 13: EcoShale’s In-Capsule Process16 tested as part of the RD&D program, an additional technology is currently being field tested. The EcoShale In-Capsule Process is an innovative new approach to oil shale processing that is being developed and tested COOL GAS by Red Leaf Resources, Inc. in the State of Utah. Red Leaf’s Eco-Shale is a hybrid HOT GAS approach that integrates surface mining with a lower-temperature, “roasting” method that occurs in an impoundment that is constructed in the void space created by the shale mining excavation (Fig. 13). When filled with shale, the capsule is heated using pipes circulating hot gases derived from burning natural gas or its own produced gases. By using an impoundment engineered with an impermeable barrier, RedLeaf expects tailings to be sequestered and ground water to be protected. To maximize energy efficiency, the process heat used in one capsule can be recovered by circulating lower temperature gases which transfer remaining heat into adjacent capsules. External energy inputs are limited to process initiation, thereafter produced gases supply most of the energy for shale heating. The EcoShale In-Capsule process’s lower-temperature, slower “roasting” approach also minimizes CO2 emissions and is amenable to carbon capture and sequestration. The unique impoundment approach allows for rapid reclamation and approximate restoration of the topography. Oil Shale Development Economics The potential for oil shale production and the resulting benefits to the national economy are discussed in the section. The results presented are not intended to be a forecast of what will occur. Rather, they represent estimates of potential under certain economic, technological, and market assumptions and constraints.
  • 6. Analytical Approach The U.S. Department of Energy (DOE) has developed a new National Oil Shale Model9. This analytical system was developed to evaluate potential U.S. oil shale development under different economic and public policy regimes. This model has the capability to perform sensitivity analyses relative to price, tax, royalty and incentives, perform cash flow analyses under alternative leasing options and evaluate costs and benefits of various public policy options to stimulate oil shale project investment. (Figure 14 ). The model consists of three parts: a detailed resource module, technology screening module, and a detailed economic module. ƒ The Resource Module contains detailed petrophysical and Figure 14: DOE’s National Oil Shale Model9,10 geological characterestics for 25 development tracts in the states of Colorado, Utah, and Wyoming. Seventy billion barrels of resource in place are collectively found in these tracts. Characteristics of these 25 tracts were studied in detail as part of the 1973 Department of Interior Prototype Oil Shale Leasing Program. Because of prior industry nomination, it is assumed that these tracts represent locations of commercial interests. These nominated tracts therefore provide a solid technical basis for the present analysis. ƒ Screening Module: Screening criteria for various technologies were developed based on the geological characteristics such as depth, dip angle, yield and thickness of the resource. The technologies considered are: 1) Surface mining with surface retorting, 2) Underground mining and surface retorting, 3) Modified In-Situ (MIS), and 4) True In-Situ (TIS) similar to Shell’s ICP process. Each of these 25 tracts was screened for each of the above technology options. Each tract was then assigned the most appropriate technology and evaluated under the specific process. Each tract was also assigned a specific development schedule based on the type of technology applied. ƒ Economic Module: The production forecasts, predicted for each tract (based on its development schedule), are used in the economic model for cash flow analysis. The economic model estimates annual and cumulative cash flow before and after taxes, capital costs, operating cost, transfer payments (royalties), revenues, and profits. The tracts that meet the economic hurdles are then carried forward and results are aggregated to national total. The economic model has average capital and operating costs based on technology and development schedule over the life of the project. The different technologies used for mining, retorting, and upgrading were considered in the components of the costs. In addition to estimating benefits at the national level, the model also estimates a number of economic benefits at state levels. The benefits to local, state, and Federal treasuries are attributed to the implementation of economically feasible projects over the next 25 years. These benefits include: 1) Direct Federal Revenues; defined as the sum of business taxes as well as one-half of royalty payments on oil shale production from Federal lands, 2) Direct State Revenues; defined as the sum of business taxes, production taxes, as well as one-half of royalty payments on oil shale production from Federal lands, and 3) Direct Public Sector Revenues; defined as the sum of the Direct Federal and Direct State Revenues. Oil shale production can benefit the nation as a whole on many levels. For example, each additional barrel of domestic production can replace a barrel of oil imports. and reduce the trade deficit by the cost of that barrel. To estimate the direct effects on the GDP (excluding the multiplier effect and potential negative impacts on other domestic export industries), the model uses the gross revenue from the potential oil shale production, inclusive of oil, natural gas, and ammonia. Similarly, the value of potential production is used to measure the impact on the trade deficit. The model also estimates potential employment associated with the oil shale projects. Labor costs (wages and fringe benefits) are calculated by isolating the labor component of all major cost elements. Labor costs are then converted into estimated annual employment using average wages (including benefits) for comparable industries as reported by the U.S. Department of Labor. Project Costs Oil shale projects, on a commercial scale, could range in size from 10,000 to 100,000 barrels per day (Bbl/d) for a surface retort to as much as 300,000 Bbl/d for full-scale in-situ projects. The capital and operating costs will vary depending on the process technology and the quality of the resource. The model estimates the operating costs to be in the range of $12 to $20 per barrel ($/Bbl) of shale oil produced. The capital costs are estimated to range from $40,000 to $55,000 per stream day barrel of daily capacity10. Mining (or drilling), retorting, and upgrading are also included in these costs. It is important to note that these costs pertain to fully operational first generation projects; They will change with time as technologies matures. Minimum Economic Price The minimum economic price is defined as the world crude oil price needed to yield a 15% rate of return (ROR) on the
  • 7. project. The 15% ROR is to cover the cost of capital and the technical and financial risk on the project. Depending on the technology used, and the quality of the resource, the minimum economic price for oil shale projects is variable. Under the assumptions utilized in this analysis, the model estimates that for a mature 100,000 Bbl/d capacity plant, the average minimum economic prices are $38/Bbl for True In-Situ, $47/Bbl for Surface Mining, $57/Bbl for Underground Mining, and $62/Bbl for Modified In-situ. While these estimates are highly sensitive to both technological and economic assumptions, discussions with industry have proven these estimates reasonable. A rationale for these estimates is provided in Reference 10. Potential Shale Oil Production The production potential of the 25 tracts (70 billion barrels of resource in place) was measured in three development scenarios. These scenarios are: 1) Business as usual scenario (BAU) -- assumes no changes to current law and that future oil prices remain in the range of high $40s to $60/Bbl as predicted by the Energy Information Administration (EIA) in its 2006 Annual Energy Outlook (Reference Price Track)1, 2) The Tax incentive scenario, assumes targeted tax incentives are available until project payback to encourage investments. Examples are price guarantees and production tax credit, and 3) The RD&D scenario assumes limited public support for R&D and field demonstration projects at commercially viable scale to reduce project risk. These scenarios were selected for sensitivity analysis purposes, and are not intended to be policy recommendations. Under the BAU scenario, shale oil production could reach 500,000 Bbl/d by 2020 and would remain steady through 2035 (Fig. 15). With targeted tax incentives, shale oil production could reach 1.5 MMBbl/d by 2035 as shown in Fig. 15. Risk reduction through RD&D could have a significant positive impact on future shale oil development in the United States. RD&D projects would work to accelerate the rate of oil shale development. With successful RD&D, it is estimated that the oil shale production could reach 2.4 MMBbl/d by 2025. It is important to note that because oil shale project development requires long lead times, no significant production is expected until 2015 under any of the three analyzed scenarios. In addition to shale oil, a significant quantity of hydrocarbon gas could also be produced. Gas production varies as a percentage of total production depending on the surface retorting or in-situ technology; however, gas production could reach as much as 3.2 billion cubic feet per day (BCF/d). Although a significant quantity of produced gas could be consumed within oil shale facilities for process heat, power generation, or other process requirements. Alternatively, much of this gas could be upgraded to pipeline quality and contribute to meeting regional and national natural gas demands (Fig. 16). Economic Benefits The potential economic benefits associated with the oil shale development activities for the three analyzed scenarios are summarized in Table 2. These estimates reflect the benefits cumulated over the next 30 years. Cumulative shale oil production could reach 12.8 billion barrels. This level of 2,500 2,000 1,500 1,000 500 Figure 15: Potential Shale Oil Production9 Figure 16: Associated Natural Gas with Shale Oil Production9 4,000 3,500 3,000 2,500 2,000 1,500 1,000 500 Item Unit Business as Usual RD&D Targeted Incentives RD&D With Targeted Tax Incentive With RD&D Production Billion Bbls 3.2 7.4 12.8 Direct Federal Billion $ 15 27 48 Revenues Direct Local/State Revenues Billion $ 10 21 37 Direct Public Sector Revenues Billion $ 25 48 85 Contribution to GDP Billion $ 310 770 1300 Value of Imports Billion $ 70 170 325 Avoided New Jobs FTE (Thousand) 60 190 300 0 2005 2010 2015 2020 2025 2030 2035 Year MMBbl/d Business as Usual 0 2005 2010 2015 2020 2025 2030 2035 Year MMiillliloionn S SCCFF/d/d Targeted Incentives Business as Usual Table 2: Example Benefits of Oil Shale Development (Cumulative Over 30 Years)9
  • 8. production could generate an additional $15 billion to $48 billion of Direct Revenues to the Federal treasury. Direct State Revenues could increase by as much as $37 billion across the analyzed scenarios. The contribution to GDP is estimated to be between $310 billion and $1.3 trillion. The value of imports avoided due to domestic production could reach $325 billion over the next 30 years. The impact on employment is also significant. It is estimated that up to 300,000 new high paying jobs could be generated in support of oil shale development. Oil Shale and the Environment Land Use and Surface Impacts The technology that will be used to mine and produce oil shale is dependent on depth, thickness, richness, and accessibility of the deposit. Deeper and thicker beds will likely be produced in-situ. A combination of approaches will likely be used in the western U.S. basins. Various land impacts are associated with each type of oil shale processing. Open-Pit (surface) mining involves significant surface disturbance and can impact surface-water runoff patterns and subsurface water quality. Experience in coal mining and other mining industries has demonstrated that impacted lands can be very effectively reclaimed with minimal long-term effect. In 1972, the Department of the Interior estimated the cumulative surface area impacted by a domestic oil shale industry, over a 40 year period, would be approximately 31 square miles per million barrels of daily shale oil production capacity. The Department of Interior has also estimated that the cumulative surface area impacted by a domestic oil shale industry, over the same 40 year period, would be approximately 21 square miles per 1.5 MMBbl/d capacity for an In-situ processes. In total, a 2.5 MMBbl/d industry would impact approximately 0.5% of the surface area overlaying the Green River Formation12. Air Quality Impact Oil shale is a carbonate rock that, when heated to 450 to 500 degrees centigrade, creates kerogen oil and hydrocarbon gases along with a slate of other gases, that may include: (1) oxides of sulfur and nitrogen, (2) carbon dioxide, (3) particulate matter, and (4) water vapor. Commercially available stack gas clean-up technologies that are currently in use in electric power generation and petroleum refining facilities have improved over the years and should be effective in controlling oxides and particulates emissions from oil shale projects. Carbon dioxide (CO2) will also be produced in large quantities and may need to be captured for use in other commercial applications (such as enhanced oil recovery or coalbed methane operations), or otherwise sequestered. Depleted oil and gas reservoirs in the region provide potentially effective sequestration targets12. Water Requirements The water required for oil shale retorting is estimated at one to three barrels of water per barrel of shale oil. Still, some processes may be net producers of water. For an oil shale industry producing 2.5 MMBbl/d, this equates to between 105 and 315 million gallons of water per day (MGD). A 2.5 MMBbl/d oil shale industry would require 0.18 million to 0.42 million acre feet of water per year, depending on location and processes used. In the West, water will be drawn from local and regional sources. The major water source is the Colorado River Basin, including the Colorado, Green, and White Rivers. The Colorado River flows between 10 and 22 million acre feet per year. Water may also be purchased from other existing reservoirs. In addition, transfers may be possible from other water basins, including the Upper Missouri. Another water source will come from western oil shale itself, which has high water content. Oil shale typically holds 2-5 gallons of water per ton, though some oil shale can contain as much as 30-40 gallons of water per ton. Much of this connate water can be recovered during processing and used to support mining, disposal, or reclamation operations. Though this produced water will contain organic and inorganic substances, the impurities can be removed with conventional water treatment technologies. Recycling and re-use of process water will help to reduce water requirements13. Produced water from other conventional and unconventional oil and gas operations may also provide a water source. Limitation of the Economic Analysis The economic analysis presented in this paper has important limitations that should be considered before using its results. These limitations include: ƒ The results pertain only to the 25 Federal tracts analyzed. These tracts collectively account for about 70 billion barrels of oil shale resource in the states of Colorado, Utah, and Wyoming. No extrapolation was attempted to include the balance of the resource in these three states. The analysis makes the assumption that these tracts are accessible for development. ƒ The analysis assumes that current technologies are successfully demonstrated to be viable at commercial scale over the next five to ten years. To the extent that this is not achieved, the development of the resource will be impeded. ƒ The analysis assumes that the environmental permitting process for the oil shale projects could be completed within three to five years. To the extent that the permitting process is not streamlined, and additional time is required, the timing of the oil shale production will be impacted.
  • 9. ƒ The analysis is based on the AEO 2006 oil price projection (Reference Price Track) over the next 25 years. To the extent that the prevailing oil prices over this period are different from the AEO projections, the estimated benefits will be different from the level shown in this paper. Moreover, the BAU case analysis assumes an average minimum rate of return of 15 percent by operators. To the extent that different operators may require differing return on their investments, the potential benefits in this analysis may be overestimated or understated. ƒ The economics are based on the use of average costing algorithms. Although developed from the best available data and explicitly adjusted for variations in energy costs, they do not reflect site-specific cost variations applicable to specific operators. To the extent that the average costs (used) understate or overstate the true project costs, the actual results will be impacted accordingly. ƒ The estimates of potential contribution to GDP, values of imports avoided, and employment do not take into account potential impacts to other sectors of the U.S. economy from altering trade patterns. It is possible that reduction in petroleum imports, depending on where the petroleum was coming from, could reduce the quantity being exported of some other good. It is likely, however, that such effects would be small. ƒ The analysis assumes that operators have access to capital to start and sustain the oil shale projects. The oil shale projects are typically characterized as “capital intensive” and have longer payback period relative to oil and gas development projects. To the extent that capital is constrained, then the potential benefit estimated in this report is overestimated. None of the above limitations, however, invalidate the results in this analysis if they are viewed for what they are intended for, which is an estimate of upside potential. Given the uncertainty of the size and combinations of the optimistic and pessimistic biases introduced by these limitations, it is assumed that the approach is valid, and the estimates are reasonable, again for what they are intended. Conclusions The U.S. oil shale resources are the most concentrated hydrocarbon deposits on earth, with over two trillion barrels of high quality resource in place. Rapidly advancing conversion technologies, high oil prices, rising world demand for liquid hydrocarbons, and the continued decline of U.S. conventional oil production, have all recently attracted significant attention to the development of the oil shale resource. Currently, twenty seven companies are actively pursuing the development of oil shale conversion technologies with significant progress. The development of this resource could have a significant positive impact on the local, state, and national economy by means of revenues, royalties, contributions to GDP, the value of avoided oil imports, and a possible production rate of about 2.4 MMBbl/d. Collaborative efforts are needed among local, state, and Federal Governments, along with the private sector to encourage the development of this very important strategic resource. Acknowledgements The authors wish to thank the DOE, Office of Naval Petroleum and Oil Shale Reserves for permission to use its data and model and other information critical to completing this manuscript. Also, the authors thank the staff of INTEK, Inc. for their immense efforts in preparing this manuscript. The staff includes Mr. Jeffrey Stone (Research Assistant), and Mr. Harry Johnson (Principal Petroleum Engineer). While acknowledging the significant contribution of these individuals, any errors of fact or inconsistencies remain the responsibility of the principal author. References 1. Energy Information Administration, Annual Energy Outlook (2008), Washington, D.C. 2. Energy Information Administration, Annual Energy Review (2008), Washington, D.C. 3. U.S. Department of Energy, Office of Petroleum Reserves – Strategic Unconventional Fuels, Fact Sheet: U.S. Oil Shale Resources (September, 2006), Washington, D.C. 4. U.S. Department of Energy, Office of Petroleum Reserves Office of Naval Petroleum and Oil Shale Reserves, Strategic Significance of America’s Oil Shale Resource: Volume 2 – Oil Shale Resources Technology and Economics (March 2004), Washington, D.C. 5. U.S. Department of Energy, Office of Petroleum Reserves, Office of Naval Petroleum and Oil Shale Reserves, Secure Fuels from Domestic Resources, The Continuing Evolution of America’s Oil Shale and Tar Sands Industries: Profiles of Companies Engaged in Domestic Oil Shale and Tar Sands Resource and Technology Development (June, 2007) 6. Chad Calvent, Deputy Assistant Secretary for Land and Minerals Management, US Department of the Interior, Testimony before the Committee on Resources, Subcommittee on Energy and Mineral Resources, U.S. House of
  • 10. Representatives, The Vase North American Resource Potential of Oil Shale, Oil Sands, and Heavy Oil – Part 2 ( June 30, 2005). 7. Department of the Interior, Bureau of Land Management, Potential for Oil Shale Leasing, Federal Register, Vol. 69, No. 224, pp. 67935 (November 22, 2004). http://a257.g.akamaitech.net/7/257/2422/06jun20041800/edocket.access.gpo.gov/2004/pdf/04-25761.pdf 8. Oil Shale and Tar Sands Leasing Programmatic EIS Information Center. http://ostseis.anl.gov/index.cfm 9. U.S. Department of Energy, Office of Petroleum Reserves, Office of Naval Petroleum and Oil Shale Reserves, National Oil Shale Model, A Decision Support System, (June 2005) 10. Biglarbigi, Khosrow, INTEK Inc., Oil Shale Development Economics, Presented at the EFI Heavy Resources Conference (May 16th, 2007), Edmonton, Canada 11. Energy Information Administration, Annual Energy Review (2005), Washington, D.C. 12. U.S. Department of Energy, Office of Petroleum Reserves, Fact Sheet: Oil Shale and the Environment (September, 2006), Washington, D.C. 13. U.S. Department of Energy, Office of Petroleum Reserves, Fact Sheet: Oil Shale Water Resources (September, 2006), Washington, D.C. 14. Energy Information Administration, International Energy Outlook (2005), Washington, D.C. 15. Biglarbigi, Khosrow, INTEK Inc., Potential Development of United States Oil Shale Resrouces, Presented at the 2007 EIA Energy Outlook Conference (March 28th, 2007), Washington, D.C. 16. Crawford, Peter, INTEK Inc., Advances in World Oil Shale Production, Presented at the 2008 Society of Petroleum Engineers Annual Technical Conference and Expo (September 22nd, 2008), Denver, Colorado.