Navigating the Deluge_ Dubai Floods and the Resilience of Dubai International...
Oil shale economics_fact_sheet usa
1. DOE Office of Petroleum Reserves – Strategic Unconventional Fuels
Fact Sheet: U.S. Oil Shale Economics
Economic Requirements for Oil Shale
Feasibility
ƒ Oil shale technologies must be demonstrated at
commercial scale before definitive capital and
operating costs of oil shale projects will be known.
ƒ Oil shale projects must demonstrate capability to
achieve a minimum rate of return at expected
sustained average world oil prices.
What are the Major Cost Elements of Oil
Shale Projects?
For Mining and Surface Retorting:
ƒ Mine development: surface or underground
ƒ Retorting & upgrading facilities: design,
manufacture, and construction of facilities
ƒ Infrastructure: roads, pipelines to upgrading plants
and refineries, powerlines, utilities, storage tanks,
waste treatment and pollution control.
For In-Situ (underground) Processing:
ƒ Subsurface facilities: wells or shafts to access and
heat the shale, recover liquids and gases, and
isolate and protect subsurface environments.
ƒ Surface facilities: production pumps and gathering
systems, process controls, process power, and
upgrading facilities.
How Big is a Commercial Scale Project?
ƒ Commercial oil shale projects could range in size
from 10,000 to 50,000 barrels per day for surface
retorts to as much as 300,000 barrels per day for
full-scale in-situ projects.
How Much Will Commercial Projects Cost?
ƒ Cost estimates will vary according to the oil shale
resource and the process selected. In the 1980s,
cost estimates for a 100,000 barrel/day surface
retort plant ranged from $8 - $12 billion (2005$)1.
Capital costs are expected to be less today, i.e.,
$3.0 to $10.0 billion (2005$).
Can Costs be Expected to Decrease Over
Time?
ƒ Yes. Capital and operating costs can be expected to
decrease over time with operating experience,
improved understanding, design enhancements, and
improved operating efficiencies, analogous to the
experience of the Province of Alberta in developing
its oil sands resources.
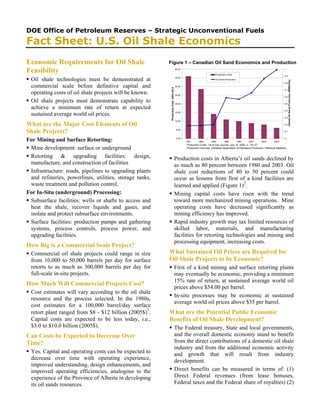
Figure 1 – Canadian Oil Sand Economics and Production
40.00
35.00
30.00
25.00
20.00
15.00
10.00
5.00
0.00
Production Costs
Oil Sands Production
1981 1984 1994 1998 1999 2001 2003 2005
Production Cost, 2004 US $
1
0.9
0.8
0.7
0.6
0.5
0.4
0.3
0.2
0.1
0
Alberta Oil Sands Production, MMBbl/Day
Production Costs: Oil & Gas Journal, July 14, 2003, V. 101.27
Production Volumes: Canadian Association of Petroleum Producers, Historical Statistics
ƒ Production costs in Alberta’s oil sands declined by
as much as 80 percent between 1980 and 2003. Oil
shale cost reductions of 40 to 50 percent could
occur as lessons from first of a kind facilities are
learned and applied (Figure 1)2.
ƒ Mining capital costs have risen with the trend
toward more mechanized mining operations. Mine
operating costs have decreased significantly as
mining efficiency has improved.
ƒ Rapid industry growth may tax limited resources of
skilled labor, materials, and manufacturing
facilities for retorting technologies and mining and
processing equipment, increasing costs.
What Sustained Oil Prices are Required for
Oil Shale Projects to be Economic?
ƒ First of a kind mining and surface retorting plants
may eventually be economic, providing a minimum
15% rate of return, at sustained average world oil
prices above $54.00 per barrel.
ƒ In-situ processes may be economic at sustained
average world oil prices above $35 per barrel.
What are the Potential Public Economic
Benefits of Oil Shale Development?
ƒ The Federal treasury, State and local governments,
and the overall domestic economy stand to benefit
from the direct contributions of a domestic oil shale
industry and from the additional economic activity
and growth that will result from industry
development.
ƒ Direct benefits can be measured in terms of: (1)
Direct Federal revenues (from lease bonuses,
Federal taxes and the Federal share of royalties) (2)
2. Direct state/local revenues (from State and local
taxes and the state share of Federal royalty); (3)
Contributions to Gross Domestic Product (GDP),
and (4) the value of avoided oil imports.
ƒ At a sustained production of about 2.5 million
barrels of shale oil per day, the cumulative value of
these benefits over a 25 year period could exceed
$500 billion.
With Oil Prices at $60/ Bbl, What are the
Impediments to Investment in Oil Shale?
ƒ Large initial capital requirements
ƒ Insufficient private tracts of high-grade oil shale
ƒ Restricted access to resources on public lands
ƒ Oil price uncertainty and volatility
ƒ Technology not demonstrated at commercially-representative
scale
ƒ Competing investment opportunities, including
investments in other conventional and
unconventional oil and gas resources
How Have Current Oil Shale Economics Been
Modeled by DOE?
ƒ DOE has performed an analysis of the economics
of oil shale. DOE developed a model to evaluate
project economics for the application of oil shale
technologies to selected resource tracts, and the
impacts of various incentives on project economics.
ƒ As there are no commercial facilities currently
operating in the United States, capital cost and
production cost data used in the analyses were
updated from past technology processes and from
current vendor cost information to construct
plausible cost scenarios.
ƒ The analysis applied resource characterization data
from surveys conducted by the U.S. Geological
Survey in preparation for the 1974 Prototype Oil
Shale Leasing Program.
ƒ The economic analysis examined 27 USGS defined
resource tracts, which were nominated by industry,
to determine the most efficient technology
approach for use at each location.
ƒ The production cost and resource characterization
data were then used to calculate minimum
economic prices.
ƒ The minimum economic price is defined as the
breakeven price assuming a return on capital of 15
percent, and represents our best cost estimates for a
mature industry.
ƒ These cost estimates do not take into account
research and development costs, permitting costs,
land access issues, or production inefficiencies that
are characteristic of first-of-a-kind plants. All of
these other factors could add significantly to early
development costs and have the potential to double
production costs for the first plants.
ƒ The model estimates cash flow for the various
projects by evaluating plant capacity, development
schedule, market prices for oil and natural gas,
leasing royalty structure, operating costs, capital
costs, and tax structure.
ƒ The model determines the minimum economic cost
shown and breakeven prices for a given technology
for each resource tracts where it is being applied.
ƒ Capital costs are the sum of investments needed per
barrel of installed capacity. These costs include
investments in mining, retorting, solid waste
disposal, refining and upgrading, plant utilities, and
other facilities.
ƒ Operating costs include fuel, operating and
maintenance personnel, consumable equipment and
other non-capital costs for mining, retorting,
refining and upgrading,
ƒ The components of both capital and operating costs
are different for various technologies used for
mining, retorting, and upgrading. These costs were
derived from information available from a variety
of sources, particularly the Prototype Leasing
Program in the early 1980’s. These costs were
escalated to 2004 dollars using Bureau of Labor
Statistics data and were further validated with
current vendor quotes.
References
1 U.S. Office of Technology Assessment. “An Assessment of Oil Shale Technologies”, 1980.
2 Oil and Gas Journal, July 13, 2003.