1. Chordify Management Consultants LLC Tel: +1 731-624-1551
www.chordify.com |Santa Clara, CA email: - info@chordify.com
Big Data Analytics & Visualization
Solutions
BizViZ Platform
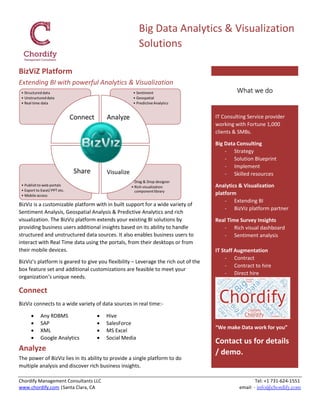
Extending BI with powerful Analytics & Visualization
BizViz is a customizable platform with in built support for a wide variety of
Sentiment Analysis, Geospatial Analysis & Predictive Analytics and rich
visualization. The BizViz platform extends your existing BI solutions by
providing business users additional insights based on its ability to handle
structured and unstructured data sources. It also enables business users to
interact with Real Time data using the portals, from their desktops or from
their mobile devices.
BizViz’s platform is geared to give you flexibility – Leverage the rich out of the
box feature set and additional customizations are feasible to meet your
organization’s unique needs.
Connect
BizViz connects to a wide variety of data sources in real time:-
Any RDBMS Hive
SAP SalesForce
XML MS Excel
Google Analytics Social Media
Analyze
The power of BizViz lies in its ability to provide a single platform to do
multiple analysis and discover rich business insights.
IT Consulting Service provider
working with Fortune 1,000
clients & SMBs.
Big Data Consulting
- Strategy
- Solution Blueprint
- Implement
- Skilled resources
Analytics & Visualization
platform
- Extending BI
- BizViz platform partner
Real Time Survey Insights
- Rich visual dashboard
- Sentiment analysis
IT Staff Augmentation
- Contract
- Contract to hire
- Direct hire
“We make Data work for you”
Contact us for details
/ demo.
What we do
2. Chordify Management Consultants LLC Tel: +1 731-624-1551
www.chordify.com |Santa Clara, CA email: - info@chordify.com
Big Data Analytics & Visualization
Solutions
Sentiment Analysis
The BizViz Natural Language Processing (NLP) library & Big Data
Algorithms processes text from various sources to extract
“Sentiments”. The Sentiment Analysis module has multiple features to:
Understand the “Sentiment” towards your brand or product.
Identify Topics as they emerge on social media.
Track trends over time & geography.
Spot Affinities.
Monitor the competition.
Listen to Social media, User Reviews, emails etc.
Geospatial
Analysis
Leverage the BizViz platform Geospatial Capabilities to analyze your
geographical data and gain insights.
Rules can be defined by users based on business requirements.
Map coordinates are obtained from CSV files or query services.
Map settings can be done including map type and zoom.
Predictive Analytics
BizViz provides a tight integration with R, the popular statistical
modelling language used for Predictive Analytics. It provides a
simple user interface for R – algorithms where user can
manipulate necessary parameters that are required to get the
results for further analysis. BizViz removes the dependencies of
users to learn R – Scripting, they just need to know the
algorithms. Some of the algorithms supported are:
Visualize & Share
BizViz allows you to create information-rich dashboards with ease,
using Drag-and-Drop functionality. The BizViz designer is a HTML5
based designer and comes pre-loaded with a wide variety of charts and
features such as Zoom-in, Zoom-out, Dynamic Visibility and Flexible
Export Options.
Understand the sentiment towards your brand
with scatter plots & other tools like Tag Clouds,
Heat Maps and Drill down capabilities.
Simple interface to “R” for modelling without
scripting. Supported analysis include:-
Time-series analysis and forecasting.
Clustering using K-means algorithm.
Regression algorithms.
Outliers Detection Algorithms.
Market basket analysis.