RapidBusinessModeling
•
1 like•450 views

This presentation looks at customer and product profitability analysis, activity-based costing and the RapidBusinessModeling solution for corporate performance improvement.

Recommended
More Related Content
What's hot
What's hot (20)
Similar to RapidBusinessModeling
Similar to RapidBusinessModeling (20)
Recently uploaded
Recently uploaded (20)
RapidBusinessModeling
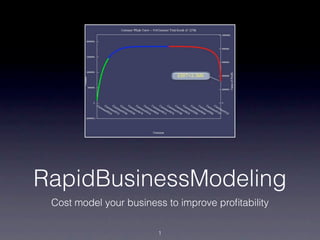
- 1. RapidBusinessModeling Cost model your business to improve profitability 1
- 2. Questions • Which customers are the most profitable? • Which customers are we losing money with? • Which products are the most/least profitable? • How much potential profits are we giving up? • How will pricing impact our profitability? 2
- 3. Challenges • Traditional accounting - Individual profitability? 3
- 4. Challenges • Traditional accounting - Individual profitability? Revenue Gross Margin Cost To Net Profit Feature $‘000 $‘000 % Serve $‘000 % Customer A 590 88 15% 115 -27 -5% Best Revenue Customer B 429 78 18% 59 19 4% Best Profit Customer C 377 93 25% 127 -34 -9% Best Margin 3
- 5. Challenges • Traditional accounting - Individual profitability? Revenue Gross Margin Cost To Net Profit Feature $‘000 $‘000 % Serve $‘000 % Customer A 590 88 15% 115 -27 -5% Best Revenue Customer B 429 78 18% 59 19 4% Best Profit Customer C 377 93 25% 127 -34 -9% Best Margin 3
- 6. Challenges • Traditional accounting - Individual profitability? Revenue Gross Margin Cost To Net Profit Feature $‘000 $‘000 % Serve $‘000 % Customer A 590 88 15% 115 -27 -5% Best Revenue Customer B 429 78 18% 59 19 4% Best Profit Customer C 377 93 25% 127 -34 -9% Best Margin 3
- 7. Challenges • Traditional accounting - Individual profitability? Revenue Gross Margin Cost To Net Profit Feature $‘000 $‘000 % Serve $‘000 % Customer A 590 88 15% 115 -27 -5% Best Revenue Customer B 429 78 18% 59 19 4% Best Profit Customer C 377 93 25% 127 -34 -9% Best Margin 3
- 8. Challenges • Traditional accounting - Individual profitability? Revenue Gross Margin Cost To Net Profit Feature $‘000 $‘000 % Serve $‘000 % Customer A 590 88 15% 115 -27 -5% Best Revenue Customer B 429 78 18% 59 19 4% Best Profit Customer C 377 93 25% 127 -34 -9% Best Margin • Key Element: Cost To Serve (CTS) 3
- 9. CTS = f ( customer ) 4
- 10. CTS = f ( customer ) • ‘Cost to Serve’ depends on customer characteristics and behavior. 4
- 11. CTS = f ( customer ) High Low Products ordered custom standard • ‘Cost to Serve’ depends on customer characteristics and Order Quantities small large behavior. Order Arrivals unpredictable predictable Packaging customized standard Delivery customized standard Delivery Location far near Del. Requirements changes no changes Pre-Sales Support high low Post-Sales Support high low Payments slow on-time 4
- 12. CTS = f ( customer ) High Low Products ordered custom standard • ‘Cost to Serve’ depends on customer characteristics and Order Quantities small large behavior. Order Arrivals unpredictable predictable Packaging customized standard • Cost to Serve can be measured Delivery customized standard through the activities consumed Delivery Location far near by the above factors. Del. Requirements changes no changes Pre-Sales Support high low Post-Sales Support high low Payments slow on-time 4
- 13. CTS = f ( customer ) High Low Products ordered custom standard • ‘Cost to Serve’ depends on customer characteristics and Order Quantities small large behavior. Order Arrivals unpredictable predictable Packaging customized standard • Cost to Serve can be measured Delivery customized standard through the activities consumed Delivery Location far near by the above factors. Del. Requirements changes no changes • Customer Profitability Analysis Pre-Sales Support high low uses ‘Activity-Based Costs’ to Post-Sales Support high low establish the Cost to Serve. Payments slow on-time 4
- 14. Traditional Costing Resources Processes Outputs (products or services) Organizational View 5
- 15. Traditional Costing consumed Outputs Resources in Processes (products or services) Organizational View 5
- 16. Traditional Costing consumed to Outputs Resources in Processes produce (products or services) Organizational View 5
- 17. Traditional Costing Accounting View Costs Cost Objects (direct or indirect) consumed to Outputs Resources in Processes produce (products or services) Organizational View 5
- 18. Traditional Costing Accounting View Costs Cost Objects (direct or indirect) calculated by consumed to Outputs Resources in Processes produce (products or services) Organizational View 5
- 19. Traditional Costing Accounting View Costs Cost Objects (direct or indirect) calculated represent by consumed to Outputs Resources in Processes produce (products or services) Organizational View 5
- 20. Traditional Costing Accounting View direct cost assigned to Costs Cost Objects (direct or indirect) calculated represent by consumed to Outputs Resources in Processes produce (products or services) Organizational View 5
- 21. Traditional Costing Accounting View direct cost assigned to indirect cost Costs Cost Objects (direct or indirect) arbitrarily assigned to calculated represent by consumed to Outputs Resources in Processes produce (products or services) Organizational View 5
- 22. Activity Based Costing Accounting View direct cost assigned to Costs Cost Objects (direct or indirect) calculated represent by consumed consumed Outputs Resources by Processes Activities by (products or services) Organizational View 6
- 23. Activity Based Costing Accounting View direct cost assigned to Costs Cost Objects (direct or indirect) calculated represent by consumed consumed Outputs Resources by Activities by (products or services) Organizational View 6
- 24. Activity Based Costing Accounting View direct cost assigned to Costs Cost Objects (direct or indirect) Activity Cost calculated represent Pools by gathered in consumed consumed Outputs Resources by Activities by (products or services) Organizational View 6
- 25. Activity Based Costing Accounting View direct cost assigned to Costs Cost Drivers Cost Objects (direct or indirect) grouped by Activity Cost calculated represent Pools by gathered in consumed consumed Outputs Resources by Activities by (products or services) Organizational View 6
- 26. Activity Based Costing Accounting View direct cost assigned to assigned assign Costs Cost Drivers Cost Objects (direct or indirect) by to grouped by Activity Cost calculated represent Pools by gathered in consumed consumed Outputs Resources by Activities by (products or services) Organizational View 6
- 27. Cumulative Profit products customers 7
- 28. Cumulative Profit products customers Sort all customer by individual profit 7
- 29. Cumulative Profit products customers Sort all customer by individual profit Cumulative profit yields ‘Whale Curve’ 7
- 30. Whale Curve Analysis profit customers / products 8
- 31. Whale Curve Analysis profit big customers / products best 20% yield 130% of result - ‘profit-makers’ 8
- 32. Whale Curve Analysis small profit big customers / products best 20% yield 130% of result - ‘profit-makers’ middle 60% yield small result - ‘break-even’ 8
- 33. Whale Curve Analysis small profit loss big customers / products best 20% yield 130% of result - ‘profit-makers’ middle 60% yield small result - ‘break-even’ worst 20% diminish result - ‘profit-takers’ 8
- 34. Potential Analysis profit customers / products 9
- 35. Potential Analysis profit customers / products best 20% yield 80% of higher result -> lift curve 9
- 36. Potential Analysis profit customers / products best 20% yield 80% of higher result -> lift curve middle 70% yield solid result -> flatten to right 9
- 37. Potential Analysis potential profit customers / products best 20% yield 80% of higher result -> lift curve middle 70% yield solid result -> flatten to right worst 10% cost only minor profit -> avoid slope 9
- 38. t 4-Box Action Plan Target Strategy Non-Target Profitable Loss-making Profit 10
- 39. t 4-Box Action Plan Target Retain Strategy Non-Target Profitable Loss-making Profit 10
- 40. t 4-Box Action Plan Target Retain Transform Strategy Non-Target Profitable Loss-making Profit 10
- 41. t 4-Box Action Plan Target Retain Transform Strategy Monitor Non-Target Profitable Loss-making Profit 10
- 42. t 4-Box Action Plan Target Retain Transform Strategy Monitor Replace Non-Target Profitable Loss-making Profit 10
- 43. t CTS Segmentation Low CTS CTS (50%) High CTS green blue red Whale Curve Regime 11
- 44. t CTS Segmentation Low CTS Retain Increase Transform CTS (50%) Monitor Reduce Replace High CTS green blue red Whale Curve Regime 11
- 45. t CTS Segmentation Low CTS Retain Increase Transform CTS (50%) Monitor Reduce Replace High CTS green blue red Whale Curve Regime 11
- 46. Approach - Summary 12
- 47. Approach - Summary • Reflect ‘cost to serve’ via activities to outputs (ABC) 12
- 48. Approach - Summary • Reflect ‘cost to serve’ via activities to outputs (ABC) • Determine customer profitability ‘whale curve’ (CPA) 12
- 49. Approach - Summary • Reflect ‘cost to serve’ via activities to outputs (ABC) • Determine customer profitability ‘whale curve’ (CPA) • Identify potential by customer segment (curve-change) 12
- 50. Approach - Summary • Reflect ‘cost to serve’ via activities to outputs (ABC) • Determine customer profitability ‘whale curve’ (CPA) • Identify potential by customer segment (curve-change) • Use RapidBusinessModeling tool to model and analyze 12
- 51. Approach - Summary • Reflect ‘cost to serve’ via activities to outputs (ABC) • Determine customer profitability ‘whale curve’ (CPA) • Identify potential by customer segment (curve-change) • Use RapidBusinessModeling tool to model and analyze • Decide actions by customer segment (4-Box, 6-Pack) 12
- 52. Example 13
- 53. Example Expenses Expenses Expenses 13
- 54. Example Expenses Expenses Expenses Products Products 13
- 55. Example Expenses Expenses Expenses Products Products Customers Customers Customers Customers 13
- 56. Example Expenses Expenses Expenses Products Products Customers Customers Customers Customers 13
- 57. Example Expenses Expenses Expenses Products Products ok Customers Customers Customers Customers 13
- 58. Example Expenses Expenses Expenses ? Products Products ok Customers Customers Customers Customers 13
- 59. 14
- 60. Expense 1 Expense 2 Expense 3 ? Product I Product II ok Customer a Customer b Customer c Customer d 14
- 61. Expense 1 Expense 2 Expense 3 Product I Product II ok Customer a Customer b Customer c Customer d 14
- 62. Expense 1 Expense 2 Expense 3 Activity A Activity B Activity C Product I Product II ok Customer a Customer b Customer c Customer d 14
- 63. Expense 1 Expense 2 Expense 3 ok Activity A Activity B Activity C Product I Product II ok Customer a Customer b Customer c Customer d 14
- 64. Expense 1 Expense 2 Expense 3 ok Activity A Activity B Activity C Product I Product II ok Customer a Customer b Customer c Customer d 14
- 65. Expense 1 Expense 2 Expense 3 ok Activity A Activity B Activity C Product I Product II ok Customer a Customer b Customer c Customer d 14
- 66. Expense 1 Expense 2 Expense 3 ok Activity A Activity B Activity C ok Product I Product II ok Customer a Customer b Customer c Customer d 14
- 67. Expense 1 Expense 2 Expense 3 Cost ok Activity A Activity B Activity C ok Product I Product II ok Customer a Customer b Customer c Customer d 15
- 68. Expense 1 Expense 2 Expense 3 Cost ok Activity A Activity B Activity C ok Revenue Product I Product II ok Customer a Customer b Customer c Customer d 15
- 69. Expense 1 Expense 2 Expense 3 Cost ok Activity A Activity B Activity C Profit ok Revenue Product I Product II ok Customer a Customer b Customer c Customer d 15
- 70. Expense 1 Expense 2 Expense 3 ok Activity A Activity B Activity C ok Product I Product II ok Customer a Customer b Customer c Customer d 16
- 71. Expense 1 Expense 2 Expense 3 ok Activity A Activity B Activity C ok Product I Product II ok Customer a Customer b Customer c Customer d 16
- 72. Expense 1 Expense 2 Expense 3 ok Activity A Activity B Activity C ok Product I Product II ok Customer a Customer b Customer c Customer d 16
- 73. Expense 1 Expense 2 Expense 3 ok Activity A Activity B Activity C ok Product I Product II ok Customer a Customer b Customer c Customer d 16
- 74. Expense 1 Expense 2 Expense 3 ok Activity A Activity B Activity C ok Product I Product II ok Customer a Customer b Customer c Customer d 16
- 75. Expense 1 Expense 2 Expense 3 ok Activity A Activity B Activity C ok Product I Product II ok Customer a Customer b Customer c Customer d 16
- 76. Expense 1 Expense 2 Expense 3 ok Activity A Activity B Activity C ok Product I Product II ok Customer a Customer b Customer c Customer d 16
- 77. Expense 1 Expense 2 Expense 3 Cost ok Activity A Activity B Activity C Profit ok Revenue Product I Product II ok Customer a Customer b Customer c Customer d 17
- 78. Expense 1 Expense 2 Expense 3 Cost Cost ok Activity A Activity B Activity C Profit ok Revenue Product I Product II ok Customer a Customer b Customer c Customer d 17
- 79. Expense 1 Expense 2 Expense 3 Cost Cost ok Activity A Activity B Activity C Profit ok Revenue Product I Product II ok Customer a Customer b Customer c Customer d 17
- 80. Expense 1 Expense 2 Expense 3 Cost Cost ok Activity A Activity B Activity C Profit ok Revenue Product I Product II ok Customer a Customer b Customer c Customer d 17
- 81. Cost Profit Revenue 18
- 82. Cost Profit Revenue 18
- 83. Cost Profit Revenue 18
- 84. Cost Profit Revenue 18
- 85. Cost Profit Revenue 18
- 86. Cost Profit Revenue 18
- 87. Typical Engagement • Overview of Approach • Gathering of Data • Creation of Model • Running the Numbers • Visual Analysis of Results 19
- 88. RapidBusinessModeling – Improving Profitability Hans-Gerlach Woudboer Owner and Founder of RapidBusinessModeling 10 years experience as profitability consultant 27 years ExxonMobil Master degree Aachen University of Technology Dr. Thomas Laussermair President of Visualign Consulting 20 years experience in software engineering, business analysis Siemens, Microsoft, Citrix Systems Ph.D. Technical University Munich RapidBusinessModeling.de Visualign.net Hans-Gerlach Woudboer Thomas Laussermair +49 160 530 1809 20 +1 954 802 7577 1
Editor's Notes
- From my slides:\nDo You Know Your Customers True Profitability?\nDoes your company have any unprofitable customers?\nHow much money do you leave on the table with your customers?\nWhat profit does each of your customer add or destroy to your companies profit?\nHow much profit do you make or lose with activities and services performed for your customers?\nWe can help you to answer all of those questions\nConservatively we improve your bottom-line by 3- 6% of revenue\n \nwe can simulate your business allowing you to make your decisions based on facts and not guesses. For strategic for tactical but most importantly for the day to day operational decisions. Your people will decide like you were always in their ear!\nshow you how to start harvesting rapidly on making your day to day order transaction always profitable. Many small changes which accumulate to a huge mountain of success.\n \nA first glance approach for $2k\n    Based on your data available or of the top\n    early assessment of Potentials of CustomerProfitabilityImprovement\n    Report on where to focus on\n \nA more in depth approach for $10k\n    Based on your data available\nand interviews\n    more detailed Potentials of CustomerProfitabilityImprovement\n    detailed Report on where to focus ...\n \nUltimate Customer Profitability Improvement Solution\nfor good to repeat by your organisation semi -automatically\n \n
- \n
- \n
- \n
- \n
- \n
- \n
- \n
- \n
- \n
- \n
- \n
- \n
- \n
- \n
- \n
- \n
- \n
- \n
- \n
- \n
- \n
- \n
- ABC’s basic premises: Cost objects consume activities, which consume resources, which drives costs.\n\nABC intends to calculate “real cost” of cost objects (activities, processes, products, services).\n\nCost drivers are used to group costs into activity cost pools.\n\nABC Pro’s:\n+ offers a way to analyze cost and identify activities which add value\n+ can improve organization performance by increasing cost visibility\n+ can be used as a management tool for better allocation of resources\n+ offers a competitive cost advantage\n\nABC Con’s:\n- implementation is expensive and difficult (without proper tools and solutions)\n\n
- ABC’s basic premises: Cost objects consume activities, which consume resources, which drives costs.\n\nABC intends to calculate “real cost” of cost objects (activities, processes, products, services).\n\nCost drivers are used to group costs into activity cost pools.\n\nABC Pro’s:\n+ offers a way to analyze cost and identify activities which add value\n+ can improve organization performance by increasing cost visibility\n+ can be used as a management tool for better allocation of resources\n+ offers a competitive cost advantage\n\nABC Con’s:\n- implementation is expensive and difficult (without proper tools and solutions)\n\n
- ABC’s basic premises: Cost objects consume activities, which consume resources, which drives costs.\n\nABC intends to calculate “real cost” of cost objects (activities, processes, products, services).\n\nCost drivers are used to group costs into activity cost pools.\n\nABC Pro’s:\n+ offers a way to analyze cost and identify activities which add value\n+ can improve organization performance by increasing cost visibility\n+ can be used as a management tool for better allocation of resources\n+ offers a competitive cost advantage\n\nABC Con’s:\n- implementation is expensive and difficult (without proper tools and solutions)\n\n
- ABC’s basic premises: Cost objects consume activities, which consume resources, which drives costs.\n\nABC intends to calculate “real cost” of cost objects (activities, processes, products, services).\n\nCost drivers are used to group costs into activity cost pools.\n\nABC Pro’s:\n+ offers a way to analyze cost and identify activities which add value\n+ can improve organization performance by increasing cost visibility\n+ can be used as a management tool for better allocation of resources\n+ offers a competitive cost advantage\n\nABC Con’s:\n- implementation is expensive and difficult (without proper tools and solutions)\n\n
- ABC’s basic premises: Cost objects consume activities, which consume resources, which drives costs.\n\nABC intends to calculate “real cost” of cost objects (activities, processes, products, services).\n\nCost drivers are used to group costs into activity cost pools.\n\nABC Pro’s:\n+ offers a way to analyze cost and identify activities which add value\n+ can improve organization performance by increasing cost visibility\n+ can be used as a management tool for better allocation of resources\n+ offers a competitive cost advantage\n\nABC Con’s:\n- implementation is expensive and difficult (without proper tools and solutions)\n\n
- ABC’s basic premises: Cost objects consume activities, which consume resources, which drives costs.\n\nABC intends to calculate “real cost” of cost objects (activities, processes, products, services).\n\nCost drivers are used to group costs into activity cost pools.\n\nABC Pro’s:\n+ offers a way to analyze cost and identify activities which add value\n+ can improve organization performance by increasing cost visibility\n+ can be used as a management tool for better allocation of resources\n+ offers a competitive cost advantage\n\nABC Con’s:\n- implementation is expensive and difficult (without proper tools and solutions)\n\n
- ABC’s basic premises: Cost objects consume activities, which consume resources, which drives costs.\n\nABC intends to calculate “real cost” of cost objects (activities, processes, products, services).\n\nCost drivers are used to group costs into activity cost pools.\n\nABC Pro’s:\n+ offers a way to analyze cost and identify activities which add value\n+ can improve organization performance by increasing cost visibility\n+ can be used as a management tool for better allocation of resources\n+ offers a competitive cost advantage\n\nABC Con’s:\n- implementation is expensive and difficult (without proper tools and solutions)\n\n
- \n
- \n
- \n
- \n
- \n
- \n
- \n
- \n
- \n
- \n
- \n
- \n
- \n
- \n
- \n
- \n
- \n
- \n
- \n
- \n
- \n
- \n
- \n
- \n
- \n
- \n
- \n
- \n
- \n
- \n
- \n
- \n
- \n
- \n
- \n
- \n
- \n
- \n
- \n
- \n
- \n
- \n
- \n
- \n
- \n
- \n
- \n
- \n
- \n
- \n
- \n
- \n
- \n
- \n
- \n
- \n
- \n
- \n
- \n
- \n
- \n
- \n
- \n
- \n
- \n
- \n
- \n
- \n
- \n
- \n
- \n
- \n
- \n
- \n
- \n
- \n
- \n
- \n
- \n
- \n
- \n
- \n
- \n
- \n
- \n
- \n
- \n
- \n
- \n
- \n
- \n
- \n
- \n
- \n
- \n
- \n
- \n
- \n
- \n
- \n
- \n