Indonesia internet users 2012 - marketeers nov 2012 cover story - waizly
•Download as PPTX, PDF•
13 likes•13,912 views

Indonesia internet users survey 2012 by MarkPlus Insight. Featured as a cover story for Marketeers Magazine November 2012.

Recommended
Recommended
More Related Content
What's hot
What's hot (20)
Similar to Indonesia internet users 2012 - marketeers nov 2012 cover story - waizly
Similar to Indonesia internet users 2012 - marketeers nov 2012 cover story - waizly (20)
Recently uploaded
Recently uploaded (20)
Indonesia internet users 2012 - marketeers nov 2012 cover story - waizly
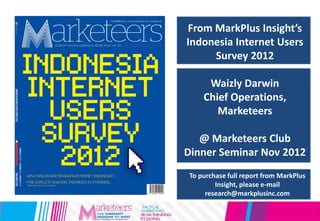
- 1. From MarkPlus Insight’s Indonesia Internet Users Survey 2012 Waizly Darwin Chief Operations, Marketeers @ Marketeers Club Dinner Seminar Nov 2012 To purchase full report from MarkPlus Insight, please e-mail research@markplusinc.com
- 2. Research Methodology Quantitative Research – Respondent’s criteria • SEC A/B/C • Age 15 – 64 years old • Internet and/ or mobile internet users • Use internet for at least 3 hours a day – Sampling method The samples were selected using multi stage random sampling and kish grid – Samples distribution Cities Σ samples Cities Σ samples Jakarta 303 Palembang 150 Bodetabek 197 Pekanbaru 152 Bandung 200 Denpasar 150 Semarang 150 Banjarmasin 150 Surabaya 299 Makassar 150 Medan 250 TOTAL 2151
- 3. November 2010 MarkPlus Insight Study on Netizen’s Anxieties & Desires November 2011 MarkPlus Insight Study on Netizen’s Urban Lifestyle
- 4. 42.2 55.0 61.1 9.6 13.8 24.2 2010 2011 2012 Internet User Accessing internet more than 3 hours per day In million Urban Population 121.16 123.24 123.57 Urban Family 30.29 30.81 31.61 Urban Netizen Population 37.56 50.53 56.38 Netizen Population 42.16 55.23 61.08 Total Internet User Penetration 17% 22.4% 23.5% MarkPlus Insight Netizen Survey 2012: Indonesia Internet Users Penetration 2010-2012 Source: MarkPlus Insight Netizen Survey 2012, 2150 respondents, in 10 cities, SES ABC Internet users: Internet and/or mobile users 61 Million Internet Users in Indonesia 2012
- 5. 40.8 29.0 12.5 10.9 5.9 0.9 42.4 26.3 12.6 11.7 4.8 2.3 15 - 22 years old 22 - 30 years old 31 - 35 years old 36 - 45 years old 46 - 55 years old 56 - 64 years old 2011 2012 Age Base: All respondents (n=2151) 61 Million Internet Users in Indonesia 2012
- 6. 84.7 37.9 17.8 17.6 11.1 5.3 2.3 0.3 SmartphonePersonal notebookOffice's PC Internet Café Home PC Personal Netbook Tablet PC Smart TV Source: MarkPlus Insight Netizen Survey 2012, 2150 respondents, in 10 cities, SES ABC 61 Million Internet Users in Indonesia 2012: Higher mobility in accessing the Internet 6 41 28 26 23 19 16 13 33 34 38 26 30 18 29 16 22 19 22 22 28 29 4 9 8 11 19 21 16 6 4 6 11 10 11 8 0 1 1 2 1 3 2 2 Tablet PC Office's PC Internet cafe's PC Home PC Personal netbook Smartphone Personal notebook 1 hour 2 hours 3 hours 4 hours 5 hours 6 hours > 6 hours
- 7. MarkPlus Insight Netizen Survey 2012: Pos pengeluaran rutin para pengguna Internet 98.5 98.1 96.9 92.6 68.0 56.2 18.9 18.0 7.8 6.2 6.2 Komunikasi telepon dan sms Internet Makan dan minum sehari-hari Transportasi Perawatan tubuh Perawatan kecantikan Kesehatan Rokok Tempat tinggal Pendidikan, kursus Cicilan motor Source: MarkPlus Insight Netizen Survey 2012, 2150 respondents, in 10 cities, SES ABC 61 Million Internet Users in Indonesia 2012: Makan Nggak Makan Asal Connect
- 8. 94.0 64.5 60.2 56.9 39.1 26.2 18.3 6.1 8.3 1.9 Jejaring sosial Mencari info/searching/ browsing Membuka Email Mencari Berita terkini (Berita online) Download/Upload Video Online Chat… Game online Blogging Video Call (YM, FB, Skype, dsb) File Sharing Top 10 aktivitas yang dilakukan Netizen Indonesia Source: MarkPlus Insight Netizen Survey 2012, 2150 respondents, in 10 cities, SES ABC 61 Million Internet Users in Indonesia 2012: Why they connect? Increasingly for Social Activities
- 9. 604,800.00 2,691,000.00 3,726,800.00 2010 2011 2012 344.7 38.5 Buy via internet? Base: Indonesia Population 9 61 Million Internet Users in Indonesia 2012: Social Shopper Netizen
- 10. Things buy via internet without planning Base: : All ever bought a product/service through internet 13.0 9.8 1.6 7.3 3.3 1.6 2.4 2.4 1.6 0.8 39.9 9.1 12.5 5.3 1.9 1.9 0.5 0.5 0.5 1.0 Clothes Shoes Bag Hand watch Glasses Cosmetic Handphone Handphone accessories Vehicle accessories DVD Male Female 10 61 Million Internet Users in Indonesia 2012: Social Commerce: What they buy
- 11. 40.4 24.6 32.7 15.8 12.3 9.9 9.4 8.2 3.5 38.9 35.6 28.0 25.2 15.2 15.2 7.0 4.6 4.3 Price Offered Discount Offered Famous brand/branded Attractive Ads Reccomendation Variety of product offered Available payment method Seller Reputation Cost of delivery Male Female Impulsive reasons in online shopping Base: : All ever bought a product/service through internet 61 Million Internet Users in Indonesia 2012: Why they buy online?
- 12. 34.4 28.6 13.0 3.2 4.5 0.0 0.0 0.6 0.6 36.2 17.7 2.5 7.0 2.5 1.2 0.8 0.4 0.4 Facebook Toko bagus Kaskus BBM Berniaga Bursa Tanah Abang Baju Grosir Oriflame Shop Twitter Male Female Most Often Used Online Point of Purchase Base: : All ever bought a product/service through internet 12 61 Million Internet Users in Indonesia 2012: Social Commerce: Where they sell/buy
- 13. 1,480,000 2,553,000 4,421,500 2010 2011 2012 Internet banking ownership 72.5 73.2 Internet banking user Base: Indonesia Population 13 61 Million Internet Users in Indonesia 2012: Netizen and Internet Banking
- 14. 39.0 37.5 21.5 16.0 Write the product review Write reccomedation about product/service offered Write reccomendation about the seller of products/service None Action Taken After Purchased Online Base: All ever bought a product/service through internet 14 61 Million Internet Users in Indonesia 2012: Social Commerce: What they do after purchase
- 15. MarkPlus Insight Netizen Survey 2012: Indonesia Netizen based on their Spending Behavior SMART PLANNED-SMART 56.4% “Bargain Hunter” IMPULSIVE-SMART 16.7% “Emotional Saver” SIMPLE PLANNED-SIMPLE 9.6% “Lazy Shopper” IMPULSIVE-SIMPLE 17.3% “Retail Victim” PLANNED IMPULSIVE Buying Efforts Buying Decision Source: MarkPlus Insight Netizen Survey 2012, 2150 respondents, in 10 cities, SES ABC
- 16. For more information: Waizly.darwin@the-marketeers.com Follow us on Twitter: @the_marketeers @waizly