unwanted pregnancy Kit [+918133066128] Abortion Pills IN Dubai UAE Abudhabi
Estimating payout from pump efficiency gains
1. Boulden International LLC
1013 Conshohocken Road
Conshohocken, PA 19428
USA
+1 610 825 1515 (phone)
+1 610 825 5544 (fax)
Boulden International S.ar.L
27, Z.A.E. Le Triangle Vert
L-5691 Ellange
Luxembourg
+352 26 39 33 99 (phone)
+352 24 61 16 62 (fax)
1
Estimating the efficiency payout from Vespel® CR-6100 wear rings
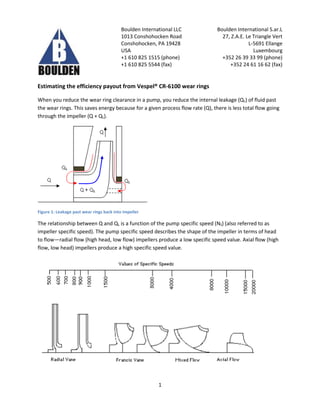
When you reduce the wear ring clearance in a pump, you reduce the internal leakage (QL) of fluid past
the wear rings. This saves energy because for a given process flow rate (Q), there is less total flow going
through the impeller (Q + QL).
Figure 1: Leakage past wear rings back into impeller
The relationship between Q and QL is a function of the pump specific speed (NS) (also referred to as
impeller specific speed). The pump specific speed describes the shape of the impeller in terms of head
to flow—radial flow (high head, low flow) impellers produce a low specific speed value. Axial flow (high
flow, low head) impellers produce a high specific speed value.
2. Boulden International LLC
1013 Conshohocken Road
Conshohocken, PA 19428
USA
+1 610 825 1515 (phone)
+1 610 825 5544 (fax)
Boulden International S.ar.L
27, Z.A.E. Le Triangle Vert
L-5691 Ellange
Luxembourg
+352 26 39 33 99 (phone)
+352 24 61 16 62 (fax)
2
The calculation is:
RPM: Rotations per minute
GPM: U.S. Gallons per minute (total flow through impeller for either single or double-suction
pump at BEP)
TDH: Total Differential Head (in feet at BEP)
Looking at published data, reduced wear ring clearance produces significant energy savings for the
majority of your process pumps. If we use data published by Bloch in 1985 showing the energy loss from
increased clearance, we can create a curve estimating the efficiency gain from a 50% reduction in wear
ring clearance (shown in Figure 2 as “Bloch Efficiency Gain”). Over the years there have been field
studies and tests on pump test stands using various composite materials. Plotting these values on the
“Bloch” curve, we find they match reasonably well.
Figure 2: Published data on efficiency gains from reduced wear ring clearance
0.0%
1.0%
2.0%
3.0%
4.0%
5.0%
6.0%
7.0%
8.0%
0 500 1000 1500 2000 2500 3000
EfficiencyGain
Pump Specific Speed
Efficiency Gain with 50% Reduction in Wear Ring
Clearance
Bloch Efficiency Gain
Test Stand #1
Field Trial #1
Field Trial #2
Test Stand #2
Test Stand #3
3. Boulden International LLC
1013 Conshohocken Road
Conshohocken, PA 19428
USA
+1 610 825 1515 (phone)
+1 610 825 5544 (fax)
Boulden International S.ar.L
27, Z.A.E. Le Triangle Vert
L-5691 Ellange
Luxembourg
+352 26 39 33 99 (phone)
+352 24 61 16 62 (fax)
3
Of greater importance is the total energy saved and the payout period associated with the upgrade.
What the above chart does not tell you is that pump power tends to increase with specific speed—i.e.
larger, high energy pumps, tend to have higher specific speed values.
Estimating Payout Period
Our estimate for payout period was created with the following methodology.
1. Calculate the size of a single-stage impeller which would require a 100 HP driver for pump
specific speeds from 500 to 4000 in increments of 500.
2. Repeat the calculation for 500 HP and 1000 HP drivers, increasing the number of stages when
logical (i.e. you won’t see a 36” diameter impeller with 10” wear rings on a 500 HP single-stage
radial flow pump. Rather, you’ll see 5 stages of 14” impellers with 6” wear rings.)
Assumed an average specific gravity of 0.7 (the payout will be a bit shorter for heavier fluids,
a bit longer for lighter fluids)
Assumed 50% operation (100% spare capacity, continuous service)
Assumed operating speeds of 3000 rpm. Operating speeds of 3600 rpm and higher will offer
shorter payout periods because the wear rings will typically be smaller for the same energy
consumption (conversely, when pumps run at 1500/1800 rpm or slower, the wear rings
become much larger and the payout from efficiency gains is much less attractive.)
3. Using the specific speed, calculate the size of the wear rings for a given impeller diameter.
4. Use the diameter and number of components to estimate the cost of the upgrade
5. Subtract the estimated cost of the metal parts which will be replaced by the Vespel® CR-6100,
assuming they are 400-series heat-treated stainless.
6. Plot the cost vs. savings in terms of payout period (months) as a function of local power costs.
The results are shown in the following tables showing 1-year payouts in green, 2 year payouts in yellow,
and 3 year payouts in blue:
100 HP Drivers: Payout in Months
Cost of Power
Specific Speed $0.04 $0.06 $0.08 $0.10 $0.12 $0.14 $0.16 $0.18
500 7 5 3 3 2 2 2 2
1000 13 9 6 5 4 4 3 3
1500 25 17 13 10 8 7 6 6
2000 34 23 17 14 11 10 9 8
2500 83 55 42 33 28 24 21 18
3000 98 66 49 39 33 28 25 22
3500 122 81 61 49 41 35 30 27
4000 171 114 85 68 57 49 43 38
4. Boulden International LLC
1013 Conshohocken Road
Conshohocken, PA 19428
USA
+1 610 825 1515 (phone)
+1 610 825 5544 (fax)
Boulden International S.ar.L
27, Z.A.E. Le Triangle Vert
L-5691 Ellange
Luxembourg
+352 26 39 33 99 (phone)
+352 24 61 16 62 (fax)
4
500 HP Drivers: Payout in Months
Cost of Power
Specific Speed $0.04 $0.06 $0.08 $0.10 $0.12 $0.14 $0.16 $0.18
500 7 5 3 3 2 2 2 2
1000 13 9 6 5 4 4 3 3
1500 24 16 12 10 8 7 6 5
2000 33 22 17 13 11 9 8 7
2500 53 35 26 21 18 15 13 12
3000 53 35 26 21 18 15 13 12
3500 53 35 26 21 18 15 13 12
4000 74 49 37 29 25 21 18 16
1000 HP Drivers: Payout in Months
Cost of Power
Specific Speed $0.04 $0.06 $0.08 $0.10 $0.12 $0.14 $0.16 $0.18
500 7 5 3 3 2 2 2 2
1000 13 9 6 5 4 4 3 3
1500 16 11 8 6 5 5 4 4
2000 23 15 12 9 8 7 6 5
2500 38 25 19 15 13 11 10 8
3000 41 28 21 17 14 11 10 9
3500 48 32 24 19 16 11 10 9
4000 48 32 24 19 16 11 10 9
Assuming you pay at least $0.08/kw-hr, your pumps with specific speeds below 2000 will offer an
extremely attractive payout on power savings alone. When the pumps arrive at 1000 HP, all of the
pumps up to a specific speed of 4000 deliver an attractive payout. After 1000 HP, the numbers no longer
change significantly, although I suspect you will achieve good payout in pumps with even higher specific
speeds.
Below is a table I put together for another client showing the payout for 3 different published case
studies of efficiency gains assuming the cost of upgrading the pumps with Vespel® CR-6100. One of the
things that makes the investment attractive is that the savings accumulate over the years. We have data
from a refined products pipeline in the U.S. which shows they are still running at significantly higher
efficiency after 6-7 years of using Vespel® CR-6100 (in other words, the material does not wear out very
much over time and you maintain the tight clearances for years of energy savings). The 5-year
cumulative savings below far outweigh the initial investment.
Study: Test Stand Data Field Trial #1 Field Trial #2