Coronavirus - Spread Vs Recovery Rate
•
0 likes•149 views

Coronavirus - Spread Vs Recovery Rate using weibull analysis and median rank approach

Recommended
Recommended
More Related Content
Similar to Coronavirus - Spread Vs Recovery Rate
Similar to Coronavirus - Spread Vs Recovery Rate (20)
More from Mohammed Awad
More from Mohammed Awad (20)
Recently uploaded
Recently uploaded (20)
Coronavirus - Spread Vs Recovery Rate
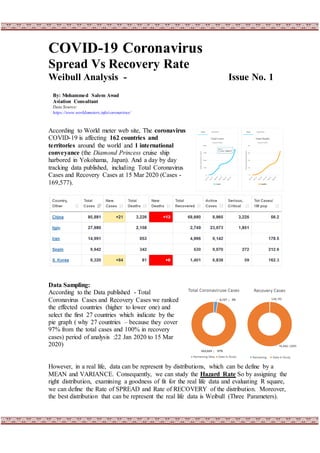
- 1. COVID-19 Coronavirus Spread Vs Recovery Rate Weibull Analysis - Issue No. 1 According to World meter web site, The coronavirus COVID-19 is affecting 162 countries and territories around the world and 1 international conveyance (the Diamond Princess cruise ship harbored in Yokohama, Japan). And a day by day tracking data published, including Total Coronavirus Cases and Recovery Cases at 15 Mar 2020 (Cases - 169,577). Data Sampling: According to the Data published - Total Coronavirus Cases and Recovery Cases we ranked the effected countries (higher to lower one) and select the first 27 countries which indicate by the pie graph ( why 27 countries – because they cover 97% from the total cases and 100% in recovery cases) period of analysis :22 Jan 2020 to 15 Mar 2020) However, in a real life, data can be represent by distributions, which can be define by a MEAN and VARIANCE. Consequently, we can study the Hazard Rate So by assigning the right distribution, examining a goodness of fit for the real life data and evaluating R square, we can define the Rate of SPREAD and Rate of RECOVERY of the distribution. Moreover, the best distribution that can be represent the real life data is Weibull (Three Parameters). By: Mohammed Salem Awad Aviation Consultant Data Source: https://www.worldometers.info/coronavirus/
- 2. 22 Weibull Distribution: Weibull Distribution define by three parameters, i.e shape, scale and location (x;,,). Weibull become Exponential when shape parameter equal one, thus we can define the hazard function and we will use two analysis First: Total Coronavirus Cases. Second: Total Recovery Cases. Analysis: We used median rank approach to define the Weibull parameters, which are used to find the Hazard rate. Parameters Evaluation: As shown in the figure, we take twice (ln) for cumulative distribution function, this lead to straight-line form. Where () shape parameter is slope of line, is a scale parameter and is a location parameter. The Hazard Function = 𝒉( 𝒙; ,,) = ( 𝒙− ) −𝟏 a) Total Coronavirus Cases = 2039.67 = 0.4712 = 225 At R- square = 97.5 % b) Recovery Cases = 161.03 = 0.4068 = 9 At R- square = 81.7 %
- 3. 33 Results: By using the above parameters, we can develop a Total Coronavirus and Recovery cases Rates. Obviously, the rate of Recovery is higher than rate of Total Coronavirus i.e mean a positive sign that Coronavirus will diminish soon. But the parameters of Weibull analysis – shape parameter both are less than one – this tend that we are in the first stage of bathtub curve. And its needs time to reach stable state. i. e ( = 1). Conclusions: In these hard time, world needs, some tools to monitor the overall impacts and behaviors coronavirus data. One of perfect tool, is Weibull, it will trace /monitor the impacts of this virus and predicts its rate of spread compare to treatment that done by world in terms of recovery cases. At this time the study shows, the gap between spread and recovery rate is still small. Therefore, we have to repeat this analysis by updating the data, and it is good for spread rate to go lower and lower, while we have to work hard to increase the rate of recovery.
- 4. 44 Appendix: Case: Total Coronavirus Cases Analysis to find SHAPE and SCALE parameters for top 27 countries