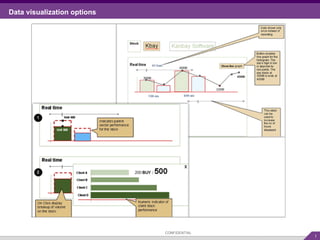
4. Macro Level screen options – Screen CONFIDENTIAL Kbay Kanbay Software Stock Client Section for display for real time view of data Section for display for Historic view of data Removed branding to allow maximum use of screen space
5. Use case 1: Entry Point CONFIDENTIAL Stock Client Kbay Kanbay Software Will provide auto-suggest so that users will be able to complete the task faster Will provide the complete name below Can have a submit button or on enter User Option - View by Stock Submit
6. Use case 1(a): By Stock - Real time - Open/ Execute CONFIDENTIAL Open Executed Buy Sell 23,000 20,000 2,000 3,000 Tabular format for displaying Open/ executed stock Visual format for displaying Total flow of stock – option 1 Open -Buy volume Executed -Buy volume Open -Sell volume Executed -Sell volume Buy 23,000 Sell 20,000 3,000 2,000 Changed to keep buy-sell together Hue differentiation to show open -executed volume Total volume – open = 43 k Total volume – executed = 10 k
7. Use case 1(a): By Stock - Real time - Open/ Execute CONFIDENTIAL Open Executed Buy Sell 23,000 20,000 7,000 3,000 Tabular format for displaying Open/ executed stock Visual format for displaying Total flow of stock- option 2 Buy volume-Open Buy volume-Executed Sell volume-Open Sell volume-Executed Buy 23,000 Sell 20,000 3,000 7,000 Hue differentiation to show open -executed volume Buy sell kept side by side for easier comparison Total volume – open = 43 k Total volume – executed = 10 k
8. Use case 1(a): By Stock - Real time – Sector Comparison CONFIDENTIAL Stock Performance Sector Performance Buy Sell 23,000 20,000 50,000 40,000 Tabular format for displaying Sector Comparison Visual format for displaying Sector Comparison Parent Sector Volume Buy volume Sell volume Financial Morgan Buy-sell volumes kept together & comparison with total sector volume shown. Total sector volume is dotted bar graph Buy 23,000 Sell 20,000 90,000 Total volume – Morgan= 43 k
9. Use case 1(a): By Stock - Real time – Client Activity for a stock CONFIDENTIAL Buy Sell Client A Client B 250 200 Tabular format for displaying Client Activity Total Holding Visual format for displaying Client Activity Client C Client B Client A 100 200 300 400 500 Buy Sell 100 500 300 200 250 400 Should the stock holdings currently held by the client appear here on rollover Data grid for my clients activity for a particular stock Buttons to change view stack from data grid to graph & vice versa, 400 1000 300 2000
10. Use case 1(b): By Stock - Historic – Total Volume CONFIDENTIAL Visual format for Total volume 30 days 3 months 6 monthly Tabular format for displaying Total Volume Name changed from aggregate volume to total - volume 1 yr Buy Sell 20,000 23,000 Buy Sell 20,000 12,000 Buy 10,000 33,000 Buy volume Sell volume 14, sep 2006 14, oct 2006 13, Nov 2006 43 k 32 k 43 k Dates shown here Slider divisions corrected Total volume shown by break-up of buy-sell
11. Use case 1(b): By Stock - Historic – Sector Comparison CONFIDENTIAL Tabular format for displaying Sector Comparison Visual format for displaying Sector Comparison 30 days 3 months 6 monthly 1 yr 14, sep 2006 14, oct 2006 13, Nov 2006 Financial Morgan 10,000 20,000 90,000 Buy 23,000 Sell 20,000 120,000 15,000 Sell 30,000 90,000 Morgan’s buy-sell volume and comparison to Financial sector total volume Total Sector Volume Buy volume Sell volume
12. Use case 1(b): By Stock - Historic – Client Activity for a stock CONFIDENTIAL Tabular format for displaying Client Activity 30 days 3 months 6 monthly 1 yr Buy Sell 20,000 23,000 Buy Sell 20,000 12,000 Buy 10,000 33,000 14, sep 2006 14, oct 2006 13, Nov 2006 43 k 32 k 43 k Total client activity for a stock User can drill down total client activity to get individual client buy-sell for that stock Buy volume Sell volume
13. Use case 2: Entry Point CONFIDENTIAL Stock Client BOA Bank of America Will provide the complete name below User Option - View by Client Submit
14. Use case 2(a): By Client - Real time - Open/ Execute CONFIDENTIAL Buy Stock 1 Stock 2 1,000 2,000 Visual format for displaying Open/ executed stocks by client Drill down shows buy-sell volumes of individual stocks held by the client Prioritization can be based on importance, most recent, or volume or other attributes Total Buy-volume of all stocks held by the client. The green hue differentiation shows buy-volumes for open order / buy –volume for executed orders Sell Open -Buy volume Executed -Buy volume Open -Sell volume Executed -Sell volume Buy 23,000 Sell 20,000 3,000 2,000 Total volume – open = 43 k Total volume – executed = 5 k 3000 4000
15. Use case 2(a): By Client - Real time – Sector Comparison CONFIDENTIAL IT Sector Stock 1 Stock 1 23,000 20,000 Visual format for displaying Sector Comparison 50,000 10,000 29,000 35,000 IT Finance Consumer User is able to view the composition of stocks with dollar volume on drill down No changes done as this slide was approved Dollar volume instead of stock volume
16. Use case 2(a): By Client - Real time – Regional Breakdown of Flow CONFIDENTIAL Visual format for displaying Regional breakdown of flow Asia Americas Europe Region wise break-up of Total dollar volumes held by my clients Others Drilled down to get client wise break up in a region Asia America Europe Others Stock 1 Stock 2 Stock 3 Total 10,000 3,000 7,000 Buy volume Sell volume Hue differentiation to show creak-up into buys-sells 3000 10000 5000 13000 2000 17000 10000 50000
17. Use case 2(b): By Client - Historic – Sector Comparison CONFIDENTIAL Visual format for displaying Sector Comparison 70,000 10,000 29,000 35,000 IT Finance Consumer 50,000 10,000 29,000 35,000 IT Finance Consumer 50,000 10,000 29,000 35,000 IT Finance 30 days 3 months 6 monthly 1 yr 14, sep 2006 14, Oct 2006 13, Nov 2006 Buy volume Sell volume 3,000 7,000 Comparison of client’s stocks with their parent sectors The hue differentiation used to show buy-sell break-up Parent sector dollar-volume Inter-Sector comparison
18. Use case 2(b): By Client – Historic – Top stocks traded CONFIDENTIAL Visual format for displaying Top Stocks traded Dollar volume instead of stock volume 30 days 3 months 6 monthly 1 yr Stock 1 Stock 2 Stock 3 Stock 4 Stock 5 10000 29000 Top traded stocks displayed using horizontal bar-graphs
19. Use case 2(b): By Client - Historic – Regional Breakdown CONFIDENTIAL Visual format for displaying Regional breakdown 30 days 3 months 6 monthly 1 yr Buy volume Sell volume Asia Americas Europe 10,000 7,000 3,000 Others Buys Sells Hue differentiation to break-up total into buy-sell. Asia Americas Europe 10,000 3,000 7,000 Others