The management of sludge in the informal sector, India
•Download as PPTX, PDF•
5 likes•2,249 views


Recommended
Recommended
More Related Content
What's hot
What's hot (20)
Similar to The management of sludge in the informal sector, India
Similar to The management of sludge in the informal sector, India (20)
More from zenrain man
More from zenrain man (12)
Recently uploaded
Recently uploaded (20)
The management of sludge in the informal sector, India
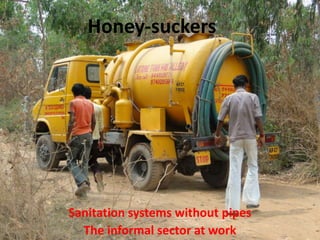
- 1. Honey-suckers Sanitation systems without pipes The informal sector at work
- 2. Partially based on a research Sludge Reuse from Mega-Cities – A Southern India Case Elisabeth Kvarnström, Vectura Consulting, Inc. Joep Verhagen, IRC Mats Nilsson, MN Context Vishwanath Srikantaiah, Biome (responsible for this slide show) Karan Singh, Biome Shubha Ramachandran, Biome
- 3. Bangalore – Population 9 million
- 4. India Sanitation (Census 2011) Septic Tanks Pit toilets • (million) • (million) • Urban 30.09 • Urban 55.97 • Rural 24.67 • Rural 17.68 • Total 54.76 • Total 73 .65 • Grand Total 128.41
- 5. Septic tanks and Pit Latrines Another 113 million rural households and 14 million urban households will build toilets and mostly pit toilets in the future This represents a massive sludge management challenge
- 6. Bangalore city sanitation (Census 2011) Septic Tanks 169,406 Pit toilets 325,175 • • Total 494,241
- 7. Current Drivers of Sanitation The employment of Manual Scavengers and Construction of Dry Latrines (Prohibition) Act 1993 • Karnataka has adopted this Act in 1997 • All toilets should have a water seal of at least 20cm. • No removal of human waste by human hands • 208,323 + 586,087 = 794,410 engaged in the practise
- 8. The city utilities response • Only 400 MLD out of 1000 MLD sewage generated is collected • Of the 400 MLD collected only around 180 MLD is treated • Sanitation is subsidized. People pay Rs 15 a month as sewage charges . • The externality is pollution of rivers
- 9. Foam rivers Untreated sewage primary cause
- 11. The informal sector in urban sanitation
- 13. In informal vacant sites
- 14. Pit toilet connected to WC
- 15. The user interface remains conventional
- 16. Pit toilets are common in the urban periphery
- 17. The Honeysucker vacum sucks a pit toilet
- 18. Mechanization eliminates manual scavenging
- 19. Trucks are now indigenously developed
- 20. They have a water jetting and vacum sucking pump (upto 30 H.P.)
- 22. The barrels – informal sector body building works
- 23. All over the country – Mobile Technology
- 25. We estimate nearly 300 honey-suckers in Bangalore
- 26. Protocol for safe disposal needs to be evolved
- 27. The sewage is nutrient rich but also pathogenic
- 28. Cost to building Rs 1200/ to Rs 3000/
- 29. Soil as a nutrient recipient rather than water
- 30. In many apartments a daily visit
- 31. In the most expensive of buildings
- 33. BWSSB (Guidelines for discharging domestic waste water from soak pits/ mobile toilets into Board Sewers in the premises of BWSSB STP) • Non refundable deposit amount equivalent to 6 months as indicated by the applicant at the rate of Rs 50/kl • Rs 50/kl charge per month • Domestic wastewater which will be disposed to the Board sewer in the premises of STP shall comply for BWSSB standards fixed for discharging trade effluent • Till now 75 permits have been issued for 1mld. ( Contrast with 494,221 households having septic tanks or pit toilets.)
- 34. The informal sectors response
- 35. The composting (?) pit
- 37. Compost sells for Rs 2500/- to Rs 3500/- a tractor load (4 cu mt)
- 38. Compost sample being collected for testing
- 39. Fertilizer value of sewage sludge Kind of Nutrient Average nutrient content in 1000 kg of sewage sludge 1000 kg of farm yard (10% TS) grams manure grams N 5.5 17.5 P2O5 17.5 17.5 K2O 0.75 65 S (Total) 12.5 25 MgO 30 15 Cu (Total) 1.2 0.03 Zn (Total) 1.5 0.15 Mn (Total) 0.6 0.4 Mo (Total) 0.01 0.001 B (Total) 0.03 0.035 Source: Ludwig Sasse, BORDA, 1998, DEWATS Decentralised Wastewater Treatment in Developing Countries
- 40. The city moves in
- 42. The crop
- 43. The fruits
- 44. The soil – alive with alive with earthworms and ants
- 46. The Economics For the truck • A Honeysucker costs Rs 800,000 /- • Charges Rs 1500 / per trip • Can do 5 trips in a day • Income Rs 7500 a day Rs 225,000 a month • Income in a year Rs 2.7 million • Expenditure for O and M - Rs 400,000 • Simple Return on Investment 6 months • One truck can service a population of 20,000 assuming a 2 year pit emptying cycle
- 47. The Economics for the household • Rs 1500 / every 2 years • Rs 60 / a month approx • Rs 15 a month if you are connected to the sewage
- 48. The Economics for a farmer • Free compost • On labour - expenditure Rs 5000 / • Savings per acre Rs 20,000 to Rs 50,000 /- on manure alone (10 to 25 tractor load per acre per year )
- 49. Land required to absorb nutrients • 250 tanker loads per Hectare • 2500 peoples nutrients can be absorbed by 1 Hectare of land • 50000 population town needs 20 Hectares of land • 100,000 - 40 Ha. • 1 Million 400 Hectares
- 50. Way forward… • Better understanding, from a business and sanitation perspective, of existing practices around the country • Embedding of current practices as an officially accepted option to sanitation service delivery for all urban dwellers
- 51. Way forward • Developing a protocol for the inclusion of non- sewerage based or on-plot sanitation systems in India • Developing a protocol and a legal frame-work for handling, transportation, composting and application of nutrients from septage and on-plot systems • Research on understanding nutrient – pathogens and safe application for nutrient reuse
- 52. Way forward • Civic authorities to incorporate sewage disposal systems in building plan approvals • Land use plans to earmark space for solid and liquid waste composting . • Separate systems for toilets and grey-water • Understanding the pit / groundwater interface and designing systems for non-pollution.
- 53. Guidelines for the safe use of wastewater, excreta and grey water Cost-effective strategies for controlling negative health impacts • Treatment of wastewater, excreta and greywater is used to prevent the contaminants from entering the environment. • Crop/produce restriction is used to minimize health risks to product consumers. • Waste application techniques (e.g. drip irrigation) and withholding periods aim to reduce contamination of the products or allow sufficient time for pathogen dieoff in the environment prior to harvest. • Exposure control methods (e.g. protective equipment, good hygiene) will prevent environmental contamination from reaching exposed groups. • Produce washing/rinsing/disinfection and cooking reduce exposures for product consumers. • Vector control reduces exposures for workers and local communities. • Chemotherapy and immunization can either prevent illness for those who are exposed or treat those who are ill and thus reduce future pathogen inputs into the wastewater, excreta or greywater. Source: WHO 2006