
Recommended
Recommended
More Related Content
What's hot
What's hot (20)
Viewers also liked
Viewers also liked (19)
Similar to Near- and mid-infrared spectroscopy determines algal composition
Similar to Near- and mid-infrared spectroscopy determines algal composition (20)
More from zhenhua82
More from zhenhua82 (7)
Recently uploaded
Recently uploaded (20)
Near- and mid-infrared spectroscopy determines algal composition
- 1. J Appl Phycol (2012) 24:1261–1267 DOI 10.1007/s10811-011-9774-0 Near- and mid-infrared spectroscopic determination of algal composition Walter Mulbry & James Reeves & Yan Liu & Zhenhua Ruan & Wei Liao Received: 23 March 2011 / Revised and accepted: 12 December 2011 / Published online: 4 January 2012 # Springer Science+Business Media B.V. 2011 (outside the USA) 2011 Abstract The objective of this study was to evaluate whether near-infrared reflectance spectroscopy (NIRS) or mid-infrared reflectance spectroscopy (MIRS) could be used to determine the composition of algal turf scrubber samples. We assayed a set of algal turf scrubber (ATS) samples (n0 117) by NIRS, MIRS, and conventional means for ash, total sugar, mono-sugar, total N, and P content. A subset of these samples (n 064) were assayed by conventional means, MIRS, and NIRS for total lipid and total fatty acid content. We developed calibrations using all the samples and a oneout cross-validation procedure under partial least-squares regression. This process was repeated using 75% of randomly selected samples to develop the calibration and the remaining samples as an independent test set. Results using the entire sample set demonstrated that NIRS and MIRS can accurately determine ash (r2 00.994 and 0.995, respectively) and total N (r2 00.787 and 0.820, respectively) content, but not phosphorus, total sugar, or mono-sugar content in ATS samples. Results using the 64 sample subset indicated that neither NIRS nor MIRS can accurately determine lipid or total fatty acid content in ATS samples. Keywords Near-infrared . Mid-infrared . Algal turf scrubber . Nitrogen . Phosphorus . Algae . Ash . Sugar . Fatty acid . Lipid W. Mulbry (*) : J. Reeves Environmental Management and Byproducts Utilization Laboratory, USDA/ARS, Building 308 BARC-East, 10,300 Baltimore Avenue, Beltsville, MD 20705, USA e-mail: walter.mulbry@ars.usda.gov Y. Liu : Z. Ruan : W. Liao Department of Biosystems & Agricultural Engineering, Michigan State University, East Lansing, MI, USA Introduction In contrast to the numerous technological advances used in studying algal taxonomy, physiology, and genetics, there have been relatively few technological advances in determining algal composition. Most algal samples are analyzed by conventional wet chemical methods, such as the Kjeldahl procedure for total N and P or by combustion techniques for total C, N, and ash. Analysis for other components typically requires extraction with organic solvents (for fatty acids) or acid hydrolysis (for sugars) followed by gas or liquid chromatography of the extracts or hydrolysates. These procedures, while accurate, are time-consuming, expensive, and generate chemical wastes. A multi-component analysis method that is rapid, robust, and inexpensive would be a valuable tool for many phycological studies. Infrared reflectance spectroscopy (IRS) is an alternative method of analysis for rapidly determining the composition of a wide variety of materials ranging from forages, grains, food products, manure, and soil (Roberts et al. 2004). Based on the relationships between spectral and compositional properties of a set of samples, IRS can provide accurate concentration estimates for multiple components in a few minutes once calibrations have been developed for the components of interest. Calibrations which relate the spectra to the analyte of interest (such as N content) can be developed using any number of regression techniques, although partial least squares (PLS) regression has come to be the most common method used. Based on principal components, PLS extracts factors based on the variance in the spectra related to the analyte of interest (Roberts et al. 2004). Mid-infrared reflectance spectroscopy (MIRS) uses light radiation between 2,500 and 25,000 nm (4,000 to 400 cm−1) and is based on fundamental absorptions and overtones of OH, NH, CH, and others such as C 0O (Smith 1999;
- 2. 1262 Workman and Weyer 2007). Near-infrared (NIR) spectroscopy (NIRS) uses light radiation between 400 and 2,500 nm (25,000 to 4,000 cm−1) and is based on overtones and combination bands of OH, NH, and CH absorptions found in the mid-IR. For spectral interpretation of biological samples, the mid-IR generally offers advantages over the NIR because it contains more spectral features relative to the NIR. Infrared reflectance spectroscopy requires very little sample material, only grinding as a preparative step, is nondestructive, and generates no wastes. Infrared reflectance spectroscopy has recently been used for semi-quantitative analysis of protein, carbohydrate, and lipids in pure cultures of Chlamydomonas reinhardtii and Scenedesmus subspicatus (James et al. 2011; Dean et al. 2010) and quantitative analysis of alginate and sterols in brown algae (Horn et al 1999; Bouzidi et al. 2008). However, the potential of IRS for quantitative analysis of algal components in samples containing multiple species of algae, bacteria, and sediment is unexplored. Although the standard use of mid-infrared spectral data has involved interpretation of spectral features for assessment of chemical features, mid-infrared is increasingly used for quantification of sample properties by chemometrics. The use of chemometrics does not depend on a full understanding of the physical relationship between spectral data and chemical functional groups. Instead, it is based on mathematical relationships between spectra and reference data. A calibration is developed by using all but one sample to determine spectral–analyte relationships and the remaining sample to test the results; this is done n-times to find the best equation for the samples in question and is called a oneout cross-validation. While this provides a good indication of the feasibility of calibrations to determine future samples, predicting the values on a second set of samples not used in the calibration development process (an independent test set) is the best. Although the gap in spectral understanding may be disconcerting for some researchers, the use of chemometrics for real-world applications has proven to be immensely successful (Williams and Norris 1987). There is considerable risk in speculating on which spectral features that a PLS model uses for accurate predictions. Algal turf scrubber (ATS) systems employ pulsed water flow over screens or netting in very shallow raceways to cultivate native filamentous algae using nutrients from agricultural wastewaters and natural waters (reviewed in Adey et al. 2011). Harvested solids from ATS raceways consist of multiple species of algae, attached microorganisms, and trapped sediment. The composition of harvested solids varies by location, through time, and with harvesting method. Although the primary value of such systems lies in their relatively low cost of nutrient removal (cost per kg N and/or per kg P), the algal byproduct also has value as a fertilizer and as a potential bio-energy feedstock. For this reason, J Appl Phycol (2012) 24:1261–1267 relevant attributes of ATS algae include N and P content as well as ash, lipid, fatty acid, and sugar content. Evaluation of ATS performance and characterization of ATS algae grown under different flow and loading rates are slowed by the need to perform multiple analyses (N, P, ash, lipid, fatty acid, sugar content) on each sample. For this reason, we sought to determine whether IRS could be used to rapidly determine one or more of these components in ATS algae. The specific objective of this study was to evaluate whether NIRS or MIRS could be used to determine the composition (N, P, ash, sugar, lipid, and fatty acid) of dried ATS samples. As a consequence of prior studies using ATS units grown using a variety of natural waters and agricultural wastewaters, a collection of dried ATS samples that span a broad range of N, P, ash, and sugar contents was available for study. Lipid and fatty acid content also vary within these samples but span narrower ranges. For the purpose of this study, we selected 117 ATS samples that span the largest range of N, P, ash, sugar, lipid, and fatty acid contents in the collection. Methods The sample set was composed of 80 algal samples from indoor laboratory-scale ATS units, 31 samples from outdoor pilot-scale raceways, and 6 samples from lab-scale ATS units grown at Chesapeake Bay estuaries. Algae was produced using indoor lab-scale ATS units (Adey and Loveland 2007) with raw and anaerobically digested dairy manure effluent and raw swine manure effluent as previously described (Kebede-Westhead et al. 2003, 2006). Lab-scale ATS units containing 1 m2 growing area were operated in a semi-continuous mode by continuously recycling effluent, adding manure effluent daily, and adding distilled water as needed to compensate for water lost by evaporation. Manure loading rates corresponded to approximately 0.3 to 2 g total nitrogen (TN) m−2 day−1. The algal consortia was dominated by filamentous green algae including Rhizoclonium hieroglyphicum (C.A. Agardh) (the most abundant species), Microspora willeana Lagerheim., Ulothrix ozonata (Weber and Mohr) Kütz, R. hieroglyphicum (C.A. Agardh) Kützing, and Oedogonium sp. Algae was produced from 2003 to 2006 using four 30-m2 outdoor pilot-scale ATS raceways (Mulbry et al. 2008). The recirculating effluent consisted of freshwater and daily additions of raw or anaerobically digested dairy manure effluent from the USDA’s Dairy Research Unit in Beltsville, Maryland, USA. Dominant taxa within the algal consortia were similar to those identified in the lab-scale ATS units. Algae were produced using lab-scale ATS units that were located at two Chesapeake Bay estuary sites from 2007 to 2008 (Mulbry et al. 2010). Dominant taxa varied seasonally
- 3. J Appl Phycol (2012) 24:1261–1267 at these sites. The filamentous diatom, Melosira sp., dominated in the winter/spring and the blue-green alga, Lygnbya sp., and the green alga, Spirogyra sp., dominated in the summer/fall. Wet algal biomass was harvested weekly from all of the ATS systems using wet/dry vacuums, dewatered by sieving harvested material through 2-mm mesh nylon netting (Aquatic Ecosystems, USA) to approximately 10% solids content, then air-dried for approximately 48 hrs using electric fans to approximately 90% solid content. Dried algal samples were ground in a Wiley Mill to pass a 3-mm sieve and stored in sealed plastic bags at 20–25°C (Mulbry et al. 2006). Analysis of TKN, TP, ash, lipid, and fatty acid content TKN and TP were determined using total Kjeldahl block digestion followed by flow injection analysis (model 8000, Lachat Instruments, USA) (APHA 1995). Total lipid content was determined gravimetrically after sample extraction with chloroform/methanol mixture using an accelerated solvent extraction procedure (Mulbry et al. 2009). Fatty acid content was determined by gas chromatography analysis of lipid extracts (Mulbry et al. 2009). Analysis of total reducing sugar and monosaccharide content Prior to analyses for total and mono-sugar content, 0.5-g aliquots of algal samples were mixed with 10 mL of 4% (w/w) sulfuric acid and hydrolyzed in an autoclave (30 min, 120°C). Hydrolysates were neutralized to pH 4–5 using solid calcium carbonate, diluted to 50 mL using distilled water, and filtered using 0.22 μm Millex-GC syringe filter units (Millipore, USA). Concentrations of total reducing sugars in the filtered hydrolysates were determined using a dinitrosalicylic acid method (Miller 1959). Monosaccharide concentrations in the filtered hydrolysates were determined by HPLC using a Shimadzu 2010 HPLC system equipped with a Bio-rad Aminex® HPZ-87P (300×7.8 mm) analytical column and a refractive index detector. The mobile phase was ultrapure water with a flow rate of 0.6 mL min−1, and the column temperature was 60°C. High purity standards (glucose, xylose, galactose, arabinose, and mannose) were obtained from Sigma-Aldrich. Spectroscopic analysis Samples were ground to pass a 20-mesh (0.85 mm) screen using a Udy Cyclone Sample Mill (Udy Corp., USA) prior to spectroscopic analyses. Sample aliquots (approximately 80 mg) were scanned in the mid-IR on a Digilab (Bio-Rad, USA) FTS-7000 Fourier transform spectrometer equipped with a KBr (potassium bromide) beam splitter and a Peltier- 1263 cooled DGTS (deuterated glycine trisulfate) detector. Samples were scanned from 4,000 to 400 cm−1 (2,500 to 25,000 nm) at 4 cm−1 resolution with 64 co-added scans per spectrum. Scanning was performed using a Pike Autodiff autosampler/reflectance accessory (Pike Technologies, USA) with KBr used as the reference standard. Samples were scanned in the NIR on a Digilab FTS-7000 Fourier transform spectrometer equipped with a quartz beam splitter and an InSb (indium antimonide) liquid nitrogen cooled detector. Samples were scanned from 9,091 to 4,000 cm−1 (1,100–2,500 nm) at 4 cm−1 resolution with 64 co-added scans per spectrum. Scanning was performed using the Pike Autodiff autosampler/reflectance accessory with sulfur used as the reference standard. Statistical analysis and calibrations Summary statistics and correlation analysis were performed using SAS (SAS Institute 1988) PROC Means and FREQ version 8. NIR and MIR calibrations were performed by PLSR using SAS 9.2 based on a one-out cross-validation (Reeves and Delwiche 2003, 2004). In this method, an equation is formed using X − 1 samples where X is the number of samples and the remaining sample is predicted with this equation, and this is done X times and a summary equation is created to predict all of the samples. All spectra and data were mean-centered and variance-scaled. Spectral pre-treatments (derivatives and scatter correction) were tested to find the best calibration (Reeves and Delwiche 2003, 2004). Calibrations were also developed in the same manner using 75% of the samples (90 of 117 samples for N, P, ash, total, and mono-sugar tests; 50 of 64 samples for lipid and fatty acid tests) for the one-out cross-validation and the remaining samples as an independent test set. The calibration and test sets were randomly selected and the process repeated ten times (i.e., ten calibrations developed and tested). Results Sample selection and composition Table 1 shows the composition of the 117 sample set used for calibration development for ash, N, P, total, and monosugar content. The lipid and fatty acid contents of the 64 sample subset used for calibration development of those components are also shown. The majority of samples (80 of 117) were from manure loading rate studies using indoor ATS units grown using dairy or swine manure effluent. These samples had low ash content values (5–13% DW) and a large range of N (2.3% to 7.7% DW), P (0.3% to 1.9% DW), and total sugar (8–51% DW) content values. Thirty-
- 4. 1264 J Appl Phycol (2012) 24:1261–1267 Table 1 Sample composition (% DW) as determined by conventional techniques Assay Mean All samples (n0117) Ash 16.6 Total N 4.6 P 0.75 Total sugar 17.8 Mono-sugars 15.1 Sample subset (n064) Total lipid 6.1 Total fatty acids 0.91 SD Maximum Minimum 16.6 1.6 0.32 9.5 8.3 80 7.7 1.9 51 40 5.2 1.1 0.10 2.5 1.6 2.3 0.46 13.5 2.9 0.50 0.20 one samples were included from pilot-scale outdoor ATS raceways grown using dairy manure effluent. These samples had broad ranges of N (1.7% to 7.3% DW), P (0.3% to 1.2% DW), and total sugar (4–30% DW) but were specifically chosen because of their large range of ash content values (13–65% DW) compared to samples from the indoor units. Six samples were included from lab-scale ATS units grown at Chesapeake Bay estuaries. These samples were chosen because they contained a much more diverse algal consortia than the other ATS samples, had low N (1.1% to 2.2% DW), P (0.1% to 0.4% DW), and total sugar (3–7% DW) values and very high ash content values (74% to 80% DW). Overall, the 117 sample set represented a broad range of composition, with total N, P, ash, and total sugar contents varying by approximately 7-fold (1.1% to 7.7% TN), 19-fold (0.1% to 1.9% TP), 16-fold (5% to 80% ash), and 20-fold (2.5% to 51% total sugar). Lipid and fatty acid composition values varied more than 10-fold among the samples (0.5% to 13.5% and 0.2% to 2.9%, respectively) but were quite low compared with high-lipid content strains. Spectra In general, sample spectra had similar shape within either spectral range (NIR or MIR) but had significantly different peak intensities. Spectra of two contrasting samples are shown in Fig. 1. Sample 1 contains 9% ash, 7% N, and 1% P and is from a lab-scale ATS unit grown indoors at a high loading rate (corresponding to approximately 2 g TN, 0.3 g P m−2 day−1). Sample 2 contains 31% ash, 2.3% N, and 0.4% P and is from an outdoor pilot-scale ATS raceway grown at a low nutrient loading rate (corresponding to approximately 0.4 g TN, 0.1 g P m−2 day−1). Sample 2 possesses sharp peaks in the mid-IR (Fig. 1a) at around 3,600 which are due to clays and peaks around 1,800– 2,000 which are due to silica, all of which are consistent with the much higher ash content. The mid-IR peaks at 2,900–2,800 in sample 1 are CH bands due to organic Fig. 1 Spectra of two algal samples varying in ash, nitrogen, and phosphorus content by MIRS (a) and NIRS (b). Sample 1 contains 9% ash, 7% N, and 1% P. Sample 2 contains 31% ash, 2.3% N, and 0.4% P. In a, peaks due to silica (1,870 and 1,980 cm−1) and clay content (3,700 cm−1) are prominent in the MIR spectrum of the high ash sample 2 matter. The stronger absorptions at 2,900–2,800 in sample 1 are consistent with a higher organic matter content, i.e., lower inorganic or ash content equals more organic matter. Based on texts on spectral interpretation, one would be highly likely to assign other spectral bands to organic materials; however, previous work with other high ash samples (such as soils) has shown this to be in error. Silica has very strong bands in the same spectral region, and it is not possible without spectral subtraction of ashed samples to
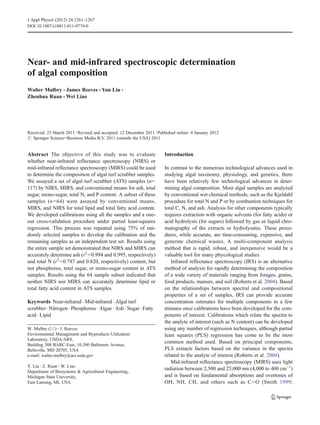
- 5. J Appl Phycol (2012) 24:1261–1267 1265 separate out the organic bands. This is a problem with many high ash samples, and mineral bands exist in the same place as organic bands discussed in numerous texts (Reeves et al. 2005). Even with ashing, problems exist because ashing can also change inorganics such as clays. Much of the information in the literature on soil organic matter is incorrect for this reason. We therefore interpreted only what can be interpreted with reasonable assurance of being correct. NIR spectra (Fig. 1b) showed relatively few features compared to the MIR spectra (Fig. 1a) and were heavily influenced by ash content. Within the MIR spectra, clay, and silica peaks were distinctive features in high ash samples (such as sample 2), but these peaks did not obscure other peaks nor distort the overall spectra. Calibrations PLSR results achieved with all 117 samples, and the 64 sample subset are presented in Table 2. As shown in the table, calibration equations were developed using different spectral pre-treatments to deconvolve the overlapping peaks found in the spectra (in order to better find the information of interest) and to correct for baseline differences due to scattering differences in the samples caused by differences in particle size (finer particles act more like a mirrored surface and thus have overall lower absorbance). Another scatter correction pre-treatment was used to correct for differences in the slope of baselines caused by the fact that particles scatter light differently at different wavelengths. Table 2 Partial least squares regression of mid-IR and near-IR results using total sample set (ash, P, N, total, and mono-sugars) or sample subset (lipid, fatty acid) Assay Derivative, gap The type of derivative used here is termed a gap derivative in the points are skipped, i.e., 1st derivative0Point Xi −Point X(i+n) where n is the gap. Pre-treatments are typically chosen because of prior experience with other data sets. Ultimately, the best pre-treatment depends on the samples and analytes in question and is not known a priori. Finally, PLS condenses the spectral data to a more limited set of factors which contain the spectral information of interest for a specific calibration. In general, the fewer factors the better, but only testing can determine this. Too many factors can lead to over-fitting or random correlations, so the number is limited. In our case, the number of factors to use was determined by an F test based on the significance of the calibration improvement on adding another factor. In general, PLSR results using MIRS or NIRS were very similar. The one-out cross-calibration results using MIRS and NIRS were quite good for ash (r2 >0.99) and P (r2 > 0.83), moderate for total N (r2 >0.78) and lipids (r2 >0.79), and poor for fatty acids (r2 <0.6) and total and mono-sugar content (r2 <0.67 and r2 <0.3, respectively). Plots of laboratory versus MIRS-predicted values of ash and laboratory versus NIRS-predicted values of N are shown in Fig. 2. For samples containing <25% ash, predicted values of ash were generally within 10% of measured values. For samples containing >25% ash, predicted values were generally within 3% of measured values. Predicted values of N were generally within 20% of measured values. In general, the validation test set results were slightly lower but very similar to the calibration results. However, Number of factors Calibration Test set r2 Mid-IR results (117 sample set) Ash 2nd, g032 P 1st, g08 TKN 2nd, g04 Total sugar 2nd, g04 Mono-sugar 2nd, g04 Mid-IR results (64 sample subset) Lipid 2nd, g04 Fatty acid 2nd, g04 Near-IR results (117 sample set) Ash 2nd, g016 P 2nd, g04 TKN 2nd, g064 Total sugars 2nd, g04 Mono-sugars 2nd, g08 Near-IR results (64 sample subset) Lipid 2nd, g064 Fatty acid 2nd, g04 RMSD r2 RMSD 9 8 3 2 1 0.995 0.835 0.820 0.665 0.222 0.011 0.122 0.641 0.059 0.090 0.983 0.533 0.709 0.533 0.194 0.026 0.240 0.882 0.070 0.101 2 2 0.790 0.505 1.017 0.315 0.554 0.285 1.604 0.392 7 4 3 2 1 0.994 0.856 0.787 0.624 0.283 0.011 0.120 0.714 0.062 0.085 0.956 0.557 0.737 0.425 0.187 0.041 0.224 0.846 0.079 0.102 4 2 0.855 0.583 0.823 0.283 0.643 0.208 1.543 0.395
- 6. 1266 J Appl Phycol (2012) 24:1261–1267 a 100 2 Ash predicted by MIRS (% DW) r =0.99 80 60 40 Predicted Actual 20 0 0 20 40 60 80 100 Ash (% DW) N Predicted by MIRS (% DW) b 8 r2=0.82 6 4 Predicted Actual 2 0 0 2 4 6 8 TKN (% DW) Fig. 2 Relationship between laboratory values of ash and values predicted by MIRS (a) and laboratory values of N and values predicted by MIRS (b) the validation test set results for P and lipid content (r2 00.53 to 0.64) were significantly lower than the calibration results (r2 00.80 to 0.85) for both MIRS and NIRS. This suggests that, despite the high initial correlations of predicted versus measured content (Table 2), neither P nor lipid content can be predicted by MIRS or NIRS in ATS samples. Discussion Spectral results showed that, with the exception of ash content, there were no readily identifiable MIR peaks that correlated with the content of any other constituent that we determined by other means (N, P, sugar, lipid, fatty acid). This is not uncommon as the spectral signatures of many organic fractions overlap even in the MIR, making the detection of specific peaks related to a component difficult. For example, lipids contribute CH bands at 2,900–2,800 in the MIR, but so do proteins and carbohydrates making further delineation impossible. It is because of this lack of specific, delineated peaks for specific analytes, that regression using multiple peaks based on stepwise selection methods of the entire spectra as in PLSR are used for developing calibrations for quantitative analysis. Our PLSR results suggest that either MIRS or NIRS can be used to determine ash and N content in algal samples. These results are in agreement with previous studies that have demonstrated that NIRS can be used to determine nitrogen, but not phosphorus content, in manures and forages (Shenk et al. 1992). Hay et al. (2010) recently reported the use of NIR to determine N, C, and phlorotannin content in dried samples of the brown alga Sargassum flavicans. Their study yielded much higher validation r2 values (0.98) for N compared to the values (r2 00.71 to 0.74) determined in our study. Although we cannot explain the reason for the differences in r2 values between the two studies, it is likely that their sample set (consisting of samples from a single species) was much more homogenous than our ATS samples. Another possible factor could be that the range of N content values was different in two sample sets (0.6% to 1.5% N in their study versus 1.1% to 7% N in this study). Our results suggest that, despite the high initial correlations of predicted versus measured content (Table 2), neither P nor lipid content can be predicted by MIRS or NIRS. This is labeled as a lack of robustness, i.e., equations developed with one set of samples are not useful with another set which is the ultimate objective, i.e., to predict new samples without the need for conducting traditional wet chemistries. It is possible that with more samples, a more robust calibration might be achievable, but the results here do not offer a great deal of promise. One explanation for how a calibration can be developed, but yet not have predictive potential, is that the calibration is based on surrogate parameters rather than the analyte of interest. This was demonstrated for salt in water where the salt alters the water spectrum, but is not spectrally detectable itself (Hirschfeld 1985). The problem is that such surrogate relationships may not hold in the new samples to be predicted by the calibration. Shenk et al. (1992) show similar effects of minerals in forages. One problem with PLS calibrations is trying to determine the relationship between spectral and analytical data without generating random correlations. Mathematically, if one has 50 samples or unknowns and 51 spectral data points or knowns, a perfect equation, no matter how outlandish, is possible. Reducing the spectra to fewer PLS factors is an effort to reduce this potential, but it is still always a possibility. Convolved with this is the need for sufficient factors to cover the diversity in the samples in question, i.e., all ash is not chemically identical in all samples. For these reasons, the more samples available the better, with our experience showing that 100 or more is best and 50 or less can be quite deceptive. While the calibrations using all the samples were based on sufficient samples, the test split was somewhat deficient. As a result, it is possible that with more samples,
- 7. J Appl Phycol (2012) 24:1261–1267 the calibrations for P or lipid content might be improved. Calibration development and testing can often be most efficiently done where large databases of samples with already available data are available for study or are developed over time as samples are analyzed by conventional means. Overall, these results show that NIR and MIR have significant potential for analyzing algae samples. Considering the diverse and increasing interest in growing algae for feeds to biofuels, the potential applications of these spectroscopic methods for rapidly and inexpensively analyzing algae are obvious. Another related use would be for analyzing the cultivation conditions (media, nutrients, water) if algae are to be grown on a massive scale. While it may not be possible to determine every analyte of interest by NIR or MIR, any would greatly help to reduce the need for conventional analysis. These methods require only one spectrum, available in minutes at most, to provide values for as many analytes as one has calibrations for. Once sufficient conventional analysis has been completed for calibration development, and a single scan of a sample can provide dozens or more analyte values in a few minutes and in real time. With real-time measurements, conditions can be changed immediately to correct problems rather than days later when the lab results come back. References Adey W, Loveland K (2007) Dynamic aquaria: building living ecosystems. Academic, New York Adey W, Kangas P, Mulbry W (2011) Algal Turf Scrubbing: Cleaning Surface Waters with Solar Energy while Producing a Biofuel. Bioscience 61:434–441 APHA (1995) Standard methods for the examination of water and wastewater, 19th edn. American Public Health Association, Washington, DC Bouzidi N, Daghbouche Y, El Hattab M, Aliche Z, Culioli G, Piovetti L, Garrigues S, de la Guardia M (2008) Determination of total sterols in brown algae by Fourier transform infrared spectroscopy. Analytica Chimica Acta 616:185–189 Dean AP, Sigee DC, Estrada B, Pittman JK (2010) Using FTIR spectroscopy for rapid determination of lipid accumulation in response to nitrogen limitation in freshwater microalgae. Bioresource Technol 101:4499–4507 James GO, Hocart CH, Hillier W, Chen H, Kordbacheh F, Price GD, Djordjevic MA (2011) Fatty acid profiling of Chlamydomonas reinhardtii under nitrogen deprivation. Bioresource Technol 102:3343–3351 1267 Hay KB, Millers KA, Poore AGB, Lovelock CE (2010) The use of near infrared reflectance spectroscopy for characterization of brown algal tissue. J Phycol 46:937–946 Hirschfeld T (1985) Salinity determination using NIRA. Appl Spectrosc 39:740–741 Horn SJ, Moen E, Ostgaard K (1999) Direct determination of alginate content in brown algae by near infrared spectroscopy. J Appl Phycol 11:9–13 Kebede-Westhead E, Pizarro C, Mulbry W (2003) Production and nutrient removal by periphyton grown under different loading rates of anaerobically digested flushed dairy manure. J Phycol 39:1275–1282 Kebede-Westhead E, Pizarro C, Mulbry W (2006) Treatment of swine manure effluent using freshwater algae: production, nutrient recovery, and elemental composition of algal biomass at four effluent loading rates. J Appl Phycol 18:41–46 Miller GL (1959) Use of dinitrosalicylic acid reagent for determination of reducing sugar. Anal Chem 31:426–428 Mulbry W, Kondrad S, Pizarro P (2006) Biofertilizers from algal treatment of dairy and swine manure effluents: characterization of algal biomass as a slow release fertilizer. J Veg Sci 12:107–125 Mulbry W, Kondrad S, Pizarro C, Kebede-Westhead E (2008) Treatment of dairy manure effluent using freshwater algae: algal productivity and recovery of manure nutrients using pilot-scale algal turf scrubbers. Bioresource Technol 99:8137–8142 Mulbry W, Kondrad S, Buyer J (2009) Treatment of dairy and swine manure effluents using freshwater algae: fatty acid content and composition of algal biomass at different manure loading rates. J Appl Phycol 20:1079–1085 Mulbry W, Kangas P, Kondrad S (2010) Toward scrubbing the Bay: nutrient removal using small algal turf scrubbers on Chesapeake Bay tributaries. Ecol Eng 36:536–541 Reeves JB, Delwiche SR (2003) SAS partial least squares regression for analysis of spectroscopic data. J Near Infrared Spec 11:415–431 Reeves JB, Delwiche SR (2004) Using SAS for PLS calibrations of spectroscopic data. NIRS News 15:10–15 Reeves JB, Francis BA, Hamilton SK (2005) Specular reflection and diffuse reflectance spectroscopy of soils. Appl Spectrosc 59:39–46 Roberts CA, Workman J, Reeves JB (2004) (Eds) Near-infrared spectroscopy in agriculture. Volume 44 in the series Agronomy. American Societies of Agronomy, Crop and Soil Science, Madison SAS Institute (1988) SAS/STAT user’s guide. Release 6.03 ed. SAS Institute, Cary Shenk JS, Workman JJ, Westerhaus MO (1992) Application of NIR spectroscopy to agricultural products. In: Burns DA, Ciurczak EW (eds) Handbook of near-infrared analysis. CRC Press, Boca Raton, pp 383–431 Smith B (1999) Infrared spectral interpretation: a systematic approach. CRC Press, Taylor & Francis, New York Williams PC, Norris K (1987) Near-infrared technology in the agricultural and food industries. American Association of Cereal Chemistry, St. Paul Workman J, Weyer L (2007) Practical guide to interpretive nearinfrared spectroscopy. CRC Press, New York